Jul 15, 2009 - quench ring. A crucial component of the reactor is the quench ring. A rapid .... quench ring are opened and the tape heater is switched on. In all.
Study of a Quench Device for the Synthesis and Hydrolysis of Zn Nanoparticles: Modeling and Experiments
Tareq Abu Hamed Luke Venstrom Aiman Alshare Marc Brülhart
The synthesis and hydrolysis of zinc nanoparticles are carried out in a tubular reactor. A key component of the reactor is a coaxial jet quench device. Three coaxial and multi-inlet confined jets mix Zn共g兲, steam, and argon to produce and hydrolyze zinc nanoparticles. The performance of the quench device is assessed with computational fluid dynamics modeling and measurements of hydrogen conversion and particle size and composition. Numerical data elucidate the impact of varying jet flow rates on temperature and velocity distributions within the reactor. Experiments produce hydrogen conversions of 61–79%. Particle deposition on sections of the reactor surface above 650 K favors hydrolysis. Residence time for in-flight particles is less than 1 s and these particles are partially hydrolyzed. 关DOI: 10.1115/1.3142825兴
Jane H. Davidson Department of Mechanical Engineering, University of Minnesota, Minneapolis, MN 55455
1
Introduction
A process to produce hydrogen without the use of fossil fuel is solar thermochemical water splitting via a two-step metal redox cycle. The zinc-zinc oxide pair is suitable for this cycle because zinc oxide dissociates at temperatures attainable in concentrating solar reactors without carbothermal reduction 关1–7兴. In the first solar step of the cycle, zinc oxide spontaneously dissociates to zinc and oxygen in the endothermic reaction: ZnO共s兲 ⇔ Zn共g兲 + 1/2O2共g兲
⌬H2300
K
= 395 kJ/mol
共1兲
The second nonsolar step is the exothermic hydrolysis of zinc yielding hydrogen and zinc oxide, which is kinetically favored at or above 650 K: Zn共s兲 + H2O共g兲 → ZnO共s兲 + H2共g兲
⌬H650
K
= − 104 kJ/mol 共2兲
The Gibbs free energy of reaction 共2兲 at 650 K is ⫺74 kJ/mol, indicating negligible reverse reaction. The ZnO produced in the second step is recycled to the first step, completing the thermochemical cycle. An exergy analysis of the cycle is completed in Ref. 关1兴. The present study focuses on the second hydrolysis step. Ideally, all of the zinc reactant would be converted to hydrogen and zinc oxide and these products would be recovered continuously. In that respect, researchers have considered hydrolysis of Zn aerosol nanoparticles 关8–15兴. The hypothesis is that the large surface to volume ratio of nanoparticles will promote rapid and complete hydrolysis and that an aerosol will permit continuous collection of the ZnO product. In initial experiments conducted at the Swiss Federal Institute of Technology, ETH-Zurich, evaporation of Zn was followed by in situ hydrolysis with steam in an argon carrier gas 关8,9兴. According to our analyses, such a process, including evaporating zinc and Contributed by the Solar Energy Engineering Division of ASME for publication in the JOURNAL OF SOLAR ENERGY ENGINEERING. Manuscript received January 7, 2009; final manuscript received April 6, 2009; published online July 15, 2009. Review conducted by Aldo Steinfeld. Paper presented at the 2008 ASME Heat Transfer, Fluids, Energy, Solar, and Nano Conferences 共HTFESN2008兲, Jacksonville, FL, August 10–14, 2008.
Journal of Solar Energy Engineering
making steam, will reduce the exergy efficiency of the cycle from 29% to 23% at 5000 suns concentration. At 10,000 suns, the estimated efficiency drops from 36% to 27%. The ETH group achieved hydrogen conversion as high as 72% at an evaporation temperature of 1023 K 关8,9兴. Hydrogen production was attributed to hydrolysis of Zn on the reactor walls and on a stainless steel rod that extended axially along the center of the reactor. Near the reactor inlet, where temperatures were above the saturation temperature of Zn, the authors suggest that ZnO was formed by heterogeneous reaction of Zn and steam adsorbed on the reactor surfaces. At downstream positions where the reactor temperature was below the saturation temperature of Zn, both ZnO and Zn were present on the reactor surfaces. The authors infer from the morphology of the deposit that hydrolysis of Zn particles followed their deposition. Particles collected on a glass fiber filter positioned at the reactor exit were pure Zn. The mass of particles on the filter was not reported. Experiments in a hot wall tubular reactor have been performed at the University of Minnesota 关10兴. The influences of the reactor residence time and surface temperature on hydrogen conversion were measured for evaporation temperatures of 1023 K and 1073 K. The hydrogen conversions were 88% and 96% for temperatures above Zn saturation and residence times of 1.7 s and 2.1 s, respectively. The presence and adhesion of ZnO on the quartz reactor surface suggest a probable mechanism for hydrolysis is heterogeneous reaction of adsorbed Zn and steam, similar to the findings of ETH 关8,9兴. Later experiments at the University of Minnesota were the first to obtain in situ measurement of the size distribution and concentration of aerosol nanoparticles at temperatures below the Zn saturation temperature 关11兴. Particle concentration was greater than 700,000 particles/ cm3. The maximum particle size, based on an assumption of spherical particles, was 28 nm. Hydrogen conversions were 51–56% for a residence time of 0.5 s. Hydrogen production was attributed to hydrolysis of Zn nanoparticles in the carrier gas stream and particles on the reactor wall. Particles scraped from the wall of the reactor were 62% ZnO or greater above 648 K. Below 648 K, the ZnO content was about 30%. Particles collected from the effluent gas stream on a fiber filter represented 9–14% of the evaporated zinc mass. The collected particles were pure Zn. Ernst et al. 关12,13兴 studied Zn hydrolysis in a reactor divided into evaporation, condensation, and hydrolysis zones. They also
Copyright © 2009 by ASME
AUGUST 2009, Vol. 131 / 031018-1
Downloaded 07 Jan 2010 to 128.101.98.21. Redistribution subject to ASME license or copyright; see http://www.asme.org/terms/Terms_Use.cfm
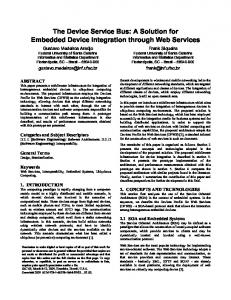
Fig. 1 Experimental apparatus
observed that the conversion of zinc to hydrogen decreased with decreasing reactor temperature, and that hydrolysis occurred primarily by reaction of nanoparticles at the reactor wall. At 573 K and a residence time of 7 s, H2 conversion was 60% and that attributable to in-flight particles was 13%. At 850 K and a residence time of 5 s, H2 conversion was 90% and the maximum conversion attributable to the aerosol was 17%. Melchior et al. 关14兴 attempted to improve the nanoparticle synthesis process by using fast quench rates between 104 K / s and 106 K / s. For quench rates on the order of 104 K / s, they measured hydrogen conversions up to 95%. This high conversion was attributed to the hydrolysis of aerosol deposited on hot surfaces in the quench device and reactor tube. Roughly 10% of the evaporated Zn mass was recovered at a filter located outside the hot reaction zone. For higher quench rates on the order of 106 K / s, hydrogen conversion dropped to 66%. As much as 40% of the evaporated zinc mass was collected at the filter. The maximum conversion attributable to hydrolysis of in-flight particles was 22%, representing a modest improvement in performance over the reactor of Ernst et al. 关12,13兴. Funke et al. 关15兴 studied the hydrolysis of Zn by feeding 158 nm Zn particles into a flow tube reactor at temperatures between 653 K and 813 K, rather than forming particles in situ. The highest hydrogen conversion observed was 24% at 813 K for a gas residence time of 0.6 s. Most of the particles were deposited on the walls of the reactor. Only 10–30% of the Zn nanoparticles were collected from the gas stream on a filter. Furthermore, the particles collected on the filter were only partially hydrolyzed, while the particles on the reactor walls were completely hydrolyzed. Using thermogravimetric analysis 共TGA兲, they measured an activation energy for Zn nanoparticle hydrolysis of 132⫾ 27 kJ/ mol. In comparison, Ernst et al. 关12,16兴 reported an activation energy of 43⫾ 7 kJ/ mol for 164 nm particles. This paper presents data obtained in a second generation tubular reactor built at the University of Minnesota. The key new component of the reactor is a co-axial jet quencher that is referred to as the “quench ring.” The device rapidly quenches zinc vapor with a mixture of steam and argon to form an aerosol of zinc and, due to simultaneous reaction, zinc oxide nanoparticles. The ring was originally conceived to increase the rate at which Zn共g兲 is 031018-2 / Vol. 131, AUGUST 2009
cooled to below the saturation temperature and to minimize particle deposition on the wall of the reactor by creating a fluid barrier there via one of the rings of concentric jets. The use of a fluid barrier at the wall to prevent particle deposition has not been considered in previous Zn hydrolysis reactors. The performance of the quench ring is assessed using computational fluid dynamics and experiments conducted at varying jet flow rates. Measurements include hydrogen conversion and analysis of the size, morphology, and chemical composition of particles.
2
Reactor Design
Figure 1 is a sketch 共not to scale兲 of the reactor and instrumentation. The reactor is divided into four sections: an evaporation section within an electric furnace 共x ⱕ 27 cm兲, the quench ring 共27 cmⱕ x ⱕ 28 cm兲, a reaction section 共28 cmⱕ x ⱕ 48 cm兲, and a cooler collection section 共48 cmⱕ x ⱕ 65 cm兲. The reactor consists of inner and outer quartz tubes. The outer quartz tube is 2.0 cm i.d. 共inside diameter兲. It is held in a concentric cylindrical electric furnace 共Thermolyne 97500兲 with two insulated mounts. The second mount is positioned just downstream of the quench ring between x = 28 cm and 38 cm and is labeled as insulation in Fig. 1. Outside the furnace 共38 cmⱕ x ⱕ 48 cm兲, the quartz tube is wrapped with an electrical tape heater to maintain the reaction section at temperatures favorable to hydrolysis, 630– 700 K. At x = 48 cm, the 2.0 cm i.d. quartz tube is connected to a 2.2 cm i.d. stainless steel tube, which is not heated. The objective of this section is to cool the gas stream to temperatures at which the rate of hydrolysis is very slow. A glass fiber filter at x = 65 cm captures effluent particles. The inner quartz tube houses a cylindrical crucible 共at x = 0 cm兲 containing zinc pellets and sits within the evaporation section inside the outer quartz tube. The inner tube is 1.5 cm i.d. at the crucible and tapers to 0.4 cm where it terminates at the quench ring. A crucial component of the reactor is the quench ring. A rapid quench results in the synthesis of particles with large specific surface area 关17兴, and as was discussed in Sec. 1, it is thought that large specific surface area enhances the rate of hydrolysis. To achieve rapid cooling rates, the quench ring uses three co-axial Transactions of the ASME
Downloaded 07 Jan 2010 to 128.101.98.21. Redistribution subject to ASME license or copyright; see http://www.asme.org/terms/Terms_Use.cfm
Fig. 2 Quench ring geometry „dimensions are mm…
and multi-inlet jets, as shown in Fig. 2. Similar configurations are used in microcan combustors to obtain a combustible mixture at a short spatial scale. Jet flow rate ratios play a major role in controlling mixing 关18,19兴. The quench ring is constructed of two concentric stainless steel rings welded together. Each ring is machined to provide concentric rings of 1 mm holes through which steam and argon flow. The evaporated zinc gas and argon enter upstream and flow through a 4 mm diameter inlet at the center of the rings. Because of narrowing of the flow through the quench ring, the Zn共g兲 flow is expected to be well mixed as it enters the reaction zone. Steam mixed with Ar is fed to the inner ring from a 0.12 cm i.d. stainless steel tube on the downstream side of the assembly. Steam is generated by an electrical heater fed with deionized water. The flow rate of steam is 1.6 ml/min. The inlet port for the H2O / Ar feed tube is at x = 56 cm. Additional argon flows through the outer ring, again fed by a stainless steel tube on the downstream side of the assembly. The inlet port to the tube is at x = 59 cm. Gas and wall temperature distributions in the reactor are measured using Chromel-Alumel 共K-type兲 thermocouples. Flow rates are controlled and measured independently using mass flow meters. The mass flow meters are calibrated with a Gilibrator 2 calibration system 共Sensidyne Inc., Clearwater, FL兲 with an accuracy of ⫾1% of reading. The composition of the effluent gas is sampled using an inline gas chromatograph 共GC, Agilent 6890兲. Water vapor is removed prior to sampling with a condenser and molecular sieve. A nanoscale scanning mobility particle sizer 共SMPS兲 measures the size and number concentration of nanoparticles in the gas stream.
3
Method
3.1 Numerical Model. The objective of the numerical modeling is to understand how the operating conditions for the quench ring affect the flow and temperature fields in the reactor and the quench rate of the gaseous zinc. Table 1 lists the operating conditions of the three numerical and experimental cases. Note that all cases have a center flow rate of 0.75 l/min, and that the major
difference in the cases is the relative flow rates of the jets. Furthermore, note that cases 1 and 3 have a total gas flow rate of 7.87 l/min, while case 2 has a lower total gas flow rate of 5.01 l/min. The reactor is modeled from the upstream side of the quench ring at x = 27 cm to the exit of the reaction section at x = 65 cm. Three-dimensional, laminar incompressible models are applied to solve the governing conservation equations of mass, momentum, and energy using FLUENT® 关20兴 with the segregated solver. The laminar model captures jet entrainment but does not capture turbulent mixing. Particle synthesis is not modeled and the entire flow field is assumed to be Ar. The second order upwind scheme is used to handle convection-diffusion discretization and velocity and pressure are decoupled using the SIMPLE algorithm 关21兴. The solutions are considered converged when the monitored residuals of mass, velocity, and temperature are less than 10−4, 10−4, and 10−8, respectively. The model is parallelized by partitioning the domain and utilizing multiple nodes. A nonuniform and very fine grid is applied in the first 5 cm of the reactor. Grid independent solutions are obtained by dynamically adapting the grid every 200 iterations. Converged solutions are obtained with 600 iterations with a wall clock time of 24–72 h on a six-node Intel Xenon 2.33 GHz Linux platform. The model geometry construction and grid generation are carried out using GAMBIT. The computational domain is decomposed into 9 ⫻ 106 cells with a T-Grid 共Tet/Hybrid兲. The quench ring is located upstream of the reaction section. The upstream side of the quench ring is modeled as an isothermal surface at 843 K based on measured data. The flow of Ar at the inlet to the quench ring is 900 K. Jet impingement of the inlet flows is included in the model. The impinging flow creates a nonuniform flow among the individual outlet holes in the quench ring. The model predicts a nonuniformity from the average jet velocity of ⫾18% in the inner ring of jets and ⫾44% in the outer ring of jets. The reaction section is divided into two parts in order to specify the thermal boundary conditions. The reaction section immediately downstream of the quench ring 共28 cmⱕ x ⱕ 38 cm兲 corresponds to the section of the quartz tube that rests on the insulating
Table 1 Operating conditions for the three simulated cases Nominal inlet temperatures 共K兲 Case No.
Zn共g兲 / Ar 共l/min兲
H2O / Ara 共l/min兲
Ar 共l/min兲
Total gas 共l/min兲
Residence time 共s兲
Zn共g兲 / Ar 共at the quench ring兲
H2O / Ar 共feed tube inlet兲
Ar 共feed tube inlet兲
1 2 3
0.75 0.75 0.75
1.42 2.84 4.27
5.70 1.42 2.85
7.87 5.01 7.87
0.44 0.66 0.42
900
473b 457 427
298
a
Flow rate of Ar only. The water flow rate is 1.6 ml/min at NTP conditions. All simulations are carried out using this inlet condition.
b
Journal of Solar Energy Engineering
AUGUST 2009, Vol. 131 / 031018-3
Downloaded 07 Jan 2010 to 128.101.98.21. Redistribution subject to ASME license or copyright; see http://www.asme.org/terms/Terms_Use.cfm
mount in the furnace. Here the reactor surface is modeled as adiabatic. The reaction section 共38 cmⱕ x ⱕ 48 cm兲 is wrapped with an electrical tape heater. A uniform heat flux boundary condition is applied at the surface in this section of the reactor. The applied heat flux is 250 W / m2. The stainless steel tube 共48 cmⱕ x ⱕ 65 cm兲 is not insulated and thus a free convective/radiative boundary condition is applied. The emissivity of the stainless steel is assumed to be 0.2. All solid surfaces are no slip. Temperature dependent thermophysical properties are based on regression of tabulated data 关22兴. 3.2 Experimental Method. Before each experiment, the masses of the filter, the crucible, and the Zn pellets 共99% purity兲 are recorded. The nominal weight of Zn is 0.5 g. The experiments are initiated by purging the reactor with argon. The valves for the argon carrier gas 共ultrapure兲 and the separate Ar flow to the quench ring are opened and the tape heater is switched on. In all experiments, the furnace set point temperature is 1023 K, yielding a Zn共g兲 / Ar temperature of about 900 K at the inlet of the quench ring at x = 27 cm. The H2O / Zn molar ratio is 350. The zinc partial pressure is 9.4 mm Hg. When the average reaction section wall temperature reaches 573 K 共in approximately 45 min兲, the valve for the H2O / Ar mixture is opened and the furnace heating of zinc pellets is initiated. The furnace reaches 1023 K in about 10 min. The hydrogen concentration in the effluent stream is analyzed at 2 min intervals throughout the experiment. Each sample is obtained over 6 s. Hydrogen production rate is determined as H2,production = V˙H2 · H2
共3兲
where V˙H2 is the volumetric flow rate of hydrogen produced during the experiment and H2 is the molar density. The flow of gases is terminated when the hydrogen production is less than 0.2 ml/min. The percent conversion for each experiment is calculated according to H2,conversion =
V H2 Vth · mZn
⫻ 100
共4兲
where VH2 is the volume of hydrogen produced, Vth is the theoretical volume of hydrogen produced by the hydrolysis of 1 g of Zn, and mZn is the evaporated mass of Zn. The Zn loaded into the crucible is evaporated completely during each experiment. At the end of each experiment, flows to the quench ring are turned off with the exception of the carrier Ar, which continues to flow for 10 min. When the reactor is cooled to room temperature, the masses of the crucible, the filter, and any loose particles in the reactor are recorded. The deposits on the wall of each section of the reactor are removed with a soft brush and their mass is measured. The composition and the mean crystallite size of the material deposited on the quartz reactor surface and on the filter at the end of the reactor are analyzed by X-ray diffraction 共XRD, Bruker-AXS D5005 diffractometer with 2.2 kW sealed Cu source兲. The diffraction patterns of the Zn–ZnO composite materials contain peaks unique to the Zn and to the ZnO phases, which allows the crystallite size and composition of the material to be determined. Pattern analysis is completed using a whole pattern fitting method built into the JADE 8.0 software 共Materials Data Inc., Livermore, CA兲. The morphology and size of material deposited on the reactor walls and the filter are investigated using scanning electron microscopy 共Hitachi S-900 FEG-SEM兲. Finally, the size and concentration of aerosol are measured via SMPS for experiment 2. Centerline temperatures are measured in separate experiments without Zn nanoparticles. A 0.32 cm diameter K-type stainless steel thermocouple probe is positioned axially in the reactor using a metric ruler and positioned in the center of the reactor using two stainless steel spacers. A steel radiation shield is placed around the 031018-4 / Vol. 131, AUGUST 2009
Fig. 3 Velocity isocontours: „a… case 1, „b… case 2, and „c… case 3
probe tip. The centerline temperature at x = 28 cm is not measured to avoid probe contact with the quench ring. The first measurement downstream of the quench ring is taken at x = 29 cm. Wall temperatures are measured by placing K-type thermocouples in contact with the outer surface of the 2.0 cm quartz tube. The thermocouple beads are approximately 2 mm in diameter.
4
Results
4.1 Numerical. Contours of streamwise gas speed are shown in Fig. 3 in a horizontal plane at the midpoint of the tubular reactor. Data are shown from x = 27 cm to 32 cm. The feed tubes to the quench ring are not visible in this plane. The streamwise radial velocity profiles at x = 29, 30, 32, and 48 cm are plotted in Fig. 4. A comparison of case 1, which has the highest flow rate of Ar in the outer ring of the quench device, to cases 2 and 3 demonstrates a major difference in the flow fields. In case 1, the higher speed jets of Ar near the reactor wall entrain the flows nearer the center of the reactor and the entire flow field is directed radially outward toward the wall of the quartz reactor tube over a distance of 5 cm downstream of the quench ring. This flow field is expected to result in higher deposition of nucleated Zn particles. In cases 2 and 3, the center and outer jets are entrained by the middle jet yielding an annular region of higher flow approximately 3 mm from the reactor centerline. This flow pattern is expected to deTransactions of the ASME
Downloaded 07 Jan 2010 to 128.101.98.21. Redistribution subject to ASME license or copyright; see http://www.asme.org/terms/Terms_Use.cfm
Fig. 4 Velocity profiles at „a… x = 29 cm, „b… 30 cm, „c… 32 cm, and „d… 48 cm
crease particle deposition relative to case 1. The velocity profiles flatten at increasing axial distance from the quench ring 共Figs. 4共c兲 and 4共d兲兲 and the confined jets merge at x = 48 cm. Figures 5共a兲–5共c兲 show isotherms for the three cases in the same plane used to display the velocity data. In all cases, the argon carrier gas temperature decreases by 15 K within the quench ring because the quench ring is cooled by the internal impinging Ar flows. Just after the quench ring, the gas temperature decreases sharply and continues to decrease downstream more slowly. In case 1, the gas temperature drops approximately 147 K within 2 cm of the quench ring. In cases 2 and 3, the drop in temperature over the same distance is 61 K and 91 K. Jet entrainment plays an important role in the transport of the thermal energy of the carrier gas to the cooler outer jet flows. The apparent asymmetry in the velocity and temperature contours is due to the presence of the feed tubes for the outer co-axial jets. The feed tubes containment within the reactor partially diminishes the effectiveness of the quench ring. The model predicts a rise of nearly 380 K in the temperature of Ar as it flows from the inlet of the feed tubes to the quench ring. Deposition of nanoparticles on the cooler feed tubes is anticipated from these results and is observed in the experiments. 4.2 Experiment. The measured gas temperatures provide an assessment of the cooling rate achieved by use of the quench ring. Figures 6共a兲 and 6共b兲 show the axial centerline gas temperature distribution. Numerically predicted temperatures are included for comparison. The centerline temperature distribution measured from the crucible to the end of the reactor is shown in Fig. 6共a兲, and an expanded plot of the temperature distribution near the quench ring 共27 cmⱕ x ⱕ 30 cm兲 is shown in Fig. 6共b兲. The measurement uncertainty is primarily due to radiation heat transfer between the reactor walls or radiation shield 共depending on measurement position兲 and the thermocouple probe, and is estimated using the method described in Ref. 关23兴. The maximum uncertainty is ⫾8%, and for clarity is shown only on the data points for experiment 3 in Figs. 6共a兲 and 6共b兲. As can be seen in Figs. 6共a兲 and 6共b兲, the predicted gas temperatures are higher than measured values. Near the quench ring Journal of Solar Energy Engineering
at x = 29 cm, the model overpredicts the gas temperature by 75 K. Further downstream between x = 32 and 50 cm, the model overpredicts the gas temperature by as much as 100 K. We attribute the difference between predicted and measured temperature primarily to the assumption of an adiabatic wall in the section from x = 28– 38 cm and to the inability of the laminar flow model to capture turbulent mixing. Despite the quantitative differences in the predicted and measured temperatures, the values agree in a relative sense. At x = 29 cm, the highest predicted and measured temperatures are for case 2 and the lowest temperatures are for case 1. As best illustrated in Fig. 6共b兲, the quench ring reduces the carrier gas temperature from about 900 K at the inlet of the quencher to 705 K, 764 K, and 737 K at x = 29 cm for experiments 1, 2, and 3, respectively. These temperatures are below the zinc saturation temperatures of 741 K, 768 K, and 742 K for the three cases. Particle synthesis is possible within 1 cm of the quench ring as proven from observation of particle deposition patterns. Zinc saturation temperature is calculated from Ref. 关24兴: log PZn,S = − 20.31 −
4636.2 + 10.07 log Tsat − 0.0038 Tsat + 4.89 Tsat 共5兲
⫻ 10−7 Tsat2
The saturation pressure PZn,S is determined from the mole fraction of the zinc using the evaporated mass of zinc and the measured mass flow rates of argon and steam. Experimental quench rates cannot be accurately estimated from the gas temperatures measured downstream of the quench ring because the first downstream measurement at x = 29 cm is below the saturation temperature of Zn. Quench rates predicted from the numerical data shown in Fig. 6共b兲 are estimated as ⌬T 共Tx=27 cm − Tsat兲 ¯ = Uxsat ⌬t 共xsat − x27兲
共6兲
¯ is the average velocity at x , the axial location where where U sat the temperature first reaches the zinc saturation temperature. The model predicts the gas cools to the Zn saturation temperature at AUGUST 2009, Vol. 131 / 031018-5
Downloaded 07 Jan 2010 to 128.101.98.21. Redistribution subject to ASME license or copyright; see http://www.asme.org/terms/Terms_Use.cfm
Fig. 5 Temperature isocontours: „a… case 1, „b… case 2, and „c… case 3
x = 37.0, 41.4, and 46.4 cm for cases 1, 2, and 3. The corresponding predicted quench rates are 1759 K/s, 728 K/s, and 873 K/s. Despite the rapid quench to temperatures below the zinc saturation temperature in the first few centimeters downstream of the quench ring, centerline gas temperatures are held between 630 K and 730 K in the reaction section from x = 30 cm to x = 48 cm because the reactor wall is heated between x = 38 and 48 cm. The measured and predicted wall temperatures are plotted in Fig. 6共c兲 along the reaction and collection sections. Measured surface temperature decreases from 854 K, 883 K, and 862 K at x = 28 cm to 590 K, 623 K, and 604 K at x = 38 cm for experiments 1, 2, and 3. The predicted wall temperatures are about 100 K higher at x = 38 cm. This difference is attributed to the modeling assumption of an adiabatic boundary along the insulated support. Measured wall temperatures rise in the section wrapped with an electrical tape heater. Predicted temperatures at 42 cm are 685 K, 706 K, and 692 K for experiments 1, 2, and 3. Predicted temperatures are within 60 K of the measured values. In the collection section 共48 cmⱕ x ⱕ 65 cm兲, the measured temperatures drop from about 600 at x = 48 cm to 330 K at x = 65 cm. The measured and predicted temperatures in this region are within 25 K of each other. The synthesis and hydrolysis of Zn nanoparticles are characterized from in situ particle measurements via nano-SMPS and XRD analysis of the particles collected on the filter and from the walls 031018-6 / Vol. 131, AUGUST 2009
Fig. 6 „a… Predicted and measured, „b… centerline gas, and „c… wall temperatures
of the reactor. Centerline aerosol concentration at x = 48 cm is 108 particles/ cm3 with a mean particle size of 16 nm. In all experiments, particles are present on the reactor surface. The particles are loose and are easily removed with a soft brush. The poor adhesion to the wall suggests particle deposition rather than vapor deposition. The color of the deposited particles and XRD measurements indicate the extent of their reaction. The particles vary in color from white and light gray 共ZnO兲 near the quench ring to black 共Zn兲 near the end of the reactor where temperatures are too low for hydrolysis. Figure 7 shows the XRD analysis of the composition of the material removed from the wall as a function of distance from the quench ring for each experiment. The measured wall temperatures are indicated on a second abscissa. The decreasing ZnO content along the length of the reactor is consistent with the color of the deposits and the decrease in wall and gas temperatures. There is a slight increase in the percentage of ZnO at x = 40 cm due to the increase in wall temperature at that position. Transactions of the ASME
Downloaded 07 Jan 2010 to 128.101.98.21. Redistribution subject to ASME license or copyright; see http://www.asme.org/terms/Terms_Use.cfm
Fig. 7 Composition of particles
The crystalline size of the particles removed from the reactor wall at 28 cmⱕ x ⱕ 48 cm is 33–55 nm for the ZnO and 38–68 nm for the Zn. The physical particle size is not represented by the crystalline size. Fewer particles are collected on the filter. Particles collected on
the filter represent 9%, 9%, and 12% of the evaporated zinc containing 22%, 24%, and 34% ZnO for experiments 1, 2, and 3, respectively. The crystalline size is 22–33 nm for the ZnO and 39–50 nm for the Zn. The fact that the crystalline size of ZnO is smaller than that of Zn is consistent with data of Ernst 关12兴 and Müller and Steinfeld 关25兴. Funke et al. 关15兴 also observed that the particles collected on the filter were only partially hydrolyzed while the particles deposited on the hot reactor wall were completely hydrolyzed. Figure 8 presents representative SEM images of the products collected from the filter 共共a兲 10k⫻ and 共b兲 60k⫻ magnification兲 and from the wall of the reactor at x = 30.5 cm 共共c兲 10k⫻ and 共d兲 30k⫻ magnification兲. A significant difference in the morphology and size of the products was not observed between the three experimental cases considered in the present study. On the filter, interwoven, and interconnected filamentary structures are observed. The filaments have diameters between 50 nm and 100 nm. This morphology and characteristic size have been observed in other Zn aerosol flow reactors 关9,10,12,14兴. Weiss et al. 关9兴 and Abu Hamed et al. 关10兴 observed filamentary particles on the walls of their reactor tube where temperatures dropped below the zinc saturation temperature. Ernst et al. 关12兴 found filamentary particles on the filter of their reactor. They attributed the formation of the filamentary particles to zinc vapor nucleating, condensing, and
Fig. 8 SEM images of products collected from the filter „„a… and „b…… and from the reactor wall at x = 30.5 cm „„c… and „d……
Journal of Solar Energy Engineering
AUGUST 2009, Vol. 131 / 031018-7
Downloaded 07 Jan 2010 to 128.101.98.21. Redistribution subject to ASME license or copyright; see http://www.asme.org/terms/Terms_Use.cfm
Fig. 9 Hydrogen production rate „mmol/min…
hydrolyzing upon exiting the hot reaction zone where the temperature dropped below the zinc saturation temperature. The residence time from the exit of the reaction zone to the filter was reported as small but not quantified. Melchior et al. 关14兴 only observed filamentary particles on their filter for short residence times 共⬃1.0 s from the location of their quench to their filter兲 when temperatures were below the zinc saturation temperature. In the experiments considered in this study, residence times from the quench ring to the filter were on the order of 0.5 s and reactor temperatures were below the zinc saturation temperature. Our observation of filamentary particles on the filter thus confirms observations made in other zinc aerosol flow reactors from the literature. The filamentary particles are formed when supersaturated zinc vapor nucleates, grows, and hydrolyzes for characteristic times on the order of 0.5–1.0 s. In stark contrast to the filter deposits, the wall deposits were large polycrystalline particles, as evidenced by the large grains on the surface of the particle shown in Figs. 8共c兲 and 8共d兲. These particles were deposited on the walls of the hot reaction zone where the temperature was ⬃850 K. This high temperature favors continued particle coalescence and hydrolysis. The latter is confirmed from the XRD analysis, which revealed that the particles are nearly 100 wt % ZnO 共Fig. 8兲. Particles of a similar size were observed in Ref. 关9兴, but their surface structure could not be discerned from the transmission electron microscopy images. Deposits collected from the wall were not discussed in Refs. 关12,14兴. Hydrogen production rates 共mmol/min兲 are plotted in Fig. 9. On this plot, t = 0 min represents the time when H2O / Ar is introduced to the reactor and the electric furnace is turned on. The furnace reaches 1023 K at t = 10 min. The first hydrogen is detected at t = 16 min. There is, however, not a direct correlation between the time that hydrogen is measured and events in the furnace due to a delay in the arrival of the sampled gas to the GC on the order of 5 min. The delay in the GC measurement is a result of our efforts to remove water from the effluent gas sample. Important aspects of the data in Fig. 9 are the overall production rate and the shape of the curves. The initial increase in the hydrogen production from t = 16 min to t = 36 min is attributed to an increase in evaporation rate as the evaporation section heats up. Ernst et al. 关13兴 and Melchior et al. 关14兴 found that the zinc evaporation rate requires nearly 12–15 min to reach steady state. Hydrogen production remains nearly constant from 36 min to 60 min. At this point, the Zn in the crucible has been evaporated. From t = 0 min to t = 60 min, the amounts of hydrogen produced are 65%, 71%, and 68% of the total for experiments 1, 2, and 3, respectively. The decrease in hydrogen production rate after 60 min is attributed to a reduced rate of hydrolysis as particles deposited on the wall continue to hydrolyze. Once a ZnO layer is formed, the hydrolysis reaction is limited by the diffusion of the reactants through the layer 关9兴. After 90 min, hydrogen production 031018-8 / Vol. 131, AUGUST 2009
continues to decrease but at a slower rate. This result is consistent with an increase in the diffusion time through a growing oxide layer and slower hydrolysis of the zinc in the cooler collection section. The total hydrogen conversions for experiments 1, 2, and 3 are 79%, 79%, and 61%, respectively. These values are lower than those obtained in prior experiments at temperatures above the Zn saturation temperature 关8–10,12兴. Above the saturation temperature, adsorbed zinc vapor and steam react heterogeneously on the hot walls of the reactor. In the present experiments, the Zn particles entrained in the gas and the particles deposited on the wall react with steam in the reaction section. A comparison of both particle deposition and hydrogen conversion in the three experiments elucidates the hydrolysis process. The lowest hydrogen conversion 共61%兲 is produced in experiment 3. This experiment yields the greatest mass of particles at the filter and in the collection section 共16.1% of the evaporated zinc兲 where temperatures are less than 600 K. Particles in the cooler collection section react slower than those deposited in the hotter reaction section. Hydrogen conversion in experiments 1 and 2 is 79%. In both of these experiments, more particles remain in the hotter reaction section than in experiment 3 since only 11% of the evaporated zinc is recovered from the collection section and on the filter. In experiment 1, the particles are forced toward the wall near the quench ring, as predicted by the model. In experiment 2, the total flow rate is lowest providing a longer gas residence time from the quench ring to the filter 共0.42 s as opposed to 0.23 s and 0.26 s for experiments 1 and 3兲. Thus for different reasons, particles remain in the hotter reactor section longer and react faster than in experiment 3. We attribute the higher ZnO composition measured for filter products in experiment 3, despite the shorter residence time in this experiment compared with experiment 2, to the high temperature measured at the filter location. Recent results suggest that deposited filter products continue to react on the filter if the filter temperature is at or higher than 465 K 关26兴. In experiment 3, the filter was the hottest, above 500 K. The presence of nonattached 共loose兲 particles and the relative ease with which particles are removed from the reactor wall precludes vapor deposition. Hydrolysis occurred primarily in the region near the quench ring where temperatures are above ⬃650 K and the mass of deposited particles is highest.
5
Conclusion
Hydrolysis of zinc nanoparticles as the second step in a solar thermochemical water splitting cycle has been studied in a tubular reactor. A key component of the reactor is a quencher that rapidly cools a mixture of Zn共g兲, argon, and steam with three co-axial and multi-inlet confined jets. In the quencher, the center jet is Zn共g兲 in an argon carrier gas, the surrounding jet is a H2O / Ar mixture, and the outer jet is argon. Three-dimensional modeling of the flow and temperature fields in the quench ring and the reactor show that the relative jet velocities control the structure of the flow field. The center jet of Zn共g兲 is rapidly entrained and quenched by the faster outer jets. When the Ar jet near the wall is fastest, the Zn particle laden flow in the core is forced radially outward toward the wall. Whereas when the middle H2O / Ar jet is fastest, the Zn particle laden flow remains in the center of the tubular reactor. The present experiments reveal competing effects of increasing quench rates. To achieve high quench rates and thus more and smaller nanoparticles, the flow of Ar/steam must be increased. An increase in coolant flow rate, however, reduces the residence time in the reaction section for particles that remain in the flow field. In-flight residence times longer than those in the present reactor 共on the order of 0.5 s兲 are required for full conversion of the Zn aerosol. The present study, as well as prior studies, demonstrates the difficulty of preventing nanoparticle deposition on the reactor surfaces. Continuous recovery of the nanoparticles has not yet been accomplished. On the other hand, deposition of particles on the wall of the reactor where temperatures are above about 650 K Transactions of the ASME
Downloaded 07 Jan 2010 to 128.101.98.21. Redistribution subject to ASME license or copyright; see http://www.asme.org/terms/Terms_Use.cfm
yields higher hydrogen conversions than does hydrolysis of gas borne zinc nanoparticles at the residence times studied to date.
关10兴
Acknowledgment The project is funded by the University of Minnesota Initiative for Renewable Energy and the Environment. The University of Minnesota Supercomputing Institute provided computational resources. Parts of this work were carried out in the Institute of Technology Characterization Facility, University of Minnesota, which receives partial support from NSF. We thank Professor Aldo Steinfeld at Swiss Federal Institute of Technology 共ETHZurich兲 for his collaboration and financial support of the MS thesis of Marc Brülhart.
References 关1兴 Steinfeld, A., 2002, “Solar Hydrogen Production Via a Two-Step WaterSplitting Thermochemical Cycle Based on Zn/ZnO Redox Reactions,” Int. J. Hydrogen Energy, 27, pp. 611–619. 关2兴 Steinfeld, A., 2005, “Solar Thermochemical Production of Hydrogen—A Review,” Sol. Energy, 78, pp. 603–615. 关3兴 Palumbo, R., Lédé, J., Boutin, O., Elorza Ricart, E., Steinfeld, A., Moeller, S., Weidenkaff, A., Fletcher, E. A., and Bielicki, J., 1998, “The Production of Zn From ZnO in a Single Step High Temperature Solar Decomposition Process,” Chem. Eng. Sci., 53, pp. 2503–2518. 关4兴 Haueter, P., Moeller, S., Palumbo, R., and Steinfeld, A., 1999, “The Production of Zinc by Thermal Dissociation of Zinc Oxide—Solar Chemical Reactor Design,” Sol. Energy, 67, pp. 161–167. 关5兴 Möller, S., and Palumbo, R., 2001, “The Development of a Solar Chemical Reactor for the Direct Thermal Dissociation of Zinc Oxide,” ASME J. Sol. Energy Eng., 123, pp. 83–90. 关6兴 Schunk, L. O., Haeberling, P., Wepf, S., Wuillemin, D., Meier, A., and Steinfeld, A., 2007, “A Rotary Receiver-Reactor for the Solar Thermal Dissociation of Zinc Oxide,” Proceedings of the ASME Energy Sustainability Conference, Long Beach, CA, Jun. 27–30, Paper No. 36078. 关7兴 Perkins, C., Lichty, P., and Weimer, A. W., 2007, “Determination of Aerosol Kinetics of Thermal ZnO Dissociation by Thermogravimetry,” Chem. Eng. Sci., 62, pp. 5952–5962. 关8兴 Wegner, K., Ly, H. C., Weiss, R. J., Pratsinis, S. E., and Steinfeld, A., 2006, “In Situ Formation and Hydrolysis of Zn Nanoparticles for H2 Production by the 2-Step ZnO/Zn Water-Splitting Thermochemical Cycle,” Int. J. Hydrogen Energy, 31, pp. 55–61. 关9兴 Weiss, R. J., Ly, H. C., Wegner, K., Pratsinis, S. E., and Steinfeld, A., 2005,
Journal of Solar Energy Engineering
关11兴 关12兴 关13兴 关14兴 关15兴 关16兴 关17兴 关18兴 关19兴 关20兴 关21兴 关22兴 关23兴 关24兴 关25兴 关26兴
“H2 Production by Zn Hydrolysis in a Hot-Wall Aerosol Reactor,” AIChE J., 51, pp. 1966–1970. Abu Hamed, T., Davidson, J. H., Stolzenburg, M., 2008, “Hydrogen Production Via Hydrolysis of Zn in a Hot Wall Flow Reactor,” J. Sol. Energy Eng., 130共4兲, p. 041010. Abu Hamed, T., Davidson, J. H., and Haltiwanger, J. F., 2007, “Hydrogen Production Via Hydrolysis of Zinc Nanoparticles,” Proceedings of the AICHE Annual Meeting, Salt Lake City, UT, Nov. 4–9. Ernst, F. O., 2007, “Cosynthesis of H2 and Nanocrystalline ZnO Particles by Zn Aerosol Formation and In-Situ Hydrolysis,” Ph.D. thesis, ETH-Zurich, Zurich, Switzerland. Ernst, F. O., Tricoli, A., Pratsinis, S. E., and Steinfeld, A., 2006, “Co-Synthesis of H2 and ZnO by In-Situ Zn Aerosol Formation and Hydrolysis,” AIChE J., 52共9兲, pp. 3297–3303. Melchior, T., Piatkowski, N., and Steinfeld, A., 2009, “H2 Production by Steam-Quenching of Zn Vapor in a Hot-Wall Aerosol Flow Reactor,” Chem. Eng. Sci., 64, pp. 1095–1101. Funke, H. H., Diaz, H., Liang, X., Carney, C. S., Weimer, A. W., and Li, P., 2008, “Hydrogen Generation by Hydrolysis of Zinc Powder Aerosol,” Int. J. Hydrogen Energy, 33共4兲, pp. 1127–1134. Ernst, F. O., Steinfeld, A., and Pratsinis, S., 2009, “Hydrolysis Rate of Submicron Zn Particles for Solar H2 Synthesis,” Int. J. Hydrogen Energy, 34, pp. 1166–1175. Panda, S., and Pratsinis, S. E., 1995, “Modeling the Synthesis of Aluminum Particles by Evaporation-Condensation in an Aerosol Flow Reactor,” Nanostruct. Mater., 5, pp. 755–767. Woodfield, P. L., 2003, “Numerical Study of Enhancement of Laminar Flow Mixing Using Multiple Confined Jets in a Micro-Can Combustor,” Int. J. Heat Mass Transfer, 46, pp. 2655–2663. Jahnke, S., Kornev, N., Tkatchenko, I., Hassel, E., and Leder, A., 2005, “Numerical Study of Influence of Different Parameters on Mixing in a Coaxial Jet Mixer Using LES,” Heat Mass Transfer, 41, pp. 471–481. 2005, FLUENT 6.2. User’s Guide, Lebanon, NH. Patankar, S. V., 1980, Numerical Heat Transfer and Fluid Flow, Hemisphere, New York. Rabinovich, V. A., 1988, Thermophysical Properties of Neon, Argon, Krypton, and Xenon, Hemisphere, New York. Figliola, R. S., and Beasley, D. E., 2006, Theory and Design for Mechanical Measurements, 4th ed., Wiley, New York. Yaws, C. L., 1999, Chemical Properties Handbook, McGraw-Hill, New York. Müller, R., and Steinfeld, A., 2008, “H2O-Splitting Thermochemical Cycle Based on ZnO/Zn-Redox: Quenching the Effluents From the ZnO Dissociation,” Chem. Eng. Sci., 63共1兲, pp. 217–227. Haltiwanger, J. F., Venstrom, L. J., and Davidson, J. H., 2009, “A Discussion of the Measurement of ZnO Conversion in Aerosol Reactors,” ASME Paper No. ES2009-90006.
AUGUST 2009, Vol. 131 / 031018-9
Downloaded 07 Jan 2010 to 128.101.98.21. Redistribution subject to ASME license or copyright; see http://www.asme.org/terms/Terms_Use.cfm