Feb 20, 2013 - Keywords: Visual attention, stereoscopy, 3DTV, center bias, eye-tracking, ... Nowadays, stereoscopic 3D content increases the sensation of ...
Author manuscript, published in "SPIE Electronic Imaging 2013, San franscisco : United States (2013)"
Study of Center-Bias in the Viewing of Stereoscopic Image and a Framework for Extending 2D Visual Attention Models to 3D Junle Wang, Matthieu Perreira Da Silva, Patrick Le Callet, Vincent Ricordel LUNAM Université, Université de Nantes, IRCCyN UMR CNRS 6597, Polytech Nantes, Rue Christian Pauc BP 50609 44306 Nantes Cedex 3
ABSTRACT Compared to the good performance that can be achieved by many 2D visual attention models, predicting salient regions of a 3D scene is still challenging. An e�cient way to achieve this can be to exploit existing models designed for 2D content. However, the visual con�icts caused by binocular disparity and changes of viewing behavior in 3D viewing need to be dealt with. To cope with these, the present paper proposes a simple framework for extending
hal-00790559, version 1 - 20 Feb 2013
2D attention models for 3D images, as well as evaluates center-bias in 3D-viewing condition. To validate the results, a database is created, which contains eye-movements of 35 subjects recorded during free viewing of eighteen 3D images and their corresponding 2D version. Fixation density maps indicate a weaker center-bias in the viewing of 3D images. Moreover, objective metric results demonstrate the e�ciency of the proposed model and a large added value of center-bias when it is taken into account in computational modeling of 3D visual attention.
Keywords:
Visual attention, stereoscopy, 3DTV, center bias, eye-tracking, gaze pattern
1. INTRODUCTION The human visual system (HVS), receives a considerably large amount of information beyond its capability to process all of it.
To cope with large amounts of information, visual attention is one of the most important
mechanisms deployed in the HVS to reduce the complexity of scene analysis.
1 Inspired by the HVS, numerous
computational models of visual attention have been investigated during the last decades to predict salient areas . Nowadays, stereoscopic 3D content increases the sensation of presence through the enhancement of depth perception.
For simplicity of notation, from now on, we will use the term 3D to refer to stereoscopic 3D in
the remainder of this article. Compared to the body of studies with regards to visual attention in 2D viewing condition, a relatively small number of studies and computational models of 3D visual attention can be found in the literature. Nevertheless, studies related to 3D visual attention have been recently gaining an increasing amount of attention because of the emergence of 3D content (in cinemas and at home) and the recent availability of high-de�nition 3D-capable acquisition and display equipment. visual attention models are also emerging,
Several new candidate applications of 3D
2 such as: 3D video capture, 2D to 3D conversion, reframing and
depth adaptation, subtitling 3D movie. The enhancement of depth perception is one of the most signi�cant changes that viewers can feel during watching 3D image/video. However, the additional depth information makes predicting salient areas in a 3D
3, 4 have shown that watching the 3D version of a scene
scene become a challenging task. Psychophysical studies
can make the viewer's attention distribute di�erently as compared to watching the 2D version of the same scene. Fortunately, it has been demonstrated that 3D visual attention is still guided by many 2D visual features.
5 This
consistence of the in�uence of 2D low-level features implies the possibility of adapting existing 2D models to 3D cases. This is also the reason why most of the existing computational models of 3D visual attention share a same step in which salient regions are �rst detected based on 2D visual features.
6�9
In addition to the salient regions that result from 2D visual features, �xation patterns from eye-tracking experiments have also demonstrated a bias towards the screen center. This phenomenon is named as �centerbias� (or �central �xation bias�). The causes of this center-bias e�ect include the photographer bias, the viewing
strategy, the orbital reserve, the motor-bias, and the center of screen bias.
10 Studies11�13 have indicated that
the prediction of salient region can be largely improved by integrating the center-bias e�ect. However, center-bias is not taken into account in most of the existing 3D visual attention models. There still exist several di�culties of applying center-bias in 3D visual attention models: (1) The in�uence of center-bias in 3D viewing has not been con�rmed. Several studies
3, 4, 14 draw inconsistent
conclusions about how the spatial extent of exploration varies from 2D viewing to 3D viewing. This variation of extent implies the di�erent degrees of center-bias in the two viewing conditions. (2) The ways of integrating center-bias may not be consistent. integrate center-bias in the same way: in models
Not all 3D visual attention models can
9 taking both views as input, center-bias can be added on both
7 taking one image and a depth map as input, center-bias has to be added as a post-processing
views; in models
step after the output of saliency map. (3) Ground-truth data is still lacking. So far, there are few databases providing eye-tracking results for both the 2D and 3D versions of the same set of images. The lack of ground truth data limits the study of center-bias in 3D condition. In this paper, we propose a simple framework of 3D visual attention which can easily take advantage of
hal-00790559, version 1 - 20 Feb 2013
center-bias and existing 2D models. The degree of center-bias during 3D natural content images viewing is also quantitatively evaluated. Our results indicate a clear di�erence between the center-bias in 2D and 3D viewing conditions. By applying a proper degree of center-bias in the proposed framework, a signi�cant added value is demonstrated in the prediction of saliency maps for 3D images. A new database containing (both the 2D and 3D versions of ) natural content images and their corresponding binocular eye-tracking data is also introduced in this paper.
2. A FRAMEWORK OF 3D VISUAL ATTENTION The proposed framework is inspired by the attentional framework for stereo vision proposed by Bruce and
9 which is selected on the basis of its biological plausibility. Due to the complexity of Bruce's framework,
Tsotsos,
a simpli�cation was made in our study by keeping only layer 1 (to detect salient areas using 2D visual features) and layer 2 (to shift attention according to various binocular disparities). In the proposed framework, the left-view image and the right-view image are taken separately as inputs. Firstly, a 2D visual attention model is applied independently on the two images, and creates a corresponding 2D saliency map for each view. Secondly, the left and right 2D saliency maps go through an attention shifting step in which two saliency maps are merged according to the local disparity information. It is worth noting that, in this framework, center-bias can be either added in both paths to weight the two 2D saliency maps before the attention shifting step (Figure 1.a); or be added after the attention shifting step to weight the fused saliency map (Figure 1.b). The details of these step are introduced as follows.
2.1 2D saliency computation Since developing a completely new computational model of 2D visual attention is not in the scope of this paper, we leave the work of 2D visual features detection and 2D saliency map creation to existing models. In this study, three state-of-the-art models using di�erent mechanisms have been tried: (1) Bruce's AIM model
15 which is based on information maximization.
16 which is the most widely used one in the literature. This model is based on three low-level
(2) Itti's model
features, including intensity, color and orientation. (3) Hou's model
17 based on the computation of spectral residual.
To evaluate the performance of the proposed 3D visual attention framework, each of these three models is applied to perform 2D saliency prediction.
Left imge
Right image
Left imge
Right image
2D saliency computation
2D saliency computation
2D saliency computation
2D saliency computation
Center-bias weighting
Center-bias weighting
2D saliency map (left)
2D saliency map (right)
Attention shifting 2D saliency map (left)
2D saliency map (right) Center-bias weighting
hal-00790559, version 1 - 20 Feb 2013
Attention shifting
Predicted saliency map
Predicted saliency map
(a)
(b)
Figure 1: Overview diagrams of the proposed model with two ways of integrating center-bias.
(a) Two inde-
pendent center-bias models are added in the left and right paths to weight the two 2D saliency maps. (b) One center-bias model is added after the two 2D saliency maps have been merged.
2.2 Center-bias modeling So far, there is still not a strong agreement on the ways of modeling the center-bias. In the literature, center-bias was usually modeled by using either an isotropic Gaussian kernel
et
11 or an anisotropic Gaussian kernel.18 Tseng
al.10 demonstrated that the image borders have a large impact on center-bias. It implies that the shape (i.e.
the length to width ratio) of the images should be also taken into account when designing the Gaussian kernel.
18 to model the center-bias. This kernel is used
Consequently, in our study, we use an anisotropic Gaussian kernel
for weighting the saliency map. The weighted saliency map, named
S0,
is then given by:
(x − x0 )2 (y − y0 )2 − S (x, y) = S(x, y)exp − 2σx2 2σy2 �
0
where
(x0, y0 )
represent the image's center coordinates.
σx
and
x-axis and the y-axis, respectively. The relationship between
σy denote σx and σy
�
the standard deviation related to the is quanti�ed according to the size of
image viewed:
� σy = σx × where
Rx
deviations
and
σx
Ry
and
� Ry Rx Ind(Rx < Ry ) + Ind(Rx > Ry ) Ry Rx
Ind() is the indicatric function. Note that the standard σy , representing the degree of center-bias are measured in visual degree, since the measurement
are the image's width and height, and
of visual degree takes into account the viewing distance.
2.3 Attention shifting Due to the disparity between the left view and the right view, an area in a scene can thus correspond to two slightly di�erent locations in the retinal images of two eyes.
Moreover, since con�icts may exist between the
two eyes due to occlusions in binocular viewing, the saliency maps of the left view and the right view may not necessarily be the same at all the locations. Consequently, the two saliency maps that come from the two eyes need to be merged by shifting each pixel's saliency value from one view to the other.
hal-00790559, version 1 - 20 Feb 2013
Figure 2: The eighteen images used in eye-tracking experiment.
The distance of shifting is processed according to the local disparity between the two views.
Due to the
symmetry of binocular disparity, a saliency map from either of the two views can be shifted to �t the other one. We thus arbitrarily shift the saliency map of the right view, and then combine it with the saliency map of left view. The resulting saliency map
S”
is obtained by Equation 1:
S”(i, j) = SL (i, j) + SR (i + Dx (i, j), j + Dy (i, j)) where
(i, j)
represents the coordinate of each pixel in the image;
denotes the right-view saliency map;
Dx
and
Dy
SL
denotes the left-view saliency map;
(1)
SR
denote the horizontal and vertical disparity at each pixel.
3. EXPERIMENT In this section, we introduce an eye-tracking experiment which created a database providing the �xation density maps of both the 2D and 3D versions of a set of natural content images.
3.1 Stimuli 6, 19 were collected (see Figure 2). Ten of the images and their disparity 20 They have a resolution about 1300*1100 pixels. The maps come from the Middlebury 2005/2006 image set. Eighteen stereoscopic pairs of images
other eight pictures were taken in the campus of the University of Nantes using a Panasonic AG-3DA1 twin-lens 3D camera.
These images have a resolution of 1920*1080 pixels.
depth estimation algorithm using optical �ow.
Their disparity maps were generated by a
21, 22 Both the 3D version (containing a left view image and a
right view image) and the 2D version (containing two copies of the left view image) of these images were used in this binocular eye-tracking experiment.
hal-00790559, version 1 - 20 Feb 2013
Figure 3: Examples of �xation distribution: (a) Original image; and �xation density maps from the viewing in (b) 2D condition, (c) 3D condition.
3.2 Apparatus and procedures Stimuli were displayed on a 26-inch Panasonic BT-3DL2550 3D LCD screen, which has a resolution of 1920 * 1200 pixels and a refresh rate of 60 Hz. The maximum luminance of the display was 180 cd/m2, which yielded a maximum luminance of about 60 cd/m2 when watched through glasses. A SMI RED 500Hz remote eye-tracker was used to record the eye movements. Subjects watched the screen at a viewing distance of 97 cm through a pair of passive polarized glasses. The screen subtended 33 degrees * 19 degrees of visual angle at this viewing distance. do a free-viewing task.
Each image was presented for 15 seconds.
Subjects were required to
Between every two scenes, a center point
was showed for 500 ms at the screen center with zero disparity. A nine-point calibration was performed at the beginning of the experiment, and repeated every �ve scenes. To deal with the problem of visual fatigue, each subject was required to have at least three rests during the whole observation.
3.3 Participants Thirty-�ve subjects participated in the experiment, including 25 right-eye dominant subjects and 10 left-eye dominant subjects. The mean age of subjects was 24.2 years old. All subjects had either normal or corrected-tonormal visual acuity (checked by the Monoyer chart), color vision (checked by the Ishihara test) and 3D acuity (checked by the Randot stereo test).
3.4 Post-processing of eye-tracking data Two �xation maps were �rstly created separately for both eyes. were shifted for the same reason introduced in section 2.3.
Note that the �xations from the right eye
Secondly, the �xation maps were �ltered using a
two-dimensional Gaussian kernel to account for the decrease in visual accuracy with increasing eccentricity from the fovea. The standard deviation of the Gaussian kernel used for creating of �xation density maps was equal to 2 degrees of visual angle.
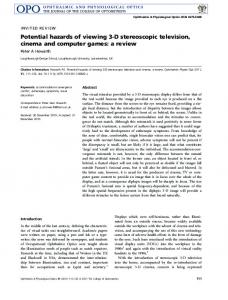
Figure 4: The left (resp.
right) �gure is obtained from subjects who are left-eye (resp.
right-eye) dominant.
Solid lines represent the degree of center-bias of right eye's data. Dash lines represent the degree of center-bias of left eye's data. Blue color and red color are, respectively, assigned to the lines and the areas between them in
hal-00790559, version 1 - 20 Feb 2013
order to distinguish the 2D and 3D viewing conditions.
4. RESULTS AND ANALYSIS 4.1 Center-bias in 2D viewing and 3D viewing Figure 3 shows some examples of the �xation density maps generated from our eye-tracking experiment. They were obtained during the viewing of the 2D version and the 3D version of the same set of images. From these �xation density maps, clear di�erence of �xation distribution can be observed. The �xations are more widely distributed in the 3D images than in the 2D images. To quantitatively examine the degree of center-bias in 2D viewing and 3D viewing, we apply a similar method
18 A set of center-bias maps are �rstly created by using only the center-bias model introduced
as the one used in.
in section 2.2 with a standard deviation
σx
ranging from 0 degree to 10 degree. Each of these center-bias maps is
compared with the left and right �xation density maps of each image (both 2D and 3D version) by the Pearson Linear Correlation Coe�cient (PLCC). These PLCC values are then averaged over observers.
The averaged
PLCC evolution is plotted in Figure 4. In Figure 4, the value of PLCC represents the similarity between the real �xation distribution and a 2D Gaussian distribution; the value of standard deviation represents how much the Gaussian distribution is concentrated to the center. Therefore, a smaller standard deviation and a higher PLCC value mean that the distribution of �xations is more concentrated at the center, and thus correspond to a higher degree of center-bias. From the two colors in Figure 4, one can clearly observe a higher degree of center-bias (of both eyes) in 2D viewing than in 3D viewing.
This �nding holds for (1) both the left eye and the right eye, and (2) for both
the left-eye dominant viewers and the right-eye dominant viewers. This result is consistent with the result from Hakkinen
et al.3 and Jansen et al.5
It is worth to note that, regarding the development of computational models,
a lower degree of center-bias in 3D viewing means that the Gaussian kernel applied in the 3D visual attention model should have a larger standard deviation. The observers involved in our experiment have di�erent dominant eyes.
Nevertheless, we �nd out that
the relative di�erence between 2D viewing and 3D viewing for these two groups of observers are similar. For simplicity, we merge the data from these two groups of observers in the following analysis.
4.2 Integration of the center-bias Curves in Figure 4 show di�erences of center-bias between left eye and right eye. These di�erences imply the plausibility of modeling the center-bias by two di�erent Gaussian kernels for the saliency maps from both views. Several objective metrics have been applied to assess the performance of such a strategy. However, the results shows only marginal e�ects on the accuracy of the �nal maps by applying Gaussian kernels with di�erent sizes,
as compared to either (1) applying two identical Gaussian kernels, or (2) applying a Gaussian kernel after the fusion of two views. The reason of this similarity among di�erent ways of applying center-bias could be due to the absence of occlusion areas and areas with extreme disparities in the images of our database. In the following quantitative analysis, only the way of adding center-bias after the fusion of two views (as shown in Figure 1.b) is used for the performance assessment.
4.3 Performance of the proposed framework and added value of center-bias in 3D visual attention models Table 1 gives the performance of the proposed 3D framework. Each of the three 2D models is combined with various levels of center-bias to predict the saliency maps of 3D images. Three degrees of center-bias are tested:
•
Zero center-bias. In this case, no center-bias is considered. The saliency map is uniformly weighted.
•
The 2D optimal value
σ2D = 4.1
degrees. This value of standard deviation results from a training based
on the �xation patterns obtained in 2D viewing condition.
This smaller value corresponds to a more
hal-00790559, version 1 - 20 Feb 2013
concentrated distribution of �xations. Equally, it means a higher degree of center-bias.
•
The 3D optimal value
σ3D = 4.9
degrees. This value of standard deviation results from a training based
on the �xation patterns obtained in 3D viewing condition.
This larger value indicates a wider spread
distribution of �xations and a lower degree of center-bias. Note that the performance of each 2D model in predicting saliency maps of 2D version images is also presented in Table 1 as a reference. Three widely used objective similarity metrics are used in the performance assessment: (1) Pearson linear correlation coe�cients (PLCC); (2) Kullback-Leibler divergence (KLD); (3) Area under the ROC curves. The results demonstrate that the performance of the proposed 3D visual attention model largely depends on the 2D saliency model adopted no matter whether center-bias is added.
When no center-bias is taken into account,
the proposed model generally has a comparable performance as the performance of the corresponding 2D model on 2D images. When the center-bias is considered, all these three metrics indicate great improvements of the performance of all the three 2D saliency models. Moreover, the results show the impact of the parameter
σ
on
the contribution of the center-bias. The proposed model has a better performance when using the parameter
σ
particularly tuned for 3D condition. Those parameters previously used for 2D condition do not perform optimally for 3D content.
5. CONCLUSION AND PERSPECTIVE Psychophysical studies about center-bias and a 3D visual attention framework are presented in this paper. The proposed framework can exploit existing 2D attention models, and has a good performance in predicting saliency maps of 3D still images. Our work also demonstrates that center-bias in 3D viewing condition is slightly weaker than in 2D viewing condition.
Nevertheless, integrating the proper degree of center-bias can still make large
added value to the proposed framework. Moreover, if we take into account the depth value of each �xation, we �nd that the �xations are not only biased towards screen center but also towards to the objects closer to the observers. This phenomenon implies another bias, which was given the name of �depth-bias� in.
23 Our future works will focus on combining both the
depth bias and the center bias for developing a 3D attention model.
6. ACKNOWLEDGMENTS This work is supported by the French ANR-PERSEE project (project reference: no ANR-09-BLAN-0170).
2D saliency model
Image
Degree of CB
PLCC
KLD
AUC
2D
No center-bias
0.2853
0.8135
0.6423
No center-bias
0.3423
0.5159
0.6397
σ2D σ3D
0.6717
0.4675
0.7358
0.6913
0.3532
0.7377
No center-bias
0.1370
2.8072
0.5480
No center-bias
0.1568
2.3740
0.5483
σ2D σ3D
0.2147
2.4450
0.5514
0.2165
2.3438
0.5516
No center-bias
0.2628
0.8576
0.6386
No center-bias
0.3003
0.5805
0.6273
σ2D σ3D
0.6120
0.5738
0.7326
0.6232
0.4543
0.7323
Bruce's model
3D 2D
Itti's model
3D 2D
Hou's model
3D
Table 1: Performance of the proposed model on 3D images with di�erent 2D saliency models and di�erent degrees of center-bias (noted as CB in the table).
σ2D = 4.1
degrees and
σ3D = 4.9
degrees. The performance of these
hal-00790559, version 1 - 20 Feb 2013
2D attention models on 2D images is also presented. Note that a smaller KLD score means a better performance.
REFERENCES [1] Wolfe, J., �Visual attention,�
Seeing 2,
335�386 (2000).
[2] Huynh-Thu, Q., Barkowsky, M., Le Callet, P., et al., �The importance of visual attention in improving the 3d-tv viewing experience: Overview and new perspectives,�
IEEE Transactions on Broadcasting 57(2),
421�431 (2011). [3] Hakkinen, J., Kawai, T., Takatalo, J., Mitsuya, R., and Nyman, G., �What do people look at when they watch stereoscopic movies?,�
7524,
75240E, SPIE (2010).
[4] Ramasamy, C., House, D., Duchowski, A., and Daugherty, B., �Using eye tracking to analyze stereoscopic �lmmaking,� in [SIGGRAPH'09:
Posters ],
28, ACM (2009).
[5] Jansen, L., Onat, S., and König, P., �In�uence of disparity on �xation and saccades in free viewing of natural scenes,�
Journal of Vision 9(1)
(2009).
[6] Wang, J., Perreira Da Silva, M., Le Callet, P., and Ricordel, V., �A computational model of stereoscopic 3d visual saliency,�
IEEE Transactions on Image Processing
(to appear).
[7] Zhang, Y., Jiang, G., Yu, M., and Chen, K., �Stereoscopic visual attention model for 3d video,�
in Multimedia Modeling
Advances
, 314�324 (2010).
[8] Chamaret, C., Gode�roy, S., Lopez, P., and Le Meur, O., �Adaptive 3d rendering based on region-of-interest,� in [Proceedings
of SPIE ], 7524,
75240V (2010).
[9] Bruce, N. and Tsotsos, J., �An attentional framework for stereo vision,� in [Computer
2005. Proceedings. The 2nd Canadian Conference on ],
and Robot Vision,
88�95, IEEE (2005).
[10] Tseng, P., Carmi, R., Cameron, I., Munoz, D., and Itti, L., �Quantifying center bias of observers in free viewing of dynamic natural scenes,�
Journal of Vision 9(7)
(2009).
[11] Zhao, Q. and Koch, C., �Learning a saliency map using �xated locations in natural scenes,�
Vision 11(3)
Journal of
(2011).
[12] Ma, Y., Lu, L., Zhang, H., and Li, M., �A user attention model for video summarization,� in [Proceedings
of the tenth ACM international conference on Multimedia ],
533�542, ACM (2002).
[13] Luo, Y., Yuan, J., Xue, P., and Tian, Q., �Saliency density maximization for object detection and localization,�
Computer Vision�ACCV 2010
, 396�408 (2011).
[14] Wang, J., Le Callet, P., Ricordel, V., and Tourancheau, S., �Quantifying depth bias in free viewing of still stereoscopic synthetic stimuli,�
16th European Conference on Eye Movements, Marseille, France
[15] Bruce, N. and Tsotsos, J., �Saliency, attention, and visual search:
Journal of Vision 9(3)
(2011).
An information theoretic approach,�
(2009).
[16] Itti, L., Koch, C., and Niebur, E., �A model of saliency-based visual attention for rapid scene analysis,�
Pattern Analysis and Machine Intelligence, IEEE Transactions on 20(11),
1254�1259 (1998).
[17] Hou, X. and Zhang, L., �Saliency detection: A spectral residual approach,� in [Computer
Recognition, 2007. CVPR'07. IEEE Conference on ],
Vision and Pattern
1�8, Ieee (2007).
[18] Le Meur, O., Le Callet, P., Barba, D., and Thoreau, D., �A coherent computational approach to model bottom-up visual attention,�
Pattern Analysis and Machine Intelligence, IEEE Transactions on 28(5), 802�
817 (2006). [19] Wang, J., Perreira Da Silva, M., Le Callet, P., and Ricordel, V., � IRCCyN/IVC 3DGaze database.� http://www.irccyn.ec-nantes.fr/spip.php?article1102&lang=en (2011). [20] Scharstein, D. and Pal, C., �Learning conditional random �elds for stereo,� in [Computer
Recognition, 2007. CVPR'07. IEEE Conference on ],
Vision and Pattern
1�8, IEEE (2007).
[21] Werlberger, M., Trobin, W., Pock, T., Wedel, A., Cremers, D., and Bischof, H., �Anisotropic huber-l1 optical �ow,� in [Proceedings
of the British machine vision conference ],
(2009).
[22] Werlberger, M., Pock, T., and Bischof, H., �Motion estimation with non-local total variation regularization,� in [Computer
Vision and Pattern Recognition (CVPR), 2010 IEEE Conference on ], 2464�2471, IEEE (2010).
[23] Wang, J., Le Callet, P., Ricordel, V., Tourancheau, S., and Perreira Da Silva, M., �Study of depth bias of observers in free viewing of still stereoscopic synthetic stimuli,�
hal-00790559, version 1 - 20 Feb 2013
1�11 (2012).
Journal of Eye Movement Research 5(5):1,