IEEE TRANSACTIONS ON COMPONENTS, PACKAGING AND MANUFACTURING TECHNOLOGY, VOL. 2, NO. 8, AUGUST 2012
1335
Study on the Fluid–Structure Interaction of Flexible Printed Circuit Board Electronics in the Flow Environment Wei Chiat Leong, Mohd Zulkifly Abdullah, Chu Yee Khor, and Ernest Ern Seang Ong
Abstract— Flexible printed circuit board (FPCB) can be an alternative to the rigid printed circuit board (PCB) because of its excellent flexibility, twistability, reduced thickness, and light weight. In a flow environment, although the deflection and stress induced are often ignored by PCBs, these are key factors that affect the reliability of FPCBs. Thus, this paper aims to examine the effect of flow velocity, component thickness, types of component arrangement, misalignment, and inclination on a typical FPCB electronics under flow condition. These factors are found to significantly affect the deflection and stress levels of FPCBs. On the basis of the results, a few design strategies are suggested to FPCB designers to develop more reliable products. In this paper, a fluid–structure interaction (FSI) study was performed using the fluid solver FLUENT and the structural solver ABAQUS, coupled online by the mesh-based parallel code coupling interface. A simple experiment was also performed to validate the FSI numerical technique used. The research findings in this paper are believed to be valuable and important to the FPCB industries. Index Terms— Deflection, flexible printed circuit board (FPCB), fluid–structure interaction (FSI), force, stress.
I. I NTRODUCTION
F
LEXIBLE printed circuit board (FPCB) can be an alternative to the rigid printed circuit board (PCB). FPCB is advantageous in some applications because of its excellent flexibility, twistability, reduced thickness, and lightweight features. The deflection and stress induced by FPCBs in different flow environments are far more prominent and critical compared to the traditional rigid PCBs. Thus, although the deflection and stress issues are often ignored by PCBs under flow condition, these are key factors that affect the reliability of FPCBs and many researchers have focused on this area. A review of previous works, which builds a background for this paper, is presented as follows. Azar and Russell [1] experimentally studied the effect of component layout and geometry on flow distribution in a circuit pack. Lee and Mahalingam [2] used a computational
Manuscript received November 20, 2011; revised May 12, 2012; accepted May 13, 2012. Date of publication July 10, 2012; date of current version July 31, 2012. This work was supported in part by the Universiti Sains Malaysia under the USM Fellowship Scheme. Recommended for publication by Associate Editor H.-C. Cheng upon evaluation of reviewers’ comments. The authors are with the School of Mechanical Engineering, Universiti Sains Malaysia, Nibong Tebal 14300, Malaysia (e-mail:
[email protected];
[email protected]; cykhor_1985@hotmail. com;
[email protected]). Color versions of one or more of the figures in this paper are available online at http://ieeexplore.ieee.org. Digital Object Identifier 10.1109/TCPMT.2012.2201939
fluid dynamics (CFD) tool to determine the velocity and temperature fields of airflow in a computer system enclosure. Dealing with component-PCB heat transfer, Rodgers et al. [3]–[5] performed numerical and experimental works to assess the predictive accuracy of CFD tools for the thermal analysis of electronic systems. They also characterized in detail the airflow patterns around PCB-mounted electronic components [6]. A numerical solution of laminar forced convection in an air-cooled PCB assembly was developed by Leung et al. [7], whereas Shankaran et al. [8] proposed a multilevel approach with exact boundary condition import for accurate and time-efficient CFD design calculations. Baelmans et al. reported on the modeling of forced convection cooling [9]. In addition, Cole et al. [10] analyzed the aerodynamic and thermal interactions of ball grid array (BGA) packages in an actual environment. Interestingly, Grimes et al. conducted extensive experiments and modeling of the flow and heat transfer in axial flow fan-cooled electronic systems [11]–[14]. They found that the flow in the fan-sucking mode was steady, uniform, and easily predictable using a laminar model, whereas in the fan-blowing mode, it was unsteady, swirling, and too complex to be even predicted with reasonable accuracy using a turbulent model. Besides, Yilmaz and Gundogdu [15] used FLUENT to predict the experimental velocity field in the laminar pulsatile pipe flow. The flow around the square prism was also experimentally studied by Akansu et al. [16]. In rigid PCBs, Leicht and Skipor [17], [18] developed a test method to clarify the mechanical bending fatigue issues in packages attached to PCBs. A global/local modeling of PCB mechanical loading was proposed by Zhu et al. [19]. Using the finite element method (FEM) model, Shetty et al. [20] and Shetty and Reinikainen [21] investigated the durability of chip scale package interconnects when assembled on FR4 substrates. Lau et al. [22] studied plastic ball grid array package assemblies under a three-point bending condition. In addition, Yu et al. [23] analyzed the full-field dynamic responses of PCBs at the product level using the digital image correlation technique. Arruda et al. [24], [25] studied a flex–rigid PCB (RFPCB) interface to evaluate the cracking phenomena during thermal cycling through FEM analysis. Sun et al. [26] also found that there are some risk places for potential failures, such as the corners of the connecting parts of the RFPCBs. Das et al. [27] were able
2156–3950/$31.00 © 2012 IEEE
1336
IEEE TRANSACTIONS ON COMPONENTS, PACKAGING AND MANUFACTURING TECHNOLOGY, VOL. 2, NO. 8, AUGUST 2012
160 140
Stress (MPa)
120 100 80 60 40 20 0 0.00
(a) 0.05
0.10
0.15
0.20
0.25
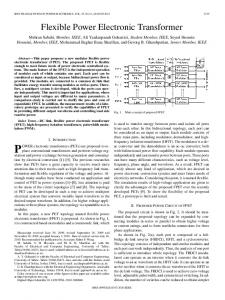
Strain Fig. 1.
Stress–strain relationship for FPCB material.
(b)
Fig. 2.
Fig. 3.
(a) Schematic diagram. (b) Experimental setup.
Fig. 4.
Modeling of FPCB test vehicle.
FPCB test vehicle.
to fabricate a biocompatible FPCB on a polydimethylsiloxane substrate. Few researchers have focused on the material and structural characteristics of FPCB. Li and Jiao [28] studied the effects of temperature and aging on the Young’s moduli of polymeric-based flexible substrates (e.g., polyethylene naphthalate, polyester, and polyimide) using the dynamic mechanics analyzer. Experimentally, Martynenko et al. [29] further assessed the fatigue resistance and reliability of polyimide-based FPCBs. They discovered a novel experimental setup to test on the FPCBs and noted that the fatigue life of the FPCBs was not shortened at elevated temperatures. Barlow et al. [30] successfully demonstrated the feasibility and viability of FPCBs on integrated power modules for miniaturization purposes, and found that the FPCB could efficiently adapt to demanding size without significantly increasing the cost. Combined with optimization analysis, Ptchelintsev [31] developed an automated procedure for the fatigue life assessment of FPCBs using FEM. Still on FPCBs, van Driel et al. [32] predicted reliability issues for the packages in the flexible end-products and explored that the mechanical loadings were responsible for causing crack failures in dies and packages. Han et al. experimentally studied the fatigue behavior of thin copper
foils for FPCB application [33]. To consider fluid–structure interaction (FSI), Arruda and Freitas [34] proposed a multiphysics simulation model to describe the interaction between FPCB and its surrounding air. Huang et al. [35], [36] also created a simulation model to examine the drop impact reliability and the bending reliability of a BGA mounted on an FPCB. They found that the stress could be reduced by increasing the height and diameter of solder joints. Significantly, Siegel et al. [37] were able to fabricate several low-cost flexible electronic circuits on paper substrates and obtained that the repeated folding could cause fatigue failure on the circuits. Recently, the authors of [38] and [39] also focused on the few FSI issues concerning the applications of the FPCB. They found that the deflection and stress induced in the
LEONG et al.: FLUID–STRUCTURE INTERACTION OF FLEXIBLE PRINTED CIRCUIT BOARD ELECTRONICS
TABLE I M ATERIAL P ROPERTIES
TABLE II D EFLECTIONS AT D IFFERENT M ESH S IZES FOR F LUID D OMAIN
Regions
Effective modulus (Pa)
Density (kg/m3 )
FPCB
5.24 × 10⁹ 2.70 × 10⁹
3636
Component
1337
Number of fluid domain grids {Grids on FPCB}
1170
Deflection (mm) At zero At 20° misalignment misalignment
56 332 {2,268}
0.6527
1.9889
205 484 {3,658}
0.6317
1.9712
446 403 {5,502}
0.5747
1.9546
709 567 {7,064}
0.5747
1.9540
TABLE III D EFLECTIONS AT D IFFERENT M ESH S IZES FOR S OLID D OMAIN AT Z ERO M ISALIGNMENT
Fig. 5.
Number of solid domain elements
Deflection (mm)
6114
0.5910
17 398
0.5837
31 722
0.5747
43 161
0.5742
Modeling of flow domain.
FPCB could be significantly reduced at the design stage of the devices. However, the research outcome on the application of the FPCB is still far from sufficient. Thus, this paper aims to discover the potential of FPCBs by considering its deflection and stress responses under flow condition. Different from the authors’ recent works, this paper examines various parameters (e.g., flow velocity, component thickness, component arrangement type, misalignment, and inclination) of a typical FPCB electronics. Understanding these issues is very crucial for FPCB designers to ensure better designs for their products. The findings herein can add valuable knowledge toward the development of FPCB industries. The FSI problem was addressed using the fluid-flow solver FLUENT and the structural solver ABAQUS, coupled online by the mesh-based parallel code coupling interface (MpCCI). A simple experiment was also conducted to validate the FSI numerical technique used. II. E XPERIMENTATION A. Experimental Preparation A ready-to-use FPCB was purchased from PCB Universe in the United States and used in this paper. The FPCB is single-sided with an overall thickness of 0.1 mm, consisting of a single polyimide and a single copper layer. The tensile test was conducted according to ASTM D638 [40], which is a standard test method for the tensile properties of plastics, using an INSTRON table-mounted universal testing machine at a testing speed of 50 mm/min. From the resultant stress– strain relationship of the material in Fig. 1, the effective elastic modulus of the FPCB was found to be 5.24 GPa in the linear elastic region, and its yield strength was estimated to be approximately 80 MPa. This effective modulus value is close to that reported in a previous work [28].
Fig. 6.
Types of component arrangement.
In application, the FPCB would act as a platform for various types of electronic components. To consider every type of component possible will be very tedious, impractical, and inappropriate for the purpose of this paper, because the main focus is on the FSI responses of the FPCB, hence, in this paper it was necessary to assign a general condition for FPCB electronics. Drawing ideas from Lohan et al. [6], Cole et al. [10], and Grimes et al. [11]–[14], this paper used Perspex blocks to simulate the electronic components as shown in Fig. 2. The 16 square components (31 mm × 31 mm) were individually attached to the FPCB using a strong adhesive, and subsequently, the resulting FPCB specimen was fixed at four corners. Point X, as shown in Fig. 2, is the location where the measurements were taken and compared with numerical predictions. B. Experimental Setup The test vehicle was tested in a wind tunnel with adjustable fan speed, as shown in Fig. 3. For data measurement, the real-time flow-induced deflection of the FPCB motherboard was monitored using a KEYENCE LK-G152 laser sensor connected to a controller with 0.001-mm accuracy. The position of the laser sensor can be easily manipulated using a linked actuator. In addition, the captured data are also
1338
IEEE TRANSACTIONS ON COMPONENTS, PACKAGING AND MANUFACTURING TECHNOLOGY, VOL. 2, NO. 8, AUGUST 2012 0.7
Experimental measurements FSI numerical predictions
Deflection (mm)
0.6 0.5 0.4 0.3 0.2 0.1 0.0 0
1
2
3
4
5
6
Velocity (m/s) (a) 0.7 0.6
Positive and negative misalignment angle.
Deflection (mm)
Fig. 7.
0.5 0.4 0.3 0.2
Experimental measurements FSI numerical predictions
0.1 0.0 0
4
8
12
16
20
Component thickness (mm) (b) Fig. 8.
Different inclinations of FPCB. Fig. 9. Comparisons between experimental measurements and numerical predictions for (a) different velocities and (b) different component thicknesses.
displayed and stored in the computer for further analysis. To measure air flow velocity, an anemometer with a probe, having 0.01-m/s accuracy, was also incorporated in the setup. The experiment was conducted for different velocities and different component thicknesses. III. N UMERICAL A NALYSIS A. Modeling Strategy The FSI numerical analyses were performed using the fluid flow solver FLUENT 6.3.26 and the structural solver ABAQUS/CAE 6.9, coupled online by MpCCI 3.1.0. Using the MpCCI, the quantities are exchanged from one solver mesh to another by association (neighborhood search) and interpolation in the coupling region. In ABAQUS, the model was generated, as shown in Fig. 4. The fully constrained boundary conditions (Ux = U y = Uz = UR x = UR y = URz = 0) were assigned to the fixed regions of the FPCB, where U and UR are the linear and rotational displacements, respectively. In this model, gravity was defined in the negative y-direction and the material properties were defined according to Table I. Each of the components was named according to its row and column numbers (for example, the first-row and second-column component is expressed as C1,2). In FLUENT, the flow was assumed to be 3-D, laminar, and incompressible. The laminar model is well suited to a fan-
Fig. 10.
Deflection contours for different velocities.
sucking wind tunnel as reported by Grimes et al. [11]–[14]. In this paper, the highest Reynolds number based on the component thickness [6] was also found to be 5382, which was well below the transition value of 3 × 10⁵ , characterizing that the flow condition is laminar. The laminar model may pose some limitations in fully capturing the smallscale flows in the wake of FPCB. However, the agreements between the predictions and experiment results in the later part
LEONG et al.: FLUID–STRUCTURE INTERACTION OF FLEXIBLE PRINTED CIRCUIT BOARD ELECTRONICS
Stress contours for different velocities.
Maximum deflection Maximum stress
Deflection (mm)
0.6
1.0
0.5 0.4
0.8
0.3
0.6
0.2 0.4
0.1 0.0
Fig. 13.
0.2 0
1
2
3
4
5
6
Flow velocity (m/s) Fig. 12. Maximum deflections and maximum stresses for different velocities.
Acting forces for different velocities. Maximum deflection Maximum stress
0.60 0.58 0.56 0.54 0.52 0.50 0.48 0.46 0.44 0.42 0.40 0.38 0
4
8
12
2.8 2.6 2.4 2.2 2.0 1.8 1.6 1.4 1.2 1.0 0.8 16
von Mises stress (MPa)
1.2
Deflection (mm)
0.7
von Mises stress (MPa)
Fig. 11.
1339
20
Component thickness (mm)
(Section IV-A) substantiate that the laminar was reasonable and sufficient to be applied in the current context. The fluid model covers the entire test section of the wind tunnel (600 mm × 300 mm × 297 mm), as shown in Fig. 5. At the boundary conditions, the desired velocity was set at the inlet velocity boundary, and the ambient condition was set at the pressure outlet boundary.
Fig. 14. Maximum deflections and maximum stresses for different component thicknesses.
order to substantiate the optimum mesh sizes for different case studies. This was because different misalignments would cause some changes to the fluid volume domains. It was shown that the fluid mesh of 446 403 and the solid mesh of 31 722 were appropriate to be employed in this paper.
B. Grid Independence Test Grid independence test was performed to obtain the optimum mesh size for the models. This test was studied independently on each fluid domain and solid domain for 4-mm component thickness at 5 m/s. The meshes have been refined throughout the entire domains and hence would improve the overall computational accuracy. This method of test was adopted by many previous works [2], [4], [11], [38]. In this test, the fluid domain mesh was tested for 56 332, 205 484, 446 403, and 709 567 tetrahedral grids with a constant solid mesh of 31 722, whereas the solid domain mesh was tested for 6114, 17 383, 31 722, and 43 161 hexagonal elements with a constant fluid mesh of 446 403. The deflections at point X for different mesh sizes are given in Tables II and III. For fluid domain, the test was conducted for zero misalignment and 20° misalignment in
C. Scope of Study Using the described numerical technique, this paper focuses on examining the effect of flow velocity, component thickness, types of component arrangement, misalignment, and inclination. Foremost, the effect of flow velocity was studied by controlling the velocities at 1–5 m/s. Next, the component thickness was fixed at 4, 8, 12, and 16 mm to study the effect of component thickness. In addition, the thicker components in each row and column were also examined to find the best location to place the thicker components (for example, for the case of thicker components in Column 3, the thicker components in Column 3 were fixed at 16-mm thick, whereas the others were kept at 4-mm thick). The setup is believed to be useful since the components usually consist of different thickness combinations.
1340
IEEE TRANSACTIONS ON COMPONENTS, PACKAGING AND MANUFACTURING TECHNOLOGY, VOL. 2, NO. 8, AUGUST 2012
Thickness 4 mm Thickness 8 mm Thickness 12 mm Thickness 16 mm
0.05
Force (mN)
0.04 0.03 0.02 Fig. 17.
Forces acting in the negative z-direction on the FPCB.
Fig. 18.
Deformation patterns for thicker components at different rows.
0.01 0.00 C1,1 C1,2 C1,3 C1,4 C2,1 C2,2 C2,3 C2,4 C3,1 C3,2 C3,3 C3,4 C4,1 C4,2 C4,3 C4,4
Component Fig. 15.
Acting forces for different component thicknesses.
2.0
4
1.0
3
2
-ve -ve
-ve
3
Ro w
Ro w
Ro w
Ro w
3 Co
lu m n
2
lu m n
Co
lu m n
Co
lu m n Co
4
0 2
0.0 1
1
4
0.5
von Mises stress (MPa)
Maximum deflection Maximum stress
1.5
1
Deflection (mm)
-ve denotes that the deflection is in negative z-direction
Location of thicker components Fig. 16. Maximum deflections and maximum stresses for thicker components at different locations.
In addition, the components are also arranged in different ways, namely, in-line, x-staggered, and y-staggered, as shown in Fig. 6, to determine the effect of different component arrangements. Occasionally, the FPCB would intentionally or unintentionally be positioned with a slight misalignment toward airflow (rotation about the y-axis). Such situation is anticipated to considerably affect the FPCB response. Thus, this paper also takes the initiative to examine the effect of misalignment on FPCBs. Misalignment angle in the anticlockwise rotation about the y-axis was denoted positive, as shown in Fig. 7. The misalignment angles tested were −20°, −15°, −10°, −5°, 0°, 5°, 10°, 15°, and 20°, respectively. Furthermore, as depicted in Fig. 8, the effect of inclination (rotation about the x-axis) was also studied in order to explore the behaviors of the FPCB when the gravity force is acting perpendicular to the FPCB plane.
IV. R ESULTS AND D ISCUSSION A. Experimental Measurements Versus Numerical Predictions Throughout this paper, the deflections were defined as directions perpendicular to the FPCB plane. For experimental measurements and numerical predictions, the deflections at point X are shown in Fig. 9. The experiment was carried out at the misalignment of 0°. The error bars shown were based on a 90% confidence interval of the statistical t-distribution [41]. In both plots, the comparisons show good agreement between the measurements and the predictions in terms of changing trends and magnitudes. The average magnitude discrepancy was found to be approximately 8%. Hence, this numerical technique is reliable and applicable to this paper, because it is accurate, saves time and cost, and is capable of providing full-field distribution contours. B. Effect of Flow Velocity The deflection contours are shown in Fig. 10. The deflections perpendicular to the FPCB plane predominate, hence, the earlier definition, which treats the deflections as directions perpendicular to the FPCB plane, is reasonable. The deflections in FPCBs were nonsymmetrical and slightly biased downward due to the weight of the components, which can be obviously seen at low velocity (1 m/s). At high flow velocity, the FPCB deflects at its vulnerable site (centre of FPCB) the most, because the site is located farthest from the fixed regions. From the stress contours in Fig. 11, the stress distributions are greatly influenced by component layout, in which the high
LEONG et al.: FLUID–STRUCTURE INTERACTION OF FLEXIBLE PRINTED CIRCUIT BOARD ELECTRONICS
Fig. 19.
1341
Deflection, stress, and force contours for different types of arrangement.
stresses were induced between the components. Interestingly, most stresses were endured at the vicinity of the four fixed regions, with the highest stress found at the upper fixed regions (Fixes 1 and 2). Hence, the designers may consider incorporating appropriate stiffeners at the four fixed regions to improve the reliability of the FPCB electronics. Among the components, C1, 1 and C1, 4 were obviously exposed to greater stresses, thus, placing weaker-attached components at these areas is not recommended. The maximum deflections and maximum stresses in the FPCB at different velocities are shown in Fig. 12. As the flow velocity increased from 1 to 5 m/s, both the maximum deflection and maximum stress noticeably increased by 0.49 mm and 0.71 MPa, respectively. The reason is that the higher velocity airflow can offer more flow impact at the components, especially the upstream components (Column 1), as shown in Fig. 13. Only negligible forces act at the middle components (Columns 2 and 3), because they are effectively hidden and protected from the mainstream flow. Slightly prominent forces were initiated when the airflow converged back into the mainstream at the trail of the downstream components (Column 4).
C. Effect of Component Thickness 1) Different Component Thicknesses: Primarily, the effect of component thickness was examined by adding the thicknesses of all the components on the FPCB. The maximum deflections and maximum stresses in the FPCB at different component thicknesses are shown in Fig. 14. The thicker components will gain additional weight, because of their expanded thickness, and subsequently offer more resistance to movement. As a result, the maximum deflection was found to decrease with component thickness. However, as component thickness increased, the maximum stress obviously increased from 1.00 to 2.65 MPa, mainly because the heavier components exert extra load on the FPCB. In addition, the increased stress level is also attributed to the stronger acting flow forces, because the thicker components are more exposed to airflow, as implied by Fig. 15. Hence, although the FPCB device could benefit from smaller deflection by increasing the component thickness, high stress levels are the inevitable consequence. 2) Different Locations of Placing Thicker Components: Given the findings in Section IV-C1, good sense would prevail to evaluate the thicker components at different locations.
1342
IEEE TRANSACTIONS ON COMPONENTS, PACKAGING AND MANUFACTURING TECHNOLOGY, VOL. 2, NO. 8, AUGUST 2012
3
1.1
0.6
1.0 0.9
0.5 0.8 0.4
0.7
2
Deflection (mm)
Maximum deflection Maximum stress
von Mises stress (MPa)
Deflection (mm)
0.7
Maximum deflection
1 0 -1 -2 -3
0.3
-25
0.6 In-line
-20
-15
Arrangement
D. Types of Component Arrangement This paper also explores different component arrangements, namely, in-line arrangement, x-staggered arrangement, and y-staggered arrangement, as shown in Fig. 19. The results show that the different arrangements have significant effects on the deformation of FPCB. The in-line arrangement resulted in a circular deflection pattern, whereas the staggered arrangement resulted in almost linear deformations. The x-staggered
0
5
10
15
20
25
15
20
25
8
von Mises stress (MPa)
Hence, an extended study is warranted to examine the thicker components at different rows and columns. In practice, the thicker components are usually preferably positioned such that minimum deflection and minimum stress are achieved. Fig. 16 shows the maximum deflections and maximum stresses of the thicker components of the FPCB at different locations. Among the columns, only the thicker components in Column 4 deflect the FPCB toward the negative z-direction. The reason is that the presence of thicker components will obviously obstruct air flow, thereby causing the flow forces to act in the negative z-direction in front of the thicker components, as shown in Fig. 17. With the thicker components at Column 4, a major part of the FPCB will be forced toward the negative z-direction. On the other hand, placing thicker components at the upper rows of the FPCB (Rows 1 and 2) will also result in negative maximum deflection due to the deformation patterns shown in Fig. 18. Significantly, the results suggest that the thicker components will be better placed along a column, where deflection and stress levels are small, than in rows. From the foregoing findings, the designers are put on notice and may want to design the component layout such that the thicker components are aligned along a column. Furthermore, placing the thicker components along Column 1 is recommended because it provides the optimum condition, offering the smallest deflection and stress levels. However, if this is not possible, the designers have the option to select either Column 3 or Column 4 as well, depending on the interest in the application. The former allows better deflection, whereas the latter provides better stress control. Column 2 is the worst option among the columns and should be the last resort.
-5
Misalignment angle (deg) (a)
x-staggered y-staggered
Fig. 20. Maximum deflections and maximum stresses for different types of arrangement.
-10
Maximum stress
7 6 5 4 3 2 1 0 -25
-20
-15
-10
-5
0
5
10
Misalignment angle (deg) (b) Fig. 21. (a) Maximum deflections and (b) maximum stresses for different misalignment angles.
and y-staggered arrangements deflected uniformly along the y-direction and x-direction, respectively. The staggered arrangement is strong along its staggered direction due to the zigzag alignment of the components; for instance, x-staggered would strengthen the x-direction of FPCB, and hence it deflects uniformly along the y-direction. Similar to the in-line arrangement, the stress distribution of the staggered arrangement agree with the trend that high stresses are induced between the components with the higher stresses accumulated at the four fixed regions. However, the stresses in the staggered arrangement were obviously high along the uniformly deflected direction, because this region is significantly strained by linear pattern deformations along FPCB. In terms of acting flow forces, the y-staggered arrangement is comparable to the in-line arrangement. However, higher forces are acting on the x-staggered arrangement, because its Column 2 components are no longer hidden but are exposed directly to the air flow. The maximum deflections and maximum stresses in the FPCB under different arrangements are shown in Fig. 20. The staggered arrangement can provide better deflection and stress levels than the in-line arrangement because of the strengthening effect. Comparing the two staggered arrangements, the x-staggered arrangement was found to suffer from higher stress, consistent with the contours of the forces, indicating that higher forces are involved; whereas the y-staggered arrangement is more prone to deflection because, in this case, the FPCB is longer along the y-direction. Hence, with the
LEONG et al.: FLUID–STRUCTURE INTERACTION OF FLEXIBLE PRINTED CIRCUIT BOARD ELECTRONICS
1343
Deflection (mm)
0.5
10 8
0.0 -0.5
6
-1.0
4
-1.5 2
-2.0 -2.5
von Mises stress (MPa)
Maximum deflection Maximum stress
1.0
0 Vertical
45 degree Horizontal Configuration
Fig. 22.
Deflection contours for different inclinations.
deformation of y-staggered arrangement, higher deflection is expected. Hence, the staggered arrangement is strongly suggested in FPCB electronics because of the small deflection and stress levels it affords. In current FPCB designs, the designers may adopt either the x-staggered or the y-staggered arrangements depending on the tradeoff desired between deflection and stress. E. Effect of Misalignment The effect of misalignment was also considered in this paper, and the results are shown in Fig. 21. As expected, the different misalignment angles affect FPCB response. The plots were not mirrored at the zero misalignment angle, because the FPCB is not symmetrical but made up of component and noncomponent sides. The results show that a positive misalignment angle causes positive deflection and vice versa. These phenomena are mainly due to the way the FPCB reacts to air flow, as shown in Fig. 7. As the misalignment angle increases (whether positively or negatively), both deflection and stress were significantly boosted. At a misalignment angle of −20°, the highest deflection and the highest stress values were −2.02 mm and 7.61 MPa, respectively. This is because FPCB misalignment causes greater projection area toward the airflow, and, consequently, a higher impingement is generated on the FPCB. Hence, the designers should be aware of this issue and make the necessary adjustments to minimize the misalignment angle for better deflection and stress control. Although the negative misalignment angle may promise advantages to FPCBs from a cooling aspect (which is not the focus of this paper), the designers have to be put on notice of the risks associated with deflections and stresses. F. Different Inclinations Interestingly, this paper also investigated the configurations for different inclinations. The gravity force was anticipated to have great influence on the behaviors of the FPCB when the force is acting perpendicular to the FPCB plane.
Fig. 23. Maximum deflections and maximum stresses for different inclinations.
The deflection contours are provided in Fig. 22. For 45° and horizontal configurations, most of the deflections across the FPCB contours were negative, caused by the substantial gravity force component. The maximum deflection is still occurred at its vulnerable site at the centre of the FPCB. In Fig. 23, the plot shows the maximum deflections and maximum stresses in the FPCB for different inclinations. Remarkably, the effect of FPCB inclination was observed to be significant and important in affecting the FPCB performance. With the worst scenario of horizontal configuration, the highest deflection and stress values were −2.05 mm and 8.10 MPa, respectively. The magnitudes were amplified as much as 3.53 times (for deflection) and 8.09 times (for stress) from the vertical configuration. Therefore, the vertical configuration is strongly recommended for the FPCB electronics. It is also advised for the designers to avoid the horizontal configuration in the design, as this configuration would impose massive deflection and stress on the system. G. Discussion on the FPCB Electronics The maximum deflections and maximum stresses under various conditions were found to be in the range of 0.09– 2.05 mm and 0.29–8.10 MPa, respectively. At this juncture, the large deflection has to be seriously considered to guarantee better reliability of FPCB electronics. Large FPCB deformation can cause physical contact among the components, as well as with nearby objects, especially under miniaturized conditions, thereby adversely affecting the performance of the device. Comparing the induced stresses with the yield strength of the FPCB (80 MPa), most of the stresses were in the acceptable range. Hence, the FPCB can be regarded as the prospective and potential platform in the future electronic development. However, the stress factor should not be simply ignored because FPCB is significantly much sensitive to induce deflection and stress. Under extreme operating condition, stress would become a critical factor, greatly affecting the reliability.
1344
IEEE TRANSACTIONS ON COMPONENTS, PACKAGING AND MANUFACTURING TECHNOLOGY, VOL. 2, NO. 8, AUGUST 2012
Unlike rigid PCBs, deflection and stress were proven and observed to be far more vital in the development of FPCB electronics. In application, efforts toward the minimization of deflection and stress will be greatly appreciated for the purpose of improving reliability, which factors are particularly important in FPCB electronics. V. C ONCLUSION This paper outlined the effects of deflection and stress on FPCBs under flow environment. The numerical study was performed using FLUENT and ABAQUS, coupled online by MpCCI. The numerical predictions were validated to be in good agreement with the experimental measurements. Unlike in rigid PCBs, deflection and stress were proven and observed to be far more vital in FPCB electronics. As flow velocity increased, deflection and stress in the FPCB also noticeably increased. In addition, thick components amplified the stresses and reduced deflection, owing to the weight factor and inertia effect of the heavier components. In terms of deflection and stress, the thick components should be positioned in Column 1, the next priority would be Column 3 (smaller induced deflection) or Column 4 (smaller induced stress), in the order of functional preference. Furthermore, a staggered arrangement of FPCB components was recommended because it regulates deflection and stress better than the in-line arrangement. The misalignment angle should also be minimized to avoid unnecessary worsening of deflection and stress conditions. Finally, the vertical configuration was strongly suggested for the FPCB electronics as it offers smallest possible deflection and stress. The findings in this paper are valuable and important to the FPCB industries. This paper could also be extended into the electrical circuit and electronic signal concerns. ACKNOWLEDGMENT This paper was supported by the Universiti Sains Malaysia, Penang, Malaysia under the USM Fellowship Scheme. R EFERENCES [1] K. Azar and E. T. Russell, “Effect of component layout and geometry on the flow distribution in electronics circuit packs,” in Proc. 6th IEEE SEMI-THERM Symp., Feb. 1990, pp. 1–9. [2] T. Lee and M. Mahalingam, “Application of a CFD tool for system level thermal simulation,” in Proc. IEEE 43rd Electron. Comp. Technol. Conf., Jun. 1993, pp. 249–255. [3] V. Eveloy, J. Lohan, and P. Rodgers, “A benchmark study of computational fluid dynamics predictive accuracy for component-printed circuit board heat transfer,” IEEE Trans. Comp. Packag. Technol., vol. 23, no. 3, pp. 568–577, Sep. 2000. [4] P. J. Rodgers, V. C. Eveloy, and M. R. D. Davies, “An experimental assessment of numerical predictive accuracy for electronic component heat transfer in forced convection-part I: Experimental methods and numerical modeling,” J. Electron. Packag., vol. 125, pp. 67–75, Mar. 2003. [5] P. J. Rodgers, V. C. Eveloy, and M. R. D. Davies, “An experimental assessment of numerical predictive accuracy for electronic component heat transfer in forced convection-part II: Results and discussion,” J. Electron. Packag., vol. 125, pp. 76–83, Mar. 2003. [6] J. Lohan, V. Eveloy, and P. Rodgers, “Visualization of forced air flows over a populated printed circuit board and their impact in convective heat transfer,” in Proc. Inter Soc. Conf. Thermal Phenomena, 2002, pp. 501–511.
[7] C. W. Leung, S. Chen, and T. L. Chan, “Numerical simulation of laminar forced convection in AN air-cooled horizontal printed circuit board assembly,” Numer. Heat Transfer, Part A, vol. 37, no. 4, pp. 373–393, 2000. [8] G. V. Shankaran and K. Karimanal, “A multi level modeling approach with boundary condition import for system, sub-system or board level thermal characterization,” in Proc. 18th IEEE SEMI-THERM Symp., Mar. 2002, pp. 35–41. [9] M. Baelmans, J. Meyers, and K. Nevelsteen, “Flow modeling in aircooled electronic enclosures,” in Proc. 19th IEEE SEMI-THERM Symp., Mar. 2003, pp. 27–34. [10] R. Cole, M. Davies, and J. Punch, “A board level study of an array of ball grid components-aerodynamic and thermal measurements,” J. Electron. Packag., vol. 125, no. 4, pp. 480–489, 2003. [11] R. Grimes, M. Davies, J. Punch, T. Dalton, and R. Cole, “Modeling electronic cooling axial fan flows,” J. Electron. Packag., vol. 123, pp. 112–119, Jun. 2001. [12] R. Grimes and M. Davies, “The effect of fan operating point and location on temperature distribution in electronic systems,” in Proc. Inter Soc. Conf. Thermal Phenomena, 2002, pp. 677–684. [13] R. Grimes and M. Davies, “Air flow and heat transfer in fan cooled electronic systems,” J. Electron. Packag., vol. 126, pp. 124–134, Mar. 2004. [14] R. Grimes and M. Davies, “Optical measurement of electronic system air flow and temperature distribution,” J. Opt. A, Pure Appl. Opt., vol. 6, no. 6, pp. 617–626, 2004. [15] F. Yilmaz and M. Y. Gundogdu, “Experimental and computational investigation of velocity field for intermediate region of laminar pulsatile pipe flow,” J. Thermal Sci. Technol., vol. 30, no. 2, pp. 21–35, 2010. [16] Y. E. Akansu, M. Ozmert, and E. Firat, “The effect of attack angle to vortex shedding phenomenon of flow around a square prism with a flow control rod,” J. Thermal Sci. Technol., vol. 31, no. 1, pp. 109–120, 2011. [17] L. Leicht and A. Skipor, “Mechanical cycling fatigue of PBGA package interconnects,” Microelectron. Rel., vol. 40, no. 7, pp. 1129–1133, 2000. [18] A. Skipor and L. Leicht, “Mechanical bending fatigue reliability and its application to area array packaging,” in Proc. Electron. Comp. Technol. Conf., 2001, pp. 606–612. [19] J. Zhu, S. Quander, and T. Reinikainen, “Global/local modeling for PWB mechanical loading,” in Proc. Electron. Comp. Technol. Conf., 2001, pp. 1164–1169. [20] S. Shetty, V. Lehtinen, A. Dasgupta, V. Halkola, and T. Reinikainen, “Fatigue of chip scale package interconnects due to cyclic bending,” J. Electron. Packag., vol. 123, no. 3, pp. 302–308, 2001. [21] S. Shetty and T. Reinikainen, “Three- and four-point bend testing for electronic packages,” J. Electron. Packag., vol. 125, no. 4, pp. 556–561, 2003. [22] D. Lau, Y. S. Chan, S. W. R. Lee, L. Fu, Y. Ye, and S. Liu, “Experimental testing and failure prediction of PBGA package assemblies under 3-point bending condition through computational stress analysis,” in Proc. 7th Int. Conf. Electron. Packag. Technol., 2006, pp. 1–7. [23] D. Yu, J. B. Kwak, S. Park, and J. Lee, “Dynamic responses of PCB under product-level free drop impact,” Microelectron. Rel., vol. 50, no. 7, pp. 1028–1038, 2010. [24] L. Arruda, R. Bonadiman, F. Costa, and T. Reinikainen, “Cracking phenomena on flexible-rigid interfaces in PCBs under thermo cycling load,” Circuit World, vol. 35, no. 2, pp. 28–22, 2009. [25] L. Arruda, Q. Chen, and J. Quintero, “Failure evaluation of flexible-rigid PCBs by thermo-mechanical simulation,” in Proc. Int. Conf. Electron. Packag. Technol. High Density Packag., 2009, pp. 1201–1205. [26] H.-B. Sun, M.-Q. Shi, P. Yang, J. Zhong, Q. Chen, T. Xue, T. Zhao, L. Xu, and A. Salo, “Rigid-flexible printed circuit structure optimization by simulations,” in Proc. 10th Int. Conf. Thermal, Mech. Multiphys. Simul. Experim. Micro-Electron. Micro-Syst., 2009, pp. 1–4. [27] R. N. Das, F. D. Egitto, B. Wilson, M. D. Poliks, and V. R. Markovich, “Development of rigid-flex and multilayer flex for electronic packaging,” in Proc. Electron. Comp. Technol. Conf., 2010, pp. 568–574. [28] R. S. Li and J. Jiao, “The effects of temperature and aging on Young’s moduli of polymeric based flexible substrate,” Int. J. Microcircuits Electron. Packag., vol. 23, no. 4, pp. 456–461, 2000. [29] E. Martynenko, W. Zhou, A. Chudnovsky, R. S. Li, and L. Poglitsch, “High cycle fatigue resistance and reliability assessment of flexible printed circuitry,” Trans. ASME, vol. 124, no. 3, pp. 254–259, 2002. [30] F. Barlow, A. Lostetter, and A. Elshabini, “Low cost flex substrates for miniaturized electronic assemblies,” Microelectron. Rel., vol. 42, no. 7, pp. 1091–1099, 2002. [31] A. Ptchelintsev, “Automated modeling and fatigue analysis of flexible printed circuits,” in Proc. 7th Int. Conf. Thermal, Mech. Multiphys. Simul. Experim. Micro-Electron. Micro-Syst., 2006, pp. 1–6.
LEONG et al.: FLUID–STRUCTURE INTERACTION OF FLEXIBLE PRINTED CIRCUIT BOARD ELECTRONICS
[32] W. S. van Driel, O. van der Sluis, D. G. Yang, R. Ubachs, C. Zenz, G. Aflenzer, and G. Q. Zhang, “Reliability modeling for packages in flexible end-products,” Microelectron. Rel., vol. 46, nos. 9–11, pp. 1880–1885, 2006. [33] S. Han, K. Seo, W. Kim, H. Lee, H. Lee, J. Shin, and J. Lee, “Fatigue behavior of thin Cu foils for flexible printed circuit board,” Solid State Phenomena, vols. 124–126, pp. 1369–1372, Jun. 2007. [34] L. Arruda and G. Freitas, “Effect of surrounding air on board level drop tests of flexible printed circuit boards,” in Proc. Int. Conf. Thermal, Mech. Multi-Phys. Simul. Experim. Microelectron. Micro-Syst., 2007, pp. 1–4. [35] J. Huang, Q. Chen, L. Xu, and G. Q. Zhang, “Prediction of drop impact reliability of BGA solder joints on FPC,” in Proc. 11th Electron. Packag. Technol. Conf., 2009, pp. 663–667. [36] J. Huang, Q. Chen, L. Xu, and G. Q. Zhang, “Prediction of bending reliability of BGA solder joints on flexible printed circuit (FPC),” in Proc. Int. Conf. Electron. Packag. Technol. High Density Packag., 2009, pp. 1195–1200. [37] A. C. Siegel, S. T. Phillips, M. D. Dickey, N. Lu, Z. Suo, and G. M. Whitesides, “Foldable printed circuit boards on paper substrates,” Adv. Functional Mater., vol. 20, no. 1, pp. 28–35, 2010. [38] W. C. Leong, M. Z. Abdullah, M. A. Mujeebu, “Flow induced deflection and stress on flexible printed circuit board in fan-cooled electronic systems: FSI approach,” IEEE Trans. Comp., Packag. Manuf. Technol., vol. 2, no. 4, pp. 617–624, Apr. 2012. [39] W. C. Leong, M. Z. Abdullah, and C. Y. Khor, “Application of flexible printed circuit board (FPCB) in personal computer motherboards: Focusing on mechanical performance,” Microelectron. Rel., vol. 52, no. 4, pp. 744–756, 2012. [40] Standard Test Method for Tensile Properties of Plastics, ASTM Standard D638, 2003. [41] T. G. Beckwith, R. D. Marangoni, and J. H. Lienhard, Mechanical Measurements, 6th ed. Singapore: Pearson Education, 2007, pp. 67–75.
Wei Chiat Leong received the Bachelor’s degree in mechanical engineering (First Hons.) from Universiti Sains Malaysia (USM), Minden, Malaysia, where he is currently pursuing the Doctoral degree in electronic packaging, specializing in the area of flexible printed circuit board. His current research interests include fluid mechanics, CFD, structural analysis, FEM, fluidstructure interaction study, and electronic packaging. Mr. Leong is an Active Member of the Institution of Engineers Malaysia, registered under the Board of Engineers Malaysia.
1345
Mohd Zulkifly Abdullah received the Bachelor’s degree in mechanical engineering from the University of Wales, Swansea, U.K., and the M.Sc. and Ph.D. degrees from the University of Strathclyde, Glasgow, U.K. He is a Professor of mechanical engineering with Universiti Sains Malaysia, Minden, Malaysia. He has numerous publications in international journals and conference proceedings. His current research interests include CFD, heat transfer, electronics, and packaging.
Chu Yee Khor received the Graduate degree in mechanical engineering and the Master’s degree in computational fluid dynamics, specializing in integrated circuit packaging from Universiti Sains Malaysia, Minden, Malaysia, in 2008 and 2010, respectively, where he is currently pursuing the Ph.D. degree in advanced packaging in microelectronics. His current research interests include electronics packaging, fluid/structure interaction, fluid mechanics, dynamics, polymer rheology, and heat and mass transfer.
Ernest Ern Seang Ong received the Bachelor’s degree in mechanical engineering from University Putra Malaysia, Serdang, Malaysia, in 2009. He is currently pursuing the Master’s degree in advanced electronic packaging with TSV technology. He has been a Design Engineer with Renesas Semiconductor Design (M) Sdn Bhd, Pulau Pinang, Malaysia, from 2009 to 2011, where he was working in package development group. His current research interests include package reliability, TSV technology, electronic cooling, CFD and FSI. Mr. Ong has received several companywide awards in diode package development and test development projects.