IOP Conference Series: Materials Science and Engineering
PAPER • OPEN ACCESS
Study on water pollution change rule and source in Taihu Lake Basin To cite this article: Song wei 2018 IOP Conf. Ser.: Mater. Sci. Eng. 392 042048
View the article online for updates and enhancements.
This content was downloaded from IP address 191.96.83.251 on 03/08/2018 at 02:38
MTMCE IOP Publishing IOP Conf. Series: Materials Science and Engineering 392 (2018) 042048 doi:10.1088/1757-899X/392/4/042048 1234567890‘’“”
Study on water pollution change rule and source in Taihu Lake Basin Song wei Tianjin Research Institute for Water Transport Engineering, M.O.T., Tianjin 300456, China Email:
[email protected] Abstract: The main pollutants of water environment in Taihu (COD, NH3-N and DO) are studied in this paper. The statistical analysis characteristics of the weekly mean concentration of pollutants in seven automatic monitoring stations in Taihu Lake Basin were studied by statistical methods, and the correlation between the meteorological data of seven stations and pollutants was analyzed. The results show that, the normal distribution is the water quality index of each site, and the fit type selection is most consistent with the significant relationship. DO weekly mean concentrations were better correlated at several sites except for individual sites, CODMn weeks mean concentration, the correlation between the sites is very small, the correlation between NH3-N weeks mean concentration at all sites showed no correlation or low linear correlation, These results shows that the DO pollution sources of these stations have some relevance, but the pollution sources of CODMn and NH3-N are not related closely, and only a few sites are related.
1. Introduction In recent years, great achievements have been made in China's economic construction, but the deterioration of the ecological environment is accompanied by economic growth, among which water related problems are the most prominent. It is urgent to strengthen the prevention and control of water pollution, to reduce the harm to human health and the environment caused by water pollution, and to formulate effective control strategies for pollutants[1]. The cause and treatment of water pollution in Taihu has always been a hot issue. Yin Yan,Zhang Yunlin and so on [2][3] have successively studied the temporal and spatial distribution of COD and the correlation with other elements in the northern Taihu Lake region and the whole lake area, Yang Dingtian and Chen Weimin [4] analyzed the temporal and spatial distribution of COD and its related factors in Meiliang Bay,Taihu, Xie Rongrong and so on[5] have studied the emission changes of COD and NH3-N in Taihu, and have determined the total reduction rate of these two pollutants. In this paper, the main pollutants of water environment in Taihu are taken as the object of study. By analyzing the changing trend and correlation of various pollutants evaluation indexes, the trend of the function of some pollution indexes is obtained, and based on the analysis of the sources of the major pollutants, the relationship between the various influencing factors is found, which provides the research and policy basis for controlling and reducing pollution at the source. 2. Research Area and Data 2.1 Research Area Taihu called Zhenze, also known as wuhu, Located at longitude 119, 52 ', 32', 120, 36 ', 10', latitude 30, Content from this work may be used under the terms of the Creative Commons Attribution 3.0 licence. Any further distribution of this work must maintain attribution to the author(s) and the title of the work, journal citation and DOI. Published under licence by IOP Publishing Ltd 1
MTMCE IOP Publishing IOP Conf. Series: Materials Science and Engineering 392 (2018) 042048 doi:10.1088/1757-899X/392/4/042048 1234567890‘’“”
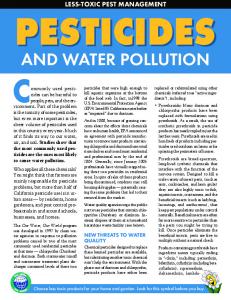
55 ', 40' - 31 ', 32' 58', Is China's third largest freshwater lake, Lake area of 2338km², drainage area of 36985km². there are 48 islands and 72 peaks. The Taihu regional map is shown in figure 1.
Figure 1 Taihu lake regional map 2.2 Research Data The scope of this research is Jiangsu Wuxi Shazhu the water quality automatic monitoring station, Jiangsu Yixing Lanshanzui water quality automatic monitoring station, Jiangsu Suzhou Xishan water quality automatic monitoring station, Zhejiang Huzhou Xintang harbor water quality automatic monitoring station, Shanghai Qingpu Jishui harbor water quality automatic monitoring station, Zhejiang Jiaxing Wangjiangjing River water quality automatic monitoring station and Zhejiang Jiaxing Xielu harbor water quality automatic monitoring station. there are seven key water quality monitoring stations of the Taihu Lake basin. Table 1 gives the latitude, longitude and cross section information of the seven monitoring stations. Table 1 location of seven water quality automatic monitoring stations in Taihu Lake Basin Point name Jiangsu Wuxi Shazhu monitoring station Jiangsu Yixing Lanshanzui monitoring station Jiangsu Suzhou Xishan monitoring station Zhejiang Huzhou Xintang harbor monitoring station Shanghai Qingpu Jishui harbor monitoring station Zhejiang Jiaxing Wangjiangjing River monitoring station Zhejiang Jiaxing Xielu harbor monitoring station.
Point latitude and longitude East longitude 120°13′ 46″ north latitude 31°23′58″ East longitude 119°54′ 43″north latitude31°12′ 56″ East longitude120°12′0″ north latitude31°13′0″ East longitude 120°50′ 20″north latitude30°50′ 50″ East longitude 120°54′ 06″north latitude31°06′ 56″ East longitude 120°42′ 31″north latitude3°53′ 06″ East longitude120°42′31″ north latitude30°53′06″
2
Rivers Taihu
Taihu Taihu Xintang harbor river
Jishui harbor river Beijing Hangzhou the Grande Canale Xielu harbor river
MTMCE IOP Publishing IOP Conf. Series: Materials Science and Engineering 392 (2018) 042048 doi:10.1088/1757-899X/392/4/042048 1234567890‘’“”
3. Statistical distribution characteristics of water quality indicators in Taihu Lake Basin 3.1 Determine the weekly concentration optimal statistical distribution model of water quality evaluation index The basic normal distribution, uniform distribution, Poisson distribution and exponential distribution are used in the statistical distribution model, the weekly concentration data of each site in 2011 were analyzed by representative data, the optimum distribution model of three water quality indexes (mainly DO, CODMn and NH3-N) was determined, and two kinds of goodness of fit test methods, KS test and Binomial test, were used to test the accuracy. The fit test results about the index concentration of Jiangsu Wuxi Shazhu the water quality automatic monitoring stations in Taihu basin as shown in table 2~4. Table 2 in Wuxi, Jiangsu Sha Zhu automatic water quality monitoring stations DO concentration goodness of fit test results in 2011 SN 1 2 3 4 5
Original hypothesis The categories defined by DO11.94 occur with probabilities of 0.5 and 0.5 The distribution of DO is normal, with an average value of 9.56 and a standard deviation of 2.74 The distribution of DO is uniform, with a minimum value of 5.87 and a maximum value of 18 The distribution of DO is Poisson, with an average value of 0.00 The distribution of DO is exponential, with an average value of 9.56
Test method
Sig.
conclusion
Single sample Binomial test
0.000
Reject null hypothesis
Single sanullmple KS test
0.230
Keep null hypothesis
Single sample KS test
0.000
Reject null hypothesis
—
beyond computation
0.000
Reject null hypothesis
Single sample KS test Single sample KS test
Table 3 in Wuxi, Jiangsu Sha Zhu automatic water quality monitoring stations CODMn concentration goodness of fit test results in 2011 SN 1 2 3 4 5
Original hypothesis The categories defined by CODMn3.75 occur with probabilities of 0.5 and 0.5 The distribution of CODMn is normal, with an average value of 3.60 and a standard deviation of 0.58 The distribution of CODMn is uniform, with a minimum value of 2.60 and a maximum value of 4.90 The distribution of CODMn is Poisson, with an average value of 0.00 The distribution of CODMn is exponential, with an average value of 3.60
Test method Single sample Binomial test
Sig. 0.127
conclusion Keep null hypothesis
Single sample KS test
0.530
Keep null hypothesis
Single sample KS test
0.097
Keep null hypothesis
—
beyond computation
0.000
Reject null hypothesis
Single sample KS test Single sample KS test
Table 4 in Wuxi, Jiangsu Sha Zhu automatic water quality monitoring stations NH3-Nconcentration goodness of fit test results in 2011 SN 1 2
Original hypothesis The categories defined by NH3-N0.28 occur with probabilities of 0.5 and 0.5 The distribution of NH3-N is normal, with an average value of 0.24 and a standard deviation of 0.09
3
Test method
Sig.
conclusion
Single sample Binomial test
0.000
Reject null hypothesis
Single sample KS test
0.265
Keep null hypothesis
MTMCE IOP Publishing IOP Conf. Series: Materials Science and Engineering 392 (2018) 042048 doi:10.1088/1757-899X/392/4/042048 1234567890‘’“”
The distribution of NH3-N is uniform, with a minimum value of 0.05 and a maximum value of 0.51 The distribution of NH3-N is Poisson, with an average value of 0.00 The distribution of NH3-N is exponential, with an average value of 0.24
3 4 5
Single sample KS test Single sample KS test Single sample KS test
0.000
Reject null hypothesis
—
beyond computation
0.000
Reject null hypothesis
Further analysis of the other six sites, the analysis of significant differences, it is worth the water quality evaluation index, the best fitting distribution of concentration values are all normal distribution. 3.2 Parameter estimation of optimum concentration model of water quality index Maximum likelihood (MLE) is used to estimate the statistical parameters of pollutant concentration under optimum distribution. In the 3.1 section, the concentration optimal distribution model of water quality evaluation parameters in Taihu basin has been established as normal distribution. The parameters of these distributions are estimated at a confidence level of 95%, i.e., the level of significance is 5%. This shows that the parameter value exceeds the given value with a probability of only 5%. Table 5 to 7 respectively estimates the estimated parameters of the best concentration model for the water quality evaluation parameters of the Taihu Lake Basin using maximum likelihood. Table 5 The site of the Taihu Basin DO weekly concentration under the the normal distribution parameter estimation in 2011 Site number 1 2 3 4
Mean value in distribution 9.56 7.80 9.56 9.17
Standard deviation 2.74 1.95 2.74 3.11
Sig 0.230 0.850 0.230 0.125
5
6.88
2.23
0.045
6 7
4.46 4.49
0.97 1.71
0.913 0.889
conclusion Keep null hypothesis Keep null hypothesis Keep null hypothesis Keep null hypothesis Reject null hypothesis Keep null hypothesis Keep null hypothesis
As shown in table 5, the DO concentrations in seven sites of the Taihu Basin is vary greatly. Since the concentration of DO in the water quality automatic monitoring station of Qingpu Shanghai Jishui harbor is higher than that of 5~6mg/L, the normal fitting can not agree with the significant level of 5%. The asymptotic significance value is 0.045, close to 0.05, which can basically satisfy the normal distribution. Except for the water quality automatic monitoring station of Qingpu Shanghai Jishui harbor, the normal fitting of the other six stations is good, that is, the difference assumption is completely established. Table 6 The site of the Taihu Basin CODMn weekly concentration under the the normal distribution Site number
Mean value in distribution
Standard deviation
Sig
4
conclusion Keep null hypothesis Reject null hypothesis Keep null hypothesis Keep null hypothesis Keep null hypothesis
MTMCE IOP Publishing IOP Conf. Series: Materials Science and Engineering 392 (2018) 042048 doi:10.1088/1757-899X/392/4/042048 1234567890‘’“”
Keep null hypothesis Keep null hypothesis
As shown in table 6, under the condition that the concentration of CODMn in the water quality automatic monitoring station of Yixing Lanshanzui in Jiangsu was 0.05 in the significant level, reject null hypothesis, that is to say, the concentration difference is not obvious at this significance level, but the asymptotic significance value is close to 0.042 and 0.05, and the other distribution fitting is far less than the normal distribution. The best fitted normal distribution is fitted. Table 7 the site of the Taihu Basin NH3-N weekly concentration under the the normal distribution parameter estimation in 2011
Mean value in distribution
Keep null hypothesis
Keep null hypothesis
Keep null hypothesis
Keep null hypothesis
Keep null hypothesis
Keep null hypothesis
Site number
Standard deviation
Sig
conclusion
Keep null hypothesis
As shown in table 7, compared with the concentration of the first two groups, the average concentration of NH3-N is small and the standard deviation is small,the asymptotic significance values are not less than 0.05, that is,under normal distribution, under the condition that the significance level is 0.05, the NH3-N concentration data can be tested by significance test. 4. Variation trend of water quality index concentration in Taihu Basin 4.1 Characteristics of weekly variation of water quality in Taihu Basin This paper mainly identifies three water quality indicators (mainly DO, CODMn and NH3-N), reference (GB 3838-2002)[7] form State Bureau of environmental protection. In addition to the emission sources, the concentration index of water pollution is also affected by meteorological conditions such as temperature, rainfall and so on. Therefore, in a certain area, the concentration of water quality index shows a tendency to change with time. Tables 8 to 10 describe the basic statistics of concentration values from December 27, 2010 to December 25, 2011 (the year of 2011). Table 8 the site of taihu lake watershed DO weeks are concentration of basic statistics in 2011 Site 1 Site 2 Site 3 Site 4 Site 5 Site 6 Site 7 average 9.564 7.795 7.096 9.170 6.875 4.464 4.490 standard error 0.381 0.271 0.213 0.432 0.309 0.135 0.237 median 8.690 7.740 6.645 7.980 6.185 4.460 4.435 mode 10.500 9.890 8.110 13.500 6.560 4.690 6.020 standard 2.744 1.952 1.537 3.114 2.225 0.974 1.709 deviation variance 7.531 3.812 2.362 9.695 4.951 0.949 2.921
5
MTMCE IOP Publishing IOP Conf. Series: Materials Science and Engineering 392 (2018) 042048 doi:10.1088/1757-899X/392/4/042048 1234567890‘’“”
Site 1 Site 2 Site 3 Site 4 kurtosis 0.930 0.274 0.022 -0.621 skewness 1.142 -0.279 0.761 0.544 region 12.130 9.730 5.980 12.690 minimum value 5.870 2.470 4.820 3.910 Maximum 18.000 12.200 10.800 16.600 value sum 497.330 405.350 368.980 476.830 count 52 52 52 52 Notes:the names of each site are described in Section 3.2.
Site 5 -0.257 0.790 9.070 3.330
Site 6 0.858 -0.134 4.840 1.860
Site 7 -0.259 0.186 7.210 1.540
12.400
6.700
8.750
357.500 52
232.150 52
233.470 52
Table 9 the site of taihu lake watershed CODMn weeks are concentration of basic statistics in 2011 average standard error median mode standard deviation variance kurtosis skewness region minimum value Maximum value sum count
Site 1 3.596 0.081 3.500 3.300
Site 2 4.054 0.206 3.700 3.500
Site 3 4.035 0.125 4.000 4.300
Site 4 4.588 0.163 4.800 4.800
Site 5 3.998 0.087 4.000 4.000
Site 6 6.165 0.183 6.200 6.600
Site 7 7.956 0.071 7.900 7.600
0.585
1.487
0.899
1.153
0.625
1.319
0.515
0.342 -0.803 0.250 2.300
2.210 3.118 1.688 7.000
0.808 -0.232 -0.001 4.200
1.329 .523 -0.688 5.300
0.391 0.596 0.297 3.200
1.739 0.314 -0.493 6.200
0.265 0.549 0.213 2.600
2.600
1.800
1.800
1.700
2.500
2.400
6.900
4.900
8.800
6.000
7.000
5.700
8.600
9.500
187.000 52
210.800 52
209.800 52
229.400 50
207.900 52
320.600 52
413.700 52
Table 10 the site of taihu lake watershed NH3-N weeks are concentration of basic statistics in 2011 average standard error median mode standard deviation variance kurtosis skewness region minimum value Maximum value sum count
Site 1 0.012 0.230 0.260 0.088
Site 2 0.836 0.079 0.765 0.900
Site 3 0.161 0.011 0.140 0.120
Site 4 0.431 0.026 0.410 0.230
Site 5 1.769 0.079 1.755 2.240
Site 6 1.617 0.088 1.705 2.120
Site 7 1.363 0.092 1.415 1.340
0.008
0.573
0.079
0.188
0.571
0.632
0.662
2.231 1.086 0.460 0.050
0.328 2.544 1.356 2.830
0.006 4.910 2.010 0.410
0.035 -0.611 0.375 0.820
0.326 0.609 0.730 2.720
0.400 -1.097 -0.279 2.370
0.438 -0.925 0.120 2.360
0.510
0.060
0.060
0.060
0.860
0.370
0.220
12.590
2.890
0.470
0.880
3.580
2.740
2.580
497.330 52
43.490 52
8.390 52
22.390 52
91.970 52
84.100 52
70.900 52
4.2 Correlation analysis with the concentration index of water quality in Taihu Basin The correlation coefficient is an index describing the degree of dispersion between the two sets of
6
MTMCE IOP Publishing IOP Conf. Series: Materials Science and Engineering 392 (2018) 042048 doi:10.1088/1757-899X/392/4/042048 1234567890‘’“”
measurement variables. Used to determine whether changes in two sets of measurement variables are related, that is, whether a larger value of a variable is associated with a larger value of another variable (positive correlation) ; Or whether a smaller value of a variable is associated with a larger value of another variable(negative correlation) ; Or the values in the two variables are not related to each other (the correlation coefficient is approximately zero). Let (X, Y) be a binary random variable, then the correlation coefficient is expressed as : 𝑟
∑
= ∑
(1) ∑
Formula :rXY is a correlation coefficients of random variables X and Y. r is a numerical characteristic that measures the degree of linear correlation between X and Y in a random variable, Its range of value is [-1,1]. The greater the |r| value, the higher the degree of linear correlation between variables; The closer the |r| value is to 0, the lower the degree of linear correlation between variables. Generally can be divided into three grades : |r|