Subjective quality assessment database of HDR images compressed with JPEG XT Pavel Korshunov∗ , Philippe Hanhart∗ , Thomas Richter† , Alessandro Artusi‡ , Rafal Mantiuk§ , Touradj Ebrahimi∗ ∗ Multimedia
Signal Processing Group (MMSPG), EPFL Email: {pavel.korshunov,philippe.hanhart,touradj.ebrahimi}@epfl.ch † RUS Computing Center, University of Stuttgart Email:
[email protected] ‡ Universitat de Girona (UdG) Email:
[email protected] § Bangor University Email:
[email protected] Abstract—Recent advances in high dynamic range (HDR) capturing and display technologies attracted a lot of interest to HDR imaging. Many issues that are considered as being resolved for conventional low dynamic range (LDR) images pose new challenges in HDR context. One such issue is a lack of standards for HDR image compression. Another is the limited availability of suitable image datasets that are suitable for studying and evaluation of HDR image compression. In this paper, we address this problem by creating a publicly available dataset of 20 HDR images and corresponding versions compressed at four different bit rates with three profiles of the upcoming JPEG XT standard for HDR image compression. The images cover different scenes, dynamic ranges, and acquisition methods (fusion from several exposures, frame of an HDR video, and CGI generated images). The dataset also includes Mean Opinion Scores (MOS) for each compressed version of the images obtained from extensive subjective experiments using SIM2 HDR monitor. Keywords—Dataset, HDR images, JPEG XT, compression, subjective assessment
I.
I NTRODUCTION
Despite a rapid increase of scientific activities and interests in High Dynamic Range (HDR) imaging, its adoption by industry is rather limited. One of the reasons is the lack of a widely accepted standard for HDR image coding that can be seamlessly integrated into existing products and applications. Once an HDR image coding standard is developed, we face the lack of publicly available HDR image datasets that would cover typical use cases and allow thorough evaluation of the various HDR coding schemes. To resolve the first problem, in 2012, the JPEG Committee formally known as ISO/IEC JTC1/SC29/WG1, issued a “call for proposals”, which led to initiation of JPEG XT, a JPEG backward compatible standard for HDR image compression. An important feature of the standard is the possibility for any legacy JPEG decoder to be able to recover a Low Dynamic Range (LDR) version of the coded HDR image, resulting in a two-layer design of a base LDR and an extension codestream. Another important feature is that both base and extension codestreams use legacy JPEG compression tools to ease the implementation of standard on the basis of the existing hardware and software.
To resolve the second problem, this paper proposes a publicly available dataset of 20 HDR images, covering typical use cases and acquisition methods, including fusion from several images with different exposures (pfstools1 [1] and HDR ToolBox2 [2] were used), frames from HDR video, and CGI images. Some of the original images were taken from other public datasets, including Fairchild3 , HdM-HDR20144 [3], and EPFL’s HDR-Eye5 datasets, but the HDR images were re-generated and then adapted (resized, cropped, and tone-mapped using display-adaptive tone-mapping operator) to SIM2 HDR monitor. The dataset provides compressed versions of the display-adapted HDR images by three JPEG XT profiles, referred to as profiles A, B, and C. The encoding parameters of the compressed images were carefully selected by the expert viewers using SIM2 HDR monitor to ensure four different bit rate levels similar for the three profiles. The dataset also includes the MOS values obtained from the subjective evaluation of HDR images compressed using three profiles, which was conducted in a specialized test laboratory using Double Stimulus Impairment Scale (DSIS) methodology and 24 na¨ıve subjects. The proposed dataset, to the best of our knowledge, is the most extensive public dataset of HDR images compressed with all three profiles of JPEG XT and with the corresponding MOS values. The dataset (original and compressed HDR images with corresponding subjective scores) can be downloaded from MMSPG webpage6 . The dataset can be used in the following types of studies: •
Benchmarking objective metrics using subjective data for compressed HDR images
•
Development of new HDR metrics
•
Cross-lab evaluations and investigation of parameters (methodology, lighting conditions, monitor, etc.) influencing perceived quality
1 http://pfstools.sourceforge.net 2 https://www.github.com/banterle/HDR
Toolbox
3 http://www.rit-mcsl.org/fairchild/HDR.html 4 https://hdr-2014.hdm-stuttgart.de 5 http://mmspg.epfl.ch/hdr-eye 6 http://mmspg.epfl.ch/jpegxt-hdr
II.
R ELATED W ORK
As in many standards, JPEG XT profiles constraint the choices of coding parameters and functional blocks allowed in a codestream conforming to such profiles. What is common to all JPEG XT profiles is that they all take into account the nonlinearity of the human visual system (HVS) and represent the compressed images as a combination of base layer (a low dynamic version of the HDR image that can be viewed on conventional displays) and extension layer (the ‘difference’ between original HDR images and the base layer). In profile A, the HDR image is represented as a product of a luminance scale and a base image after inverse gamma correction. Profile B follows a different strategy by splitting the image along the luminance axis into “overexposed” areas and LDR areas. The overall image is then, in general, represented as the quotient of base layer and an extension layer. Profile C employs a sum to merge base and extension images. In addition, it implements a global inverse tone-mapping procedure that approximates the (possibly local) tone-mapping operator (TMO) that was used to create LDR image, similar to [4]. The extension is encoded in the logarithmic domain directly, avoiding an additional transformation. A few studies appeared in 2014 that evaluated the performance JPEG XT to various degrees. The work by Pinheiro et al. [5] compared four tone-mapping operators in how they affect performance of three profiles of JPEG XT, when used to generate the base layer of a compressed image. This evaluation demonstrates the sensitivity of the compression results to the choice of the tone-mapping operator in the base layer and showed that profiles perform consistently at different bit rates when Signal-to-Noise Ratio (SNR) and Feature SIMilarity (FSIM) metrics were used for measurements. Other studies were mostly limited to the performance evaluation of only one of the three available profiles in JPEG XT [6], [7]. The work by Mantel et al. [6] presented a subjective and objective evaluation for profile C. The objective grades were compared to subjective scores concluding that the Mean Relative Square Error (MRSE) metric provides best prediction performance. The authors of [7] investigated the correlation between thirteen well known full-reference metrics and perceived quality of compressed HDR content. Their evaluation was performed only on profile A of JPEG XT. In contrast to [6] their results showed that commonly used metrics, e.g., Peak SNR (PSNR), Structural SIMilarity (SSIM), and Multi-Scale SSIM (MSSSIM) are unreliable in prediction of perceived quality of HDR content. They concluded that two metrics, HDR-VDP-2 and FSIM, predicted the human perception of visual quality reasonably well. The study by Valenzise et al. [8] compared the performance of three objective metrics, i.e., HDR Visual Difference Predictor (HDR-VDP), PSNR, and SSIM, when considering HDR images compressed using one of the profiles of JPEG XT. The results of this study showed that simpler metrics can be effectively employed to assess image fidelity for applications such as HDR image compression. The main limitation of these three studies is in the small number of images used in their experiments, which was limited to five or six contents. Also, a proper adaptation of the contents to the HDR display was not considered. In this paper, in contrast to the previous work, we present a larger image dataset (adapted to the dynamic range of SIM2 HDR monitor) that
can be used for objective and subjective evaluations for all coding profiles of JPEG XT. We also provide MOS scores from subjective evaluation conducted using SIM2 HDR monitor. To the best of our knowledge, the proposed dataset is the most extensive public dataset of HDR images compressed with all three profiles of JPEG XT and with corresponding MOS values. III.
DATABASE CREATION
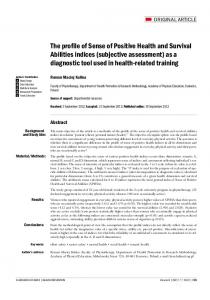
The challenge of testing backward-compatible HDR compression is that the compression performance does not depend only on a single quality control parameter, but also on the quality settings for the base layer and on the choice of tone-mapping operator, which produces this layer. To fully understand the implications of those parameters on perceptive viewing, a practical set of testing conditions was used in a subjective experiment (Section IV). A. Image Selection A set of 20 HDR images with resolutions varying from full HD (1920 × 1080) to larger than 4K (6032 × 4018) were selected (see Figure1 for display-adapted versions). The dataset contains scenes with architecture, landscapes, and portraits. Most of the images were carefully selected from two publicly available datasets: Fairchild’s HDR Photographic Survey3 and HDR-Eye dataset of HDR images5 . In addition, frames extracted from HDR video and computer generated images were added to the dataset. Then, the images were processed for subjective evaluation as follows. Images were adjusted for a SIM2 HDR monitor. Images were first cropped and scaled by a factor of two with a bilinear filter to fit their size to 944 × 1080 for side-by-side subjective experiments (details in Section IV), and then tonemapped using display-adaptive TMO [9] to map the relative radiance representation of the images to an absolute radiance and color space of SIM2 HDR monitor. The regions to crop were selected by expert viewers in such a way that cropped versions were representative of the quality and the dynamic range of original images. Downscaling together with cropping approach was selected as a compromise, so that a meaningful part of an image can be shown on the SIM2 HDR monitor. Figure 1 shows tone-mapped versions of images in the dataset and Table I presents different dynamic range and key [10] characteristics of these images. The key is in the range [0, 1] and gives a measure of the overall brightness key =
log Lavg − log Lmin log Lmax − log Lmin
(1)
where Lmin , Lmax , and Lavg are the minimum, maximum, and average luminance values, respectively, computed after excluding 1% of darkest and lightest pixels. B. Profiles Configuration A common configuration for all tests in this paper has been chosen to ensure a fair comparison of profiles and to allow comparable evaluation results. For this purpose, the base layer always uses 4:2:0 chroma-subsampling, as it is traditionally employed in JPEG compression. To allow optimal quality, we decided to enforce 4:4:4, i.e., no chroma-subsampling, for
(a) BloomingGorse2∗
(b) DevilsBathtub∗
(c) MtRushmore2∗
(d) set24
(e) set70
(f) showgirl
(g) sintel†
(h) 507∗
(i) CanadianFalls∗
(j) dragon#
(k) HancockKitchIn∗
(l) LabTypewriter∗
(m) LasVegasStore∗
(n) McKeesPub∗
(o) set18
(p) set22
(q) set23
(r) set31
(s) set33
(t) WillyDesk∗
Fig. 1. Display-adapted images of the dataset. The reinhard02 TMO was used for images from (a) to (g) and the mantiuk06 TMO was used for the remaining images. Copyrights: ∗ 2006-2007 Mark D. Fairchild, † Blender Foundation | www.sintel.org, under Creative Commons BY, # Mark Evans, under Creative Commons BY.
the extension layer. All implementations enabled optimized Huffman coding, i.e., used a two-pass encoding to identify the optimal Huffman alphabet. Profile C in particular uses a 12 bit extension (8 bit legacy coding plus four refinement bits) for which no example Huffman table has been listed in the legacy JPEG; it should be noted, however, that the rate-distortion TABLE I.
C HARACTERISTICS OF HDR IMAGES FROM THE DATASET. 507 AirBellowsGap BloomingGorse2 CanadianFalls DevilsBathtub dragon HancockKitchenInside LabTypewriter LasVegasStore McKeesPub MtRushmore2 PaulBunyan set18 set22 set23 set24 set31 set33 set70 showgirl sintel WillyDesk min max mean median
Dynamic range 4.097 4.311 2.336 2.175 2.886 4.386 4.263 4.316 4.131 3.943 4.082 2.458 4.376 3.162 3.359 3.862 4.118 4.344 3.441 4.369 3.195 4.284 2.175 4.386 3.722 4.089
Key 0.743 0.768 0.748 0.729 0.621 0.766 0.697 0.733 0.636 0.713 0.713 0.702 0.724 0.766 0.764 0.778 0.678 0.698 0.735 0.723 0.781 0.777 0.621 0.781 0.727 0.731
curve of the 8-bit and 12-bit extension mode lie exactly on each other as quantization loss dominates, except that the 12bit mode allows profile C in particular to extend this curve towards higher bit rates and higher qualities, allowing scalable lossy to lossless coding. Despite these choices, we imposed no further restrictions or requirements on the encoder, though requested experts involved in their design to supply their recommendations for optimal coding performance. Like many other standards, JPEG XT itself does not specify the encoder and only imposes the requirement that it should create a syntactically correct codestream that describes the image with suitable precision. C. Bit Rate Selection Test images were created using the following procedure: •
Based on expert viewing on HDR monitor, for each of the 20 images, a tone-mapping algorithm was chosen out of 5 considered candidates (each TMO was applied with default parameters): a simple gamma-based algorithm, global logarithmic operator [11], global version of photographic operator reinhard02 [12], operator optimized for encoding [13] and local operator with strong contrast enhancement mantiuk06 [14]. For 7 images, reinhard02 TMO was selected and for 13 images mantiuk06 was selected as producing the best visual quality for these images.
for all background walls and curtains, and the ambient illumination did not directly reflect off of the monitor. During the experiment, the background luminance behind the monitor was set to 20 lx. To display the test stimuli, a full HD 47” SIM2 HDR monitor with individually controlled LED backlight modulation, capable of displaying content with luminance values ranging from 0.001 to 4000 cd/m2 , was used. Prior to subjective tests, following a warm-up phase of an hour, a color calibration of the HDR display was performed using the software provided by SIM2. The red, green, and blue primaries were measured for white set to 1400 cd/m2 level since the measurement probe (X-Rite i1Display Pro) is limited to a maximum value of 2000 cd/m2 .
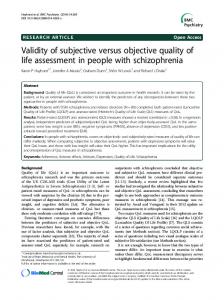
Fig. 2. Three observers assessing a test image relative to a reference image shown on the SIM2 HDR monitor, in viewing conditions conforming to the ITU-R BT.500-13 recommendation.
In every session, three subjects assessed the displayed test images simultaneously, as illustrated in Figure 2. They were seated in an arc configuration, at a constant distance of 3.2 times the picture height, as suggested in [16]. A. Test Methodology
•
Since JPEG XT images consist of a base and an extension layer, the overall bit rate has to be allocated to each of the layers. The bit rate allocation can be done differently and the strategy used can affect the performance of the profiles. To keep the overall number of samples small enough to allow subjective evaluation, for this study, we used the following allocation to generate codestreams.
The double-stimulus impairment scale (DSIS) Variant I methodology [15] was selected, since this methodology is recommended for evaluating impairments and is typically used to evaluate compression algorithms. A five-grade impairment scale (1: very annoying, 2: annoying, 3: slightly annoying, 4: perceptible, but not annoying, 5: imperceptible) was used, since scales with a finer granularity are harder to handle for subjects and do not necessarily provide better resolving power.
•
We first fix for each image the bit rate of the base layer codestream. For the tone-mapped version of the image, the JPEG quality parameter was set to 4 different values such that they produce 4 different visual qualities based on the expert viewing: very annoying, annoying, slightly annoying, and imperceptible (see Section IV-A).
•
The quality of the extension layer was then chosen for each profile in such a way that it would produce the same bit rate as that of the base layer. Such strategy resulted in a total of 12 (4 bit rates × 3 profiles) compressed versions for each HDR image. Fixing the bit rate of the extension layer instead of its quality level ensured that profiles produced images with similar bit rates but potentially different perceptual qualities, which led to a fairer subjective evaluation of performance for each profile.
Two images (see examples in Figure 1) were presented in side-by-side fashion to reduce visual memory efforts by subjects. Due to the availability of only one full HD HDR monitor, each image was cropped and scaled to 944 × 1080 pixels with 32 pixels of black border separating the two images. One of the two images was always the reference (unimpaired) image. The other was the test image, which is a reconstructed version of the reference.
•
A visual verification was then performed on SIM2 HDR monitor to confirm that 12 compressed versions of each HDR image cover the full quality scale from very annoying to imperceptible. IV.
S UBJECTIVE E VALUATIONS
Subjective evaluations were conducted at MMSPG test laboratory, which fulfills the recommendations for subjective evaluation of visual data issued by ITU-R [15]. The laboratory setup ensures the reproducibility of subjective test results by avoiding unintended influence of external factors. In particular, the laboratory is equipped with a controlled lighting system with a 6500 K color temperature, a mid gray color is used
To reduce the effect of order of images on the screen, the participants were divided into two groups: the left image was always the reference image for the first group, whereas the right image was always the reference image for the second group. After the presentation of each pair of images, a sixsecond voting time followed. Subjects were asked to rate the impairments of the test images in relation to the reference image. B. Test Design Before the experiment, a consent form was handed to subjects for signature and oral instructions were provided to explain their tasks. Additionally, a training session was organized allowing subjects to familiarize with the test procedure. For this purpose two images outside of the dataset were used. Five samples were manually selected by expert viewers for each image so that the quality of samples was representative of the rating scale. Since the total number of test samples was too large for a single test session, the overall experiment was split into 3 sessions of approximately 16 minutes each. Between the sessions, subjects took a 15-minute break. The test material
Fig. 3.
Ratings distribution.
Fig. 4.
MOS values distribution.
was randomly distributed over the test sessions. To reduce contextual effects, the order of displayed stimuli was randomized applying different permutation for each group of subjects, whereas the same content was never shown consecutively. A total of 24 na¨ıve subjects (12 females and 12 males) took part in the experiments. Subjects were aged between 18 and 30 years old with an average of 22.1. All subjects were screened for correct visual acuity and color vision using Snellen and Ishihara charts, respectively. C. Statistical Analysis The subjective scores were processed by first detecting and removing subjects whose scores deviated strongly from others. The outlier detection was applied to the set of results obtained from the 24 subjects and performed according to the guidelines described in Section 2.3.1 of Annex 2 of [15]. In this study, two outliers were detected. Then, the Mean Opinion Score (MOS) was computed for each test stimulus as the mean across scores by valid subjects, as well as associated 95% confidence interval (CI), assuming a Student’s t-distribution of the scores. The computed scores are included in the dataset for each of the compressed HDR images. V.
Fig. 5. Standard deviation of subjective ratings versus MOS. The red lines represent the respective medians. Points are colored according to the bit rate of the corresponding compressed HDR image.
A NALYSIS OF RESULTS
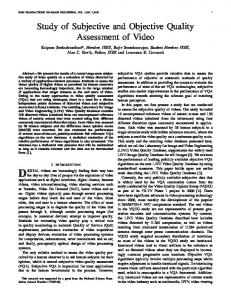
It is important that the MOS scores, which are provided in the dataset for further studies and analysis, are representative of the rating scale and show fair distribution of values. Figures 3–6 show different characteristics of the obtained subjective scores. Figure 3 demonstrates that subjects’ answers are well distributed within the rating scale and across profiles. As it can be observed in Figure 4, MOS values reflect the subjects perception fairly with enough MOS samples for each meaningful value range. Figure 5 shows that subjective rating deviations do not exceed one rating point. Also, median value of the standard deviations is 0.62, which is about half of the rating scale step, and it leads to relatively small CIs, demonstrating that individual ratings are consistent across subjects. Median for the MOS values is about about 3.4, which
Fig. 6. MOS distribution for each content. Whiskers are from minimum to maximum.
is close to the middle of the rating scale with a slight skew towards the top of the scale. Figure 6 presents the distribution of MOS values for each evaluated content. It can be noted that, for most contents, MOS values cover almost the whole range from very annoying to imperceptible. While for some contents (e.g., DevilsBathtub, set18, and showgirl) the MOS values are clustered nearer the extreme ends of the scale, Figure 6 shows that there are still enough of MOS values to cover the whole scale range. Such even distribution of MOS values means that the dataset is well-balanced overall, both in terms of quality distribution across the rating scale and across contents, which is a desirable feature for designing and benchmarking objective quality metrics. While analyzing images and the corresponding subjective results, it was noticed that profile B had an implementation bug that led to additional encoding artifacts in a couple of images (‘showgirl’ and ‘sintel’). The bug has been corrected in the subsequent version of the profile B. VI.
R EFERENCES [1]
R. Mantiuk, G. Krawczyk, R. Mantiuk, and H.-P. Seidel, “High Dynamic Range Imaging Pipeline: Perception-motivated Representation of Visual Content,” in Proc. SPIE 6492, Human Vision and Electronic Imaging XII, Feb. 2007. [2] F. Banterle, A. Artusi, K. Debattista, and A. Chalmers, Advanced High Dynamic Range Imaging: Theory and Practice. Natick, MA, USA: AK Peters (CRC Press), 2011. [3] J. Froehlich, S. Grandinetti, B. Eberhardt, S. Walter, A. Schilling, and H. Brendel, “Creating cinematic wide gamut HDR-video for the evaluation of tone mapping operators and HDR-displays,” in Proc. SPIE 9023, Digital Photography X, Mar. 2014. [4]
[5]
[6]
C ONCLUSION [7]
In this paper, we have presented a publicly available dataset of HDR images, covering typical use cases and acquisition methods. The images were tone-mapped using a displayadaptive TMO to look natural on SIM2 HDR monitor. The dataset provides compressed versions of the display-adapted HDR images by three JPEG XT profiles at four different bit rates. MOS values from an extensive subjective evaluation are also provided for each compressed image. Several presented MOS characteristics demonstrated the validity of the subjective results. The dataset (original and compressed HDR images with provided quality parameters, bit rate, and the corresponding subjective scores) can be downloaded from MMSPG website6 .
[8]
[9] [10] [11]
[12]
ACKNOWLEDGMENTS [13]
This work has been performed in the framework of Swiss SERI project “Compression and Evaluation of High Dynamic Range Image and Video”, COST IC1005 The digital capture, storage, transmission and display of real-world lighting HDRi, FP7 EC EUROSTAR TOFuTV Project, Spanish Ministry of Science and Innovation Subprogramme Ramon y Cajal RYC2011-09372, TIN2013-47276-C6-1-R, and Catalan Government 2014 SGR 1232. The authors would like to thank Massimiliano Agostinelli and Arkady Ten for providing software and recommendations regarding the settings of the different profiles.
[14]
[15]
[16]
R. Mantiuk, A. Efremov, K. Myszkowski, and H.-P. Seidel, “Backward Compatible High Dynamic Range MPEG Video Compression,” ACM Trans. Graph., vol. 25, no. 3, pp. 713–723, July 2006. A. Pinheiro, K. Fliegel, P. Korshunov, L. Krasula, M. Bernardo, M. Pereira, and T. Ebrahimi, “Performance evaluation of the emerging JPEG XT image compression standard,” in IEEE International Workshop on Multimedia Signal Processing (MMSP), 2014. C. Mantel, S. Ferchiu, and S. Forchhammer, “Comparing subjective and objective quality assessment of HDR images compressed with JPEG XT,” in IEEE International Workshop on Multimedia Signal Processing (MMSP), Sept. 2014. P. Hanhart, M. Bernardo, P. Korshunov, M. Pereira, A. Pinheiro, and T. Ebrahimi, “HDR image compression: a new challenge for objective quality metrics,” in International Workshop on Quality of Multimedia Experience (QoMEX), Sept. 2014. G. Valenzise, F. De Simone, P. Lauga, and F. Dufaux, “Performance evaluation of objective quality metrics for HDR image compression,” in Proc. SPIE 9217, Applications of Digital Image Processing XXXVII, Aug. 2014. R. Mantiuk, S. Daly, and L. Kerofsky, “Display adaptive tone mapping,” ACM Trans. Graph., vol. 27, no. 3, pp. 68:1–68:10, Aug. 2008. A. O. Aky¨uz and E. Reinhard, “Color appearance in high-dynamicrange imaging,” SPIE J. Electron. Imaging, vol. 15, no. 3, Sept. 2006. F. Drago, K. Myszkowski, T. Annen, and N. Chiba, “Adaptive Logarithmic Mapping For Displaying High Contrast Scenes,” Computer Graphics Forum, vol. 22, no. 3, pp. 419–426, Sept. 2003. E. Reinhard, M. Stark, P. Shirley, and J. Ferwerda, “Photographic tone reproduction for digital images,” ACM Trans. on Graph., vol. 21, no. 3, p. 267, July 2002. Z. Mai, H. Mansour, R. Mantiuk, P. Nasiopoulos, R. Ward, and W. Heidrich, “Optimizing a tone curve for backward-compatible high dynamic range image and video compression,” IEEE Trans. Image Processing, vol. 20, no. 6, pp. 1558–1571, June 2011. R. Mantiuk, K. Myszkowski, and H. Seidel, “A perceptual framework for contrast processing of high dynamic range images,” ACM Trans. Applied Perception, vol. 3, no. 3, pp. 286–308, July 2006. ITU-R BT.500-13, “Methodology for the subjective assessment of the quality of television pictures,” International Telecommunication Union, Jan. 2012. ITU-R BT.2022, “General viewing conditions for subjective assessment of quality of SDTV and HDTV television pictures on flat panel displays,” International Telecommunication Union, Aug. 2012.