Subscription Summarization: A New Paradigm for Efficient Publish/Subscribe Systems 1
Peter Triantafillou
Andreas Economides
Research Academic Computer Technology Institute, and University of Patras Patra, 26500, Greece
[email protected]
Department of Electronic and Computer Engineering Technical University of Crete Chania, 73100, Greece
[email protected]
Abstract—We contribute a new paradigm for publish/subscribe systems. It is centered on the novel notion of subscription summarization. We first present the summarization structures for a broker’s subscriptions and accompanying algorithms, which operate on the summary structures to match incoming events to the brokers with relevant subscriptions and for the maintenance of subscriptions in the face of updates. Second, we present novel algorithms for efficiently propagating subscription summaries to brokers. Finally, we present a novel algorithm for the efficient distributed processing of incoming events, utilizing the propagated subscription summaries to route the events to brokers with matched subscriptions. We study the performance of our contributions, comparing them against a baseline approach and against corresponding techniques employed in a well-known event-based distributed system. Our results show the significant performance gains introduced for both the subscription propagation and distributed event processing tasks.
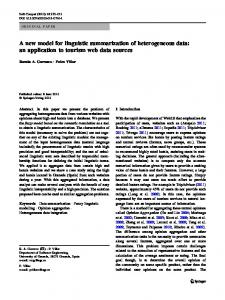
the corresponding consumers. The architecture of a pub/sub system (figure 1) consists of: • One or more Event Sources (ES) / Producers. An Event Source produces events, say, in response to changes to a real world variable that it monitors. • An Event Brokering Network (EBN). The events are published to the Event Brokering Network, which matches them against a set of subscriptions, submitted by users (consumers) in the system.
• One or more Event Displayers (ED) / Consumers. If a
user’s subscription matches an event, it is forwarded to the Event Displayer for that user. The Event Displayer is responsible for alerting the user.
Keywords— event-based systems; publish/subscribe systems; subscription summaries; event processing; routing, and filtering.
I. INTRODUCTION Event-based, publish/subscribe, systems are receiving increasingly greater attention as a means to develop largescale data retrieval and dissemination systems that enable personalized data delivery. In these systems a different model is adopted for finding and delivering interesting distributed information to the distributed users: a user declares his interests and receives the appropriate information/events, as the events matching these interests take place. Such a system gives users the ability to receive information dynamically at the time it becomes available. Publish/Subscribe (pub/sub) systems therefore connect information providers and consumers delivering personalized information. System Architecture A pub/sub system is comprised of three main entities. A consumer, who subscribes his interests to the system, a provider, who publishes events and the pub/sub infrastructure which has the responsibilities to (i) match each event to all related subscriptions and (ii) to deliver the matching events to
1
Figure 1. A distributed architecture of a pub/sub system.
The paper is organized as follows. Section II briefly reviews related work, defines the research problem, and outlines our contributions. We develop the summary data structures and the associated algorithms in section III. Section IV presents the notion of multi-broker summaries, their maintenance, the associated algorithm for propagating subscriptions among the brokers of the system, and algorithms for the distributed event processing, routing events to interested brokers. In section V we present our performance study and the results showing the significant benefits our approach introduces. Section VI concludes the paper.
This research was supported by the European Commission’s IST/FET DBGLOBE project and Integrated Project DELIS.
II.
RESEARCH PERSPECTIVE
A. An Overview of Related Work The first pub/sub systems were based on the concepts of group (also known as channel-based systems) or subject (a.k.a. topic-based systems). Channel-based systems [12], [19] categorize events into pre-defined groups. Users subscribe to the groups of interest and receive all events for these groups. In subject-based systems [7], [14] each event is enhanced with a tag describing its subject. Subscribers can declare their interests about event subjects flexibly using string patterns. In the content-based model [3], [5], subscribers use flexible querying languages to declare their interests with respect to the contents of the events. For example, such a query could be "give me the price of stock A when the price of stock B is less than X". A slightly different model than this is the "contentbased with patterns" model [6], [13], with extra functionality on expressing user interests. This area has enjoyed considerable attention. Examples of this research’s results are the Gryphon [1], [2], Siena [6], Jedi [7], Le Subscribe [8], Ready [10], Rebecca [11], Hermes [15], and Elvin [17] systems. In the commercial world, several systems have been implemented, with some prominent examples being the CORBA Event service [12], CORBA Notification service [13], iBus [18], Jini [19], Tibco [20] and Vitria [22]. Event and Subscription Types We employ the event and subscription schemata found in the literature [6], (our paradigm can also be used with any other schema with similar attribute types and operators). Event Schema The Event Schema of this model is an untyped set of typed attributes. Each attribute consists of a type, a name and a value. The type of an attribute belongs to a predefined set of primitive data types commonly found in most programming languages. The attribute’s name is a string, while the value can be in any range defined by the type. The whole structure of type – name – value for all attributes constitutes the event. Event 1 Type
Name
Value
string string date float integer float float
exchange symbol when price volume high Low
= NYSE = OTE = Jul 1 12:05:25 EET 2003 = 8.40 = 132700 = 8.80 = 8.22
Figure 2: An event example.
Subscription Schema The subscription schema is more general, allowing for expressing a rich set of subscriptions, containing all interesting subscription-attribute data types (such as integers, strings, etc.) and all interesting operators (=, ≠, , prefix ">*", suffix "*130000". Thus, we get the following subscription-id lists: exchange → S1, symbol → S1, S2, price → S1, volume → S2. The unique subscriptions in this example are S1 and S2 with corresponding counters 3 and 2 respectively. First, the algorithm examines part c3 of S1 and finds that this subscription is comprised of 3 attributes. So, S1 is kept in order to inform broker A about the match. However, S2’s c3 is comprised of 4 attributes while its counter is equal to 2, so the event examined is of no interest to the corresponding subscriber. Because there is at least one subscription that satisfies the event, broker B sends the specific event to A with all the subscription ids (S1) that are matched by the event. ■ D. Maintaing the Per-broker Summary Structures The maintenance is required to support two operations, the addition and the deletion of a subscription. For both operations, there are two different scenarios.
The first scenario represents the case when a constraint from a subscription which is already covered (subsumed) by another constraint, is added (deleted) to (from) a broker. In this case, the subscription id to which the constraint belongs must be added (removed), to (from) the corresponding id list. When the first (last) subscription id is added (removed) then a row is also added (deleted). The second scenario represents the case when a constraint from a subscription, which is currently the most general of a row, is added (deleted) to (from) a broker. In the case of addition, the broker checks if the new one covers more than one existing constraints. If it does, then the broker merges all the covered rows and their corresponding id lists into a new one. In the case of a deletion, the broker splits the remaining constraints belonging to the same subscription id list to one or more new rows according to the generalization that the remaining constraints have. An easy way to keep track of the generalizations of constraints and their subscriptions, is to maintain a tree structure, which we call the attribute-constraint generalization tree, ACGT, for each row of SACS/AACS. Each tree node represents a constraint and the id(s) of subscriptions being covered by this constraint, which has been generalized. The children of a node in ACGT are the next most general constraints of the parent and the ids of their subscriptions. Example 2. To better understand the structure and the usage of the ACGT consider a broker with the following four subscriptions with each one including the string attribute symbol and the arithmetic attribute price. S1 OTE 8.50
Symbol Price
S2 OTER 8.55
S3 >* OTE 8.45 – 8.60
S4 >* T 8.60 – 8.70
The broker creates for each attribute the necessary ACGTs as are showed in the figures below. Because in both attributes there is a constraint which covers all the others, only one ACGT is needed for each attribute. ■ >* T → S4
>* OTE → S3
OTE → S1
OTER → S2
Figure 7: The ACGT of attribute symbol. 8.45 – 8.70 → S3,
8.45 – 8.60
8.5
8.60 – 8.70
8.55
Figure 8: The ACGT of attribute price.
When the most general constraint of a row is being deleted, that is the root node of the corresponding tree, children of the root become the roots in respective trees. The number of the new trees corresponds to the number of the new rows formed in the SACS/AACS structure. The opposite is done when a new most general constraint is added, merging tree structures and rows of SACS/AACS. E. Discussion The proposed paradigm differs conceptually from all related work in that it is "subscription-summary-centric", as opposed to being "subscription-centric". In our approach the entity "subscription" does not exist; it is replaced by the notion of subscription summaries. Subscription summaries embody two novel features, introducing definite advantages. First, they allow and exploit generalizations of the same attributes of different subscriptions. Generalizations are allowed and exploited elsewhere in the literature as well (e.g., by Siena’s subsumption mechanism) [6]; however, in Siena, subsumption occurs at the level of subscriptions whereas, in our paradigm, subsumptions occur at the level of attributes. Note that in order for a subscription to be subsumed by another, each of the attribute constraints of the former must be subsumed by the corresponding attribute constraint of the latter. Hence, it follows that attribute-constraint subsumption occurs much more frequently than subscription subsumption. Thus, this feature may have great performance benefits. Second, our summaries may create generalized attribute constraints, which may not correspond to the constraints specified by any individual subscription. See for example the merging of constraints for attribute price of S3 and S4 in the example of section d, or the merging of constraints for the attribute symbol of S4 and of (a new one), S5, with (symbol: *< T) into a virtual constraint (symbol: *T*). Note that this is also a unique feature. We stress that the above two features result in faster filtering and matching of incoming events. Events of no interest are identified very swiftly, by the failed matches of each event attribute value against the generalized attribute constraints in the summaries. This yields significant speedups compared to matching the attributes of the event against the attribute constraints of all subscriptions. Events of interest are also swiftly identified by the successful matching of the event’s attributes against the generalized attribute constraints in the summary. At this point, the subscription id list of each matched generalized constraint identifies which subset of all subscriptions should be further checked for a match. This performance behavior is very important, since it is expected that events will greatly outnumber subscriptions. Finally, further to the faster matching and filtering of events we emphasize that the proposed subscription summaries introduce significant network bandwidth and storage requirement benefits, since it is the summarized subscriptions that are communicated between the brokers during the propagation of subscriptions. The following section will contribute algorithms that extend the above benefits
during the subscription propagation and the distributed event processing phases. IV.
MULTI-BROKER SUBSCRIPTION SUMMARIES, SUMMARY PROPAGATION, AND DISTRIBUTED EVENT PROCESSING
A. Overview of the Approach How to construct multi-broker summaries Observe that once the subscription summaries of a set of brokers have been received at some broker B, it is straightforward for B to merge all the received summaries with its own. Values for the same string and numeric attributes are simply merged by taking the union of the corresponding sets. Also, the merging of supporting structures like arithmetic ranges is also straightforward. Because of space limitation a detailed discussion for maintaining the summaries is present in the full version of this paper2. How to filter and route events Brokers develop multi-broker subscription summaries from their neighbors. Each broker B1 creates as before its own summary. This summary is then propagated to its neighbor(s). Each such neighbor, Bi, using the same structures, merges its own subscription summary with that received from B1 (and from all of its other neighbors) and further forwards the merged (multi-broker) summary to its neighbor(s). When an event arrives at a broker, B, the filtering algorithm runs against the multi-broker subscription summaries received from B’s neighbors. Note that, in addition to the benefits owing to the significantly faster matching/filtering of events at each broker, the actual network bandwidth required to exchange subscriptions among brokers is also reduced. The whole process is logically divided into two phases. The first encompasses the subscription summary propagation, and the second phase encompasses the distributed processing of events at brokers. B. Subscription Summary Propagation The subscription summaries of brokers are propagated to the other brokers in the system, exploiting the underlying broker (overlay) topology. This phase starts at specific points of time (e.g., periodically) engaging the brokers. The process includes a number of iterations equal to the maximum degree (defined as the maximum number of neighbors a broker has) among all brokers. At each iteration, each broker having a degree equal to the number of the current iteration, constructs a merged subscription summary, which includes its own and all subscription summaries that it received in the previous iterations from its neighbors. In addition, with each merged summary, the broker associates the set Merged_Brokers, which consists of the ids of the brokers whose subscriptions are included in the merged summary. If no summaries were previously received (that is the case in the first iteration) then 2
http:// www.ceid.upatras.gr/faculty/peter/papers/subsum.pdf
the constructed multi-broker summary contains only this broker’s subscriptions and the set Merged_Brokers contains only this broker’s own id. After that, each broker sends the merged summary and its Merged_Brokers set to a neighbor with which it has not communicated in any of the previous iterations (i.e., the neighboring brokers with equal or higher degree). If a broker has two or more such neighbors, then only one is selected (preferably the one with the smallest degree) for sending the summaries. Also, each broker stores the updated value of Merged_Brokers. The propagation algorithm pseudocode is given below. For i=1 to MAX_DEGREE Each node of degree i: 1. Merges its summary with all received summaries and updates the set Merged_Brokers. 2. Sends the merged summary and the set Merged_Brokers to a selected neighbor with equal or higher degree. End Algorithm 2: Subscription Summary Propagation.
C. Distributed Event Processing: Routing and Filtering When an event arrives at a broker, B, the broker need only examine the overall merged subscription summary that it keeps, checking for a match, using the matching algorithm of section III.C. When a match is detected, the broker routes the event to the broker(s) that own the matched subscription(s), using the field c1 of each matched subscription id. In parallel, the broker also updates BROCLIe (Broker Check List for a specific event e) carried by each event. This list shows the brokers whose subscriptions have already been examined for a match against this event. This list is maintained by having each broker, receiving the event, add to this list the value of the set Merged_Brokers (i.e., its own id as well as the ids of all brokers whose subscriptions have been included in the merged summaries B has received). If BROCLIe does not contain all brokers, the search for a match continues, forwarding the event. The pseudocode for the distributed event-processing algorithm follows: For each incoming event at a broker do 1.Check the local merged summary for a match 2.Update the list BROCLIe 3.If a match is found then Send the event to the matched broker 4.If BROCLIe does not contain all brokers then Find the broker with the highest degree whose id is not in BROCLIe and send it the event Algorithm 3: Event routing and filtering.
There are a number of alternatives for selecting a broker to which to forward the event, which enjoy comparative performance advantages which trade-off event processing time with load distribution among brokers for matching events. In the alternative presented here, B forwards the event to the broker with the greatest degree, among the brokers whose ids
are not in BROCLIe. It also sends to it the updated BROCLIe. This process is executed at each broker that receives an event together with the BROCLIe and stops when the broker examining the event finds that the BROCLIe list includes all brokers in the system. Example 3. Consider a system with 13 brokers interconnected with the overlay topology shown in figure 9. (A tree topology is used for easier presentation, since the extra edges in a graph complicate the presentation).
V. ANALYSIS OF PERFORMANCE In this section, we present an analysis of the performance of our approach. Our primary performance metrics are (i) the network bandwidth requirements, (ii) the storage requirements for subscriptions and summaries, (iii) the required number of hops between brokers for subscription propagation, and (iv) the number of hops required for the routing of events to matched brokers. The network bandwidth is measured as the size (in bytes) a broker exchanges with all the others. The key parameters are listed in Table I. TABLE I.
Figure 9: An example event routing and filtering.
We can see that the highest degree of a broker is 5 (node 5). In the 1st iteration the brokers 1, 3, 4, 6, 9, 12, and 13 send their subscription summaries to their neighbors. The labels on the edges show the values of the Merged_Brokers set. In the 2nd iteration, brokers of degree two (i.e., brokers 2, 7, and 10), construct a merged summary from their own summaries and the ones received in all previous iterations (if any). In our example, in this iteration broker 2 will create a merged summary from its own summary and the one from broker 1. Subsequently, broker 2 sends the merged summary to broker 5, broker 7 sends its own to 5 (or 8), and broker 10 to 8 (or 11). In the 3rd iteration, brokers 8 and 11 merge the received summaries. Broker 8 will merge its own summary with the summaries received from its neighbors in all previous iterations (i.e., the summaries of brokers 7, 9 and 10). In iteration 4, there is nothing to do because there is no broker of this degree. In the last iteration, broker 5 will merge the summaries from brokers 2, 6, 3, and 4. Phase 1 (the subscription propagation phase) ends at this point. Note here that, finally, broker 5 for example will have knowledge of the summaries of brokers 1 to 6. Suppose now that an event matching brokers 4, 8 and 13, arrives at broker 1. Broker 1 will first check (unsuccessfully) if the event matches its own summary and then will update the BROCLIe list adding itself to it. Then it will forward the event and the updated BROCLIe list to the nearest highest-degree broker, which is not included in BROCLIe. This is broker 5. Broker 5 in turn will check for a match in his merged summaries and will update BROCLIe adding all the brokers from 2 to 6 (broker 1 is already in). The check against the summary sent by broker 4 will be successful and, thus, broker 5 will forward the event to broker 4. Simultaneously, because BROCLIe does not yet include all brokers, broker 5 will send the event with the updated BROCLIe to broker 8 (since 8 is the broker with the greatest degree among those not included in BROCLIe). Broker 8 will find the local match and behave similarly to broker 5 and will forward the event to 11. After the match is found for broker 13, the process will end because 11 will see that all brokers are now included in BROCLIe. ■
PARAMETER DEFINITION.
Symbol
Description
nt
Total number of attribute names in the event/subscription type.
S
Average number of outstanding subscriptions in a broker.
σ nas
Average number of new per-broker arrived subscriptions in each period. Average number of different arithmetic attributes in a subscription of a broker.
nsr
Per arithmetic attribute: number of rows in AACSSR.
ne
Per arithmetic attribute: number of rows in AACSE.
La
Per arithmetic attribute: size of the subscription id list.
nss
Average number of different string attributes in a subscription of a broker.
nr
Per string attribute: number of rows in SACS.
Ls
Per string attribute: size of the subscription id list.
ssv
Average size of a string value (one byte per character).
sst
Storage size type of an arithmetic attribute.
sid
Storage size of a subscription id.
E
Average number of incoming events at a broker.
nae
Average number of different arithmetic attributes in an event.
nse
Average number of different string attributes in an event.
A. The Network Bandwidth Analysis The following equations show the total size (in bytes) for the ‘summarizing’ data structures. We calculate the size of the structure itself plus the size of the subscription ids. Size of the AACS AACS =
∑ ((2 n n as
i =1
sri
)
) (
+ n e × sst i + L a i × sid i
)
(1)
The first part of (1) is for calculating the sizes of the two arrays. Factor 2 is due to the two columns (min, max), needed by each sub-range. The second part is for finding the size needed to store the subscription ids in both arrays. Size of the SACS SACS =
∑ (n n ss
i =1
ri
) (
× ssv + L s i × sid
)
(2)
Tested Topologies
Network Bandwidth Performance We measured the network bandwidth requirements, as the cost for all brokers to propagate their subscriptions in a period. This cost for the baseline approach is measured as (brokers –
100000000 10000000 1000000 100000 10000
0
00
1000 10
Total bandwidth
We have used a number of real and artificial topologies. We show the results (which are similar in all cases) assuming our brokers are organized in an overlay network topology like that of the backbone network of U.S. Cable and Wireless plc [4], having 24 nodes. This topology is representative of the performance of our system when being included in networks such as single-ISP Content Delivery Networks, for example those by Cable and Wireless and AT&T, which number from 20 to 33 backbone nodes. Furthermore, these broker overlay (ISP backbone) networks have the property that the topologies are slowly changing, and when they do, the network nodes can be informed of the new changes. Thus, our subscription id structure does not pose a limitation.
0
1) The Performance of Subscription Propagation
90
Recall, that some of the values for arithmetic and string attributes are subsumed. In arithmetic attributes, all subsumed values fall into the nsr ranges of the attribute. The nonsubsumed values are represented as different values (specified with equality operators outside the ranges). The results for configurations with the other parameter values are similar.
To measure the bandwidth requirements (figure 10) we measured the total bytes sent so that all brokers’ subscriptions are fully propagated. In our approach the algorithm specified in section IV.B is employed, batching σ subscriptions in every period and sending them, as prescribed by the algorithm. For Siena, we followed the description of their approach [6]: for every broker B a minimum spanning tree is formed and the subscriptions are forwarded from neighbor to neighbor from B until they have reached all brokers or until they are subsumed.
0
= 10
80
=4
Ssv
0
sst, sid
70
=2
0
= 10
nsr
60
nt
0
= 0.1, 0.25, 0.5, 0.75, 0.9
50
= 10, …, 1000
Subscription Subsumption probability
0
Σ
40
Values = 1000 (per broker)
0
Symbol S
30
VALUES OF PARAMETERS USED.
For our approach the subscription summary sizes differ between brokers. Brokers that merge summaries received from other brokers, have greater summary sizes. The appropriate size is determined as follows: brokers that merge summaries from n other brokers, appropriately increment the number of distinct values expected to store in the merged summary and define it to be the sum of the distinct values at each of these n brokers. In general, the sizes of the summary data structures that are sent by a broker are based on (i) the value of σ, the new subscriptions received since the last propagation, (ii) the subsumption probability, and (iii) the number of brokers whose summaries are being merged at the sending broker.
0
TABLE II.
In our model, not all brokers have the same subsumption probability; brokers with higher connectivity will enjoy higher probabilities, given the greater number of subscriptions that pass through them. Thus, the stated subsumption probability refers to the maximum probability among brokers. Each broker’s subsumption probability is being determined as the maximum subsumption probability times the fraction of this broker’s degree over the maximum degree.
20
B. Performance Results We have comparatively evaluated our approach against a baseline approach where all brokers broadcast their subscriptions to all, and against the Siena subsumption-based algorithm.. We did not compare against the advertisement mechanism of Siena, since this mechanism can be employed by our system as well and since our goal is to show what performance gains are inherent in our summary-centric approach. table ii presents the parameter values used We assume that all nt appear at least once in some subscription. The ‘average’ subscription or event used in our analysis includes nt/2 attributes, with 40% (60%) being arithmetic (strings). The average size of a subscription/event is 50 bytes.
10
So, the total bandwidth per broker, TB, is equal to the sum of the size of the two data structures (1) and (2).
1) × average numbers of hops (from any broker to any other) × brokers × σ × average size of a subscription. For Siena’s subsumption-based, subscription propagation, we used a varying probability of subsumed subscriptions. In particular, at each broker B, with a probability equal to the subscription subsumption probability, B did not forward each subscription it received to each of its neighbors. This was repeated for all brokers, until each subscription eventually reached all its destinations or was subsumed. With every result we state the corresponding subsumption probability.
10
As in (1), the first part is for calculating the size of the array. The second part is needed for calculating the required space for the lists of the subscription ids.
Average number of subscriptions in each period Subscription Broadcast Siena (Subsumption = 10%) Subscription Summary (Subsumption = 10%) Siena (Subsumption = 90%) Subscription Summary (Subsumption = 90%)
Figure 10: Bandwidth for subscription propagation.
Hop Count Performance Figure 11 presents the number of hops for subscription propagation. Hop-counts reflect the number of brokers involved in the process of subscription propagation. We count as one hop every message that is being sent from a broker to another (regardless of whether the two brokers are neighbors in the overlay topology). With these hop counts we wish to count the number of brokers involved in the operation. We note a significant difference in figure 11 between the two approaches. This difference is due to (i) the fact that our algorithm utilizes the merging of subscription summaries at each broker and (ii) that at each broker our algorithm forwards the merged subscription to only one neighbor. Hence, the propagation of the global knowledge about all brokers’ subscriptions in our approach always requires a number of hops that is smaller than the number of brokers in the system. In Siena every broker propagates received (and own subscriptions) to each neighbor with a probability that depends on the subsumption probability. In the worst case in Siena (subsumption percentage = 0%) each broker will receive the subscriptions of all others (for a total of 24 times 23 hops).
We measure the number of hops needed for an event to be routed to all matched brokers. In our approach a broker knows exactly the broker to which the event will be forwarded. In Siena, the routing paths for events are set by subscriptions, which are propagated throughout the network from neighbor to neighbor in the overlay. When a producer publishes an event, matching the subscription, the event is routed following the reverse path put in place by the subscription’s propagation. We study both methods for varying event popularities, which captures the number of brokers that match the event; the ‘matched’ brokers are randomly chosen for every event. Figure 12 shows the mean number of hops required to process 24,000 events, 1000 events of each broker. Our algorithm is shown to be better for event popularities up to 75%. For very highly popular events, Siena is better due to the extremely high subsumption percentages it achieves. However, we expect that the majority of events will not be so popular. 25
20 Mean number of hops
In figure 10 the y-axis is logarithmic. We first state that obviously both our approach and Siena significantly outperform the baseline approach by orders of magnitude with respect to network bandwidth requirements. We further stress that (i) even for a value of σ (number of subscriptions in each period) that is a very small percentage of S (e.g., 1% of S) our approach is better than its competitors. Note that this is important since small values of σ imply small latencies before the subscription summaries are sent; (ii) scalability is very good, as evidenced by the nearly ‘flat’ lines; and (iii) that for large-scale systems with large numbers of active users submitting subscriptions (i.e., large σ values), our approach is up to three orders of magnitude better when compared to the baseline approach. When compared against Siena’s subsumption approach we stress that we drastically outperform it (by a factor of 4 to 8 times).
10
5
0 10
25
50
75
90
Popularity % Siena
Our approach
Figure 12: Mean hop counts in event propagation. 100000000
500
Storage space
450 400 350 300 250
10000000 1000000 100000 10000
00
0
10
0
0
90
80
0
0
0
0
70
60
50
40
0
30
20
10
150
0
1000
200
10
Mean number of hops
15
Average number of outstanding subscriptions
100
Subscription Broadcast
50
Siena (Subsumption = 10%)
0
Subscription Summary (Subsumption = 10%) 10
25
50
75
90
Subsumption % Siena
Our approach
Figure 11: Mean hops needed for subscription propagation.
2)The Performance of Distributed Event Processing
Siena (Subsumption = 90%) Subscription Summary (Subsumption = 90%)
Figure 13: Storage requirements for subscriptions.
3) Subscription Storage Requirements
Figure 13 shows the total storage requirements across all brokers, where each broker receives and propagates a varying number of subscriptions (from 10 to 1000) in each period. Our approach outperforms Siena by about two to five times for subsumption probability equal to 10% and 90%. The reason for this improvement lies in the generalizations per attribute achieved by our per-broker summaries and extended by the multi-broker summaries and associated algorithms. Note that for small subsumption probabilities, Siena requires almost the same storage space as the baseline approach, as expected. 4) Computational Demands for Event Processing Briefly, the matching algorithm is dominated by its first two steps. The time needed for step 1 is equal to:
T1 = n ae × max{n sr × La , ne + La } + n se × (n r + Ls )
If P is the total number of subscriptions that have been collected from step 1, the computational time for step 2 is equal to: T2 = P . Thus, the total computational time is O(N), where N is the number of subscriptions. (For space reasons we omit the analysis for maintaining summaries, which is also O(N)). Despite the same complexity with related work, we expect that event filtering and matching will be faster in our paradigm, given the summaries and the generalized attributes, as discussed in section III.E. Furthermore, we have shown that the number of involved brokers during event processing is, on average, smaller. VI. CONCLUSIONS We contributed a new paradigm for pub/sub systems based on the novel notion of subscription summaries. We have presented the data structures constituting the summaries and the algorithms manipulating these summaries in order to match incoming events against the brokers’ subscriptions and to maintain them in the face of updates. Also, we have developed the notion of multi-broker summaries, shown how to compute them, and the accompanying algorithm for subscription summary propagation. These contributions introduce significant performance gains during subscription propagation, for network bandwidth, storage requirements, and in required broker involvement (hop counts). We then contributed a distributed event processing algorithm. which ensures efficiency during the event processing phase, in terms of the number of brokers involved in event routing. Our performance results show that our approach can drastically improve the bandwidth requirements to propagate subscriptions, outperforming the subsumption mechanism of Siena by a factor of four to eight . At the same time, the hop count for both subscription propagation and event processing is smaller and the computational requirements at each broker for filtering and matching events are expected to be better than those of related work. Finally, the storage requirements are smaller than Siena’s by 2 to 5 times. Our on-going work includes ensuring load balancing during event processing, which is an open problem. We employ ‘virtual degrees’ for the maximum-degree nodes,
reducing their load, while continuing, however, to offer significant improvements. Further, we are currently extending our structures to accommodate dynamically-changing attribute schemata, for larger-scale networks (e.g., multi-ISP, global CDNs) (basically, this only requires changing the c3 field of subscription ids). Finally, we are also currently developing techniques combining summarization and subsumption. REFERENCES [1] [2] [3]
[4] [5] [6] [7] [8] [9] [10] [11] [12] [13] [14] [15] [16] [17] [18] [19] [20] [21] [22]
M. K. Aguilera, R. E. Strom, D. C. Sturman, M. Astley, and T. D. Chandra. Matching events in a content-based subscription system. Proc. ACM PODC Symposium, pp 53–61, 1999. G. Banavar, T. Chandra, B. Mukherjee, J. Nagarajarao, R. E. Strom, and D. C. Sturman. An efficient multicast protocol for content-based publish/subscribe systems. Proc. ICDCS, pp 262–272, 1999. G. Banavar, M. Kaplan, K. Shaw, R. E. Strom, D. C. Sturman, and W. Tao. Information flow based event distribution middleware. Proc. ICDCS Workshop on Electronic Commerce and Web Applications, 1999. Cable and Wireless plc. http://www.cw.com. A. Carzaniga, E. Nitto, D. Rosenblum, and A. Wolf. Issues in supporting event-based architectural styles. 3rd Intl Software Architecture Workshop, 1998. A. Carzaniga, D. S. Rosenblum, and A. L. Wolf. Achieving scalability and expressiveness in an Internet-scale event notification service. Proc. ACM PODC, pp 219–227, 2000. G. Cugola, E. D. Nitto, and A. Fuggetta. The JEDI event-based infrastructure and its application to the development of OPSS WFMS. IEEE TSE, Sep. 2001. F. Fabret, H. A. Jacobsen, F. Llirbat, J. Pereira, K. A. Ross, and D. Shasha. Filtering algorithms and implementation for very fast publish/subscribe systems. ACM SIGMOD 2001, pp. 115-126, 2001. J. Gough and G. Smith. Efficient recognition of events in a distributed system. Proc. Australasian Computer Science Conference, Feb. 1995. R. E. Gruber, B. Krishnamurthy, and E. Panagos. The Architecture of the READY Event Notification Service. ICDCS workshop, June 1999. G. Muhl, L. Fiege, F. Gartner, and A. Buchmann. Evaluating advanced routing algorithms for content-based publish/subscribe systems. Proc. MASCOTS'02, pp167-176, 2002. Object Management Group. CORBAservices – event service specification. Technical report 2001. ftp://ftp.omg.org/pub/docs/formal/01-03-01.pdf. Object Management Group. CORBAservices – notification service specification. Tech. report, 2000. ftp://ftp.omg.org/pub/docs/formal/00-06-20.pdf. B. Oki, M. Pfluegl, A. Siegel, and D. Skeen. The Information Bus - an architecture for extensible distributed systems. Operating Systems Review, 27.5:58–68, 1993. P. R. Pietzuch and J. Bacon. A distributed event-based middleware architecture. Proc. 1st International Workshop on Distributed EventBased Systems, 2002. A. Rowstron and P. Druschel. Pastry: Scalable decentralized object location and routing for large-scale peer-to-peer systems. Proc. Middleware 01, 2001. B. Segall and D. Arnold. Elvin has left the building: A publish/subscribe notification service with quenching. Proc. Australian UNIX Users Group Technical Conference, pp 243–255, 1997. SoftWired Inc. iBus. http://www.softwired-inc.com. Sun Microsystems, Inc. Jini(TM) technology core platform spec distributed events. Technical report, 2000. http://www.sun.com/jini/specs. TIBCO Inc. TIB/Rendezvous. http://www.tibco.com. P. Triantafillou, A. Economides. Subscription Summaries for Scalability and Efficiency in Publish/Subscribe Systems. Proc. 1st International Workshop on Distributed Event-Based Systems, 2002. Vitria. BusinessWare. http://www.vitria.com