MOLECULAR MEDICINE REPORTS 12: 5049-5057, 2015
Substrate-specific gene expression profiles in different kidney cell types are associated with Fabry disease YOUN‑JEONG SHIN*, YEO JIN JEON*, NAMHEE JUNG, JOO‑WON PARK, HAE‑YOUNG PARK and SUNG‑CHUL JUNG Department of Biochemistry, School of Medicine, Ewha Womans University, Seoul 158‑710, Republic of Korea Received September 12, 2014; Accepted May 28, 2015 DOI: 10.3892/mmr.2015.4010 Abstract. Fabry disease is an X-linked lysosomal storage disorder caused by mutations in the gene encoding the α‑galactosidase A (α‑Gal A) lysosomal enzyme, which results in globotriaosylceramide (Gb3) storage in vascular endothelial cells and different cell types throughout the body. Involvement of the kidney and heart is life threatening, and fibrosis of these organs is considered to be involved in the pathogenesis of Fabry disease. An increased concentration of deacylated Gb3 (lyso‑Gb3) in the plasma of symptomatic patients has also been suggested as a causative molecular event. To elucidate the molecular mechanisms involved in renal fibrosis in Fabry disease, the present analyzed the changes in global gene expression prior to and following Gb3 or lyso‑Gb3 treatment in two types of kidney cell lines, human proximal renal tubular epithelial (HK‑2) and mouse renal glomerular mesangial (SV40 MES 13) cells. Gb3 and lyso‑Gb3 treatment regulated the expression of 199 and 328 genes in each cell type, demonstrating a >2.0‑fold change. The majority of the biological functions of the regulated genes were associated with fibrogenesis or epithelial‑mesenchymal transition (EMT). The gene expression patterns of sphingolipid‑treated HK‑2 cells were distinguishable from the patterns in the SV40 MES 13 cells. Several genes associated with the EMT were selected and evaluated further in kidney cells and in Fabry mouse kidney tissues. In the SV40 MES 13 cells, the DLL1, F8, and HOXA11 genes were downregulated, and FOXP2 was upregulated by treatment with Gb3 or lyso‑Gb3. In the HK‑2 cells, the ADAMTS6, BEST1, IL4, and MYH11 genes were upregulated. Upregulation of the FOXP2, COL15A1, IL4, and
Correspondence to: Dr Sung‑Chul Jung, Department of
Biochemistry, School of Medicine, Ewha Womans University, 1071 Anyangcheon‑ro, Seoul 158‑710, Republic of Korea E‑mail:
[email protected] *
Contributed equally
Key
words: Fabry disease, kidney, globotriaosylceramide, globotriaosylsphingosine, gene expression profile, mesangial cell, epithelial cell
MYH11 genes was also observed in the Fabry mouse kidney tissues. The gene expression profiles in kidney cells following the addition of Gb3 or lyso‑Gb3 revealed substrate‑specific and cell‑specific patterns. These findings suggested that Gb3 and lyso‑Gb3 lead to renal fibrosis in Fabry disease through different biochemical modulations. Introduction Fabry disease (OMIM 301500) is an X‑linked lysosomal storage disorder, which is caused by mutations in the gene encoding the lysosomal enzyme α‑galactosidase A (α‑Gal A; EC 3.2.1.22) (1,2). In Fabry disease, globotriaosylceramide (Gb3) accumulation occurs in lysosomes and other cellular compartments, and results in disease manifestation and organ failure. Among the types of cell in the kidney in which Gb3 accumulates and Gb3 inclusions are found, podocytes are most prominently involved, followed by distal tubular cells and parietal epithelial cells. Prominent Gb3 accumulation occurs in hemizygotes at or even prior to birth, prior to the development of any clinical symptoms (3). The initial symptoms of Fabry disease, including angiokeratoma, neuropathic pain, hypohidrosis or hyperhidrosis, and digestive tract symptoms, usually appear in childhood in heterozygotes. During the second decade of life, potentially life‑threatening involvement may develop, including stroke, chronic kidney disease associated with fibrosis, proteinuria and progressive decrease in glomerular filtration rate, left ventricular hypertrophy and heart failure (3). Organ fibrosis is a key feature of Fabry disease (4). Progressive podocyte injury can lead to podocyte loss and segmental glomerulosclerosis, the latter of which is a common late finding in Fabry nephropathy. The presence of deacylated Gb3, globotriaosylsphingosine (lyso‑Gb3), in the plasma of disease patients with Fabry has been noted as a hallmark of Fabry disease (5). Aerts et al (5) reported that the plasma of Fabry patients contains markedly increased concentrations of lyso‑Gb3, and the increase in the plasma concentration of this soluble glycolipid exceeds that of Gb3. Lyso‑Gb3 promotes Gb3 storage and induces proliferation of smooth muscle cells in vitro, which is suggestive of a causative role of lyso‑Gb3 in the pathogenesis of Fabry disease (5). In cultured human podocytes, lyso‑Gb3 recruits secondary mediators of inflammation and fibrosis. Even in normal human podocytes, lyso‑Gb3 increases the
5050
SHIN et al: SUBSTRATE-SPECIFIC GENE EXPRESSION PROFILES ASSOCIATED WITH FABRY DISEASE
expression of the fibrogenic cytokine transforming growth factor β1 (TGFβ1) in a dose‑ and time‑dependent manner, and increases the synthesis of extracellular matrix (ECM) proteins, including fibronectin and type IV collagen, in a TGFβ1‑dependent manner (6). Fibrosis is characterized by an increased accumulation of the ECM (7‑9). In addition, through potential direct effects of glycolipids on tubular cells, proteinuria itself may lead to tubular cell activation, inflammatory responses and interstitial fibrosis (4). Activation of interstitial fibroblasts gives rise to collagen‑secreting myofibroblasts. However, different studies have demonstrated that myofibroblasts can also originate from renal tubular epithelial and endothelial cells, which undergo the epithelial‑mesenchymal transition (EMT), in mouse models of renal fibrosis (10,11). The present study aimed to identify changes in the gene expression profiles of epithelial and mesangial cells grown in culture and exposed to Gb3 or lyso‑Gb3, as a model of Fabry disease. Microarrays were used to identify the gene expression profiles, which contribute to the EMT process and leads to kidney fibrosis. In addition, the expression profiles in different tissues and cells were compared to discern the cell‑specific activation patterns in the epithelial and mesangial cells. Materials and methods Animals. Fabry mice were bred to acquire a sufficient number of mice (12). Mice were maintained on a diurnal light cycle of 12 h in a temperature (21±2˚C) and humidity (55±5%) controlled room. Mice were fed an autoclaved diet and water ad libitum. The present study was approved by the Institutional Animal Care and Use Committee of the Ewha Womans University School of Medicine (Seoul, Korea). All mice were treated in accordance with the Animal Care Guidelines of the Ewha Womans University School of Medicine, and the National Research Council (US) Guide for the Care and Use of Laboratory Animals (13). All mice were genotyped using polymerase chain reaction (PCR; Bio‑Rad Laboratories, Inc., Johannesburg, South Africa). The mice were all 16‑week‑old males and were grouped into wild‑type and hemizygous Fabry mice. A minimum of 3 age‑matched mice were used for each group. Animals were sacrificed by CO2 inhalation euthanasia. Cell culture. For the in vitro investigation, the HK‑2 Homo sapiens kidney tubular epithelial cell line and SV40 MES 13 mouse kidney glomerular mesangial cell line were purchased from American Type Culture Collection (Manassas, VA, USA). The HK‑2 cells were cultured in complete growth media; keratinocyte serum‑free medium supplemented with 0.05 mg/ml bovine pituitary extract, 5 ng/ml human recombinant epidermal growth factor (EGF) and 5 µg/ml gentamicin (Invitrogen Life Technologies, Carlsbad, CA, USA). The SV40 MES 13 cells were maintained in a 3:1 mixture of Dulbecco's modified Eagle's medium and Ham's F12 medium (Welgene, Daegu, Korea) with 14 mM HEPES (Welgene) supplemented with 5% fetal bovine serum (Invitrogen Life Technologies) and penicillin/streptomycin (100 U/ml; Invitrogen Life Technologies) at 37˚C in 5% CO2 in a humidified incubator.
Gb3 and lyso‑Gb3 treatment. The HK‑2 cells (1x10⁵) and SV40 MES 13 (4x10⁴) cells were seeded into 60 mm tissue culture plates (SPL Life Sciences, Pocheon‑si, Korea), and proportion of which were treated with Gb3 (Matreya, Pleasant Gap, PA, USA) or lyso‑Gb3 (Sigma‑Aldrich, St. Louis, MO, USA) in serum‑free culture medium. The final concentration of treatment was 30 µM for Gb3 and 400 nM for lyso‑Gb3, which were dissolved in 100% dimethyl sulfoxide (Sigma‑Aldrich). The cells were treated with Gb3 or lyso‑Gb3 for 72 h. Microarray analysis. The HK‑2 cells and SV40 MES 13 cells were assigned to a control and a Gb3‑ or lyso‑Gb3‑treated group. The cells from each group were pooled, and the total RNA was extracted using an RNeasy Plus Mini Kit (Qiagen, Valencia, CA, USA), according to the manufacturer's instructions. The quality of RNA was analyzed using a 2100 Bioanalyzer (Agilent Technologies, Inc., Palo Alto, CA, USA). The total RNA from each group was amplified separately using a Low RNA Input Linear Amplification kit PLUS (Agilent Technologies). The Cy3 (control)‑ or Cy5 (Gb3 or lyso‑Gb3 treated)‑labeled targets were hybridized to an Agilent 44K human or mouse oligo microarray at 60˚C for 17 h. Following hybridization, the arrays were washed in three consecutive steps using an Agilent Gene Expression Wash Buffer kit (Agilent Technologies, Inc.). The microarrays were scanned using a DNA Microarray scanner using SureScan High‑Resolution Technology (G2565CA; Agilent Technologies, Inc.) and were analyzed using GeneSpring GX software (Agilent Technologies, Inc.). For normalization and hierarchical clustering analysis, the data obtained from the Gb3‑ and lyso‑Gb3‑treated cells were corrected using the values for the appropriate control and then imported into the GeneSpring GX software. Significant genes were selected for probes that exhibited a difference of >2‑fold in the normalization ratio. In the functional investigation, analysis of gene ontology was used to predict the function of each gene, classified by the biological process. Genes specifically expressed in each cluster of Gb3 or lyso‑Gb3 treated cells were identified by comparing with non‑treated control cells. Differentially expressed genes were categorized in Gene Ontology groups using the DAVID tool (http://david.abcc. ncifcrf.gov/). Reverse transcription‑quantitative (RT‑qPCR). Using the results from the microarray analysis, the present study identified genes, which were either upregulated or downregulated by >2‑fold as significant genes. RT‑qPCR was performed using SYBR® Premix Ex Taq TM (Takara, Bio, Inc., Shiga, Japan) on an ABI 7500 Fast Real‑Time PCR system (PE Applied Biosystems, Foster City, CA, USA) to confirm the relative expression levels of the genes in the control, Gb3 and lyso‑Gb3 groups. RNA was reverse transcribed using the High Capacity cDNA Archive kit (Applied Biosystems). The total volume of the PCR reaction was 20 µl, containing 0.8 µl of each primer (5 µM), 1 µl cDNA, 10 µl 2X SYBR® Premix Ex Taq™ II, 0.4 µl Rox dye and 7.8 µl sterile ddH 2O. PCR cycling conditions were as follows: Initial 30 sec denaturation at 95˚C, followed by 40 cycles of amplification at 95˚C for 3 sec and 60˚C for 30 sec, and a subsequent melting curve analysis, where the temperature was increased from 60 to
MOLECULAR MEDICINE REPORTS 12: 5049-5057, 2015
5051
Table I. Gene expression patterns in SV40 MES 13 cells treated with Gb3 or lyso‑Gb3. Gene symbol
GenBank ID
Gene name
Fold change ‑‑‑‑‑‑‑‑‑‑‑‑‑‑‑‑‑‑‑‑‑‑‑‑‑‑‑‑‑‑‑‑‑‑‑‑‑‑‑‑ Gb3 Lyso‑Gb3
Cytoskeleton FSCN2 NM_172802 Fascin homolog 2, actin‑bundling 15.97 ‑1.74 protein, retinal NCKAP1L NM_153505 Hematopoietic protein 1 5.91 6.72 VIL1 NM_009509 Villin 1 3.57 1.51 EGF NM_010113 Epidermal growth factor 2.10 ‑1.35 SCIN NM_009132 Scinderin 2.10 ‑1.50 Extracellular matrix MMP9 NM_013599 Matrix metalloproteinase 9 5.59 ‑1.13 COL4A3 NM_007734 Collagen, type IV, alpha 3 2.77 ‑1.33 (Goodpasture antigen) COL15A1 NM_009928 Collagen, type XV, alpha 1 2.29 2.61 NTN4 NM_021320 Netrin 4 2.44 1.84 RELN NM_011261 Reelin precursor ‑1.08 27.84 IMPG2 NM_174876 Interphotoreceptor matrix ‑2.34 ‑4.13 proteoglycan 2 KERA NM_008438 Keratocan ‑3.39 ‑11.52 Cell proliferation/differentiation PRM2 NM_008933 Protamine 2 22.61 1.49 DNER NM_152915 Delta/notch‑like EGF‑related 9.12 7.55 receptor WT1 NM_144783 Wilms' tumor 1 6.36 2.60 FOXP2 NM_053242 Forkhead box P2 2.89 45.68 HOXA11 NM_010450 Homeobox A11 ‑2.51 ‑2.19 DLL1 NM_007865 Delta‑like 1 ‑5.14 ‑6.89 DMRT2 NM_145831 Doublesex and mab‑3 related 1 ‑5.79 3.05 transcription factor 2 isoform Cell migration CYBB NM_007807 Cytochrome b‑245, beta polypeptide 8.20 2.36 ISL1 NM_021459 ISL1 transcription factor, 6.27 1.08 LIM/homeodomain (islet 1) TNF NM_013693 Tumor necrosis factor alpha 4.72 1.57 NM_009382 Thymus cell antigen 1, theta 1.32 16.51 PRRXL1 NM_001001796 Paired related homeobox protein‑like 1 ‑1.76 ‑5.97 F8 NM_007977 Coagulation factor VIII ‑2.90 ‑3.33 Gb3, globotriaosylceramide; lyso‑Gb3, deacylated Gb3.
95˚C. In order to quantify each candidate gene expression, the mRNA expression levels were normalized to the GAPDH mRNA level. Relative gene expression was analyzed using the comparative cycle threshold (Ct) method (2 ‑ΔΔCt) (14). RT‑qPCR was performed in triplicate for each sample and was repeated three times for each assay. Western blot analysis. The Gb3‑ or lyso‑Gb3‑treated cells were washed with ice‑cold phosphate‑buffered saline and resuspended in PRO‑PREP buffer (iNtRON Biotechnology, Inc.) supplemented with phosphatase inhibitor cocktail
solution for 30 min on ice. Insoluble material was removed by centrifugation at 13,000 x g for 20 min at 4˚C. Total protein concentration was determined using bicinchoninic acid assay (Pierce Biotechnology, Inc., Rockford, IL, USA). The protein was electrophoresed on a 10% sodium dodecyl sulfate‑polyacrylamide gel, and transferred onto a polyvinylidene membrane (EMD Millipore, Billerica, MA, USA). The membrane was blocked with 5% nonfat dry milk in Tris‑buffered saline (Elpis Biotech, Inc., Taejeon, Korea) containing 0.1% Tween‑20 (TBST; Sigma‑Aldrich) for 1 h and then incubated overnight at 4˚C with anti‑WT1 polyclonal
5052
SHIN et al: SUBSTRATE-SPECIFIC GENE EXPRESSION PROFILES ASSOCIATED WITH FABRY DISEASE
Table II. Gene expression patterns in HK‑2 cells treated with Gb3 or lyso‑Gb3. Gene symbol
GenBank ID
Gene name
Fold change ‑‑‑‑‑‑‑‑‑‑‑‑‑‑‑‑‑‑‑‑‑‑‑‑‑‑‑‑‑‑‑‑‑‑‑‑‑‑ Gb3 Lyso‑Gb3
Cytoskeleton AKAP4 NM_003886 A kinase (PRKA) anchor protein 4 3.84 ‑4.89 EML1 NM_001008707 Echinoderm microtubule associated 2.62 ‑1.17 protein like 1 FGF23 NM_020638 Fibroblast growth factor 23 1.21 ‑13.61 ERMN NM_020711 Ermin, ERM‑like protein ‑13.79 ‑15.86 SGCD NM_000337 Sarcoglycan, delta (35 kDa ‑17.57 1.19 dystrophin‑associated glycoprotein) Extracellular matrix IL19 NM_153758 Interleukin 19 24.90 1.20 SERPING1 NM_000062 Serpin peptidase inhibitor, clade G 10.25 1.09 (C1 inhibitor), member 1 MYH11 NM_001040113 Smooth muscle myosin heavy chain 3.59 5.75 11 isoform SM2A ADAMTS6 NM_197941 ADAM metallopeptidase with thrombospondin 2.76 9.00 type 1 motif, 6 preproprotein COL15A1 NM_001855 Collagen, type XV, alpha 1 3.16 ‑1.06 CRIM1 NM_016441 Cysteine rich transmembrane BMP ‑9.69 ‑13.96 regulator 1 (chordin‑like) SEPP1 NM_005410 Selenoprotein P, plasma, 1 ‑13.32 ‑15.61 Cell proliferation/differentiation RARB NM_000965 Retinoic acid receptor, beta 23.54 ‑1.06 IL4 NM_000589 Interleukin 4 22.44 3.47 GKN1 NM_019617 Gastrokine 1 11.04 ‑1.75 INS NM_000207 Insulin ‑2.33 ‑3.06 TFAP2A M61156 Transcription factor AP‑2 alpha ‑2.47 ‑2.96 (activating enhancer binding protein 2 alpha) IL2 NM_000586 Interleukin 2 ‑16.42 ‑18.89 Cell migration CSF1 NM_172210 Colony stimulating factor 1 (macrophage) 3.69 1.17 HES1 NM_005524 Hairy and enhancer of split 1, (Drosophila) 2.24 1.42 EPHB3 NM_004443 EPH receptor B3 1.36 2.31 PROP1 NM_006261 PROP paired‑like homeobox 1 1.24 2.11 Gb3, globotriaosylceramide; lyso‑Gb3, deacylated Gb3.
antibody (cat. no. sc-192; Santa Cruz Biotechnology, Inc., Santa Cruz, CA, USA). The primary antibody was removed, and the blots were washed three times with TBST and then incubated for 1 h at room temperature with goat anti‑rabbit IgG (cat. no. sc-2054; Santa Cruz Biotechnology, Inc.) as the secondary antibody. Following removal of the secondary antibody, the blots were washed and the specific bands were detected using enhanced chemiluminescence with a WestSave GOLDTM Western Blot Detection kit (AbFronteir, Seoul, Korea), according to the manufacturer's instructions. All signals were analyzed using densitometric scanning (LAS‑3000; Fujifilm, Tokyo, Japan).
Statistical analysis. The values are presented as either the mean ± standard deviation or ± standard error of the mean. Data were analyzed using Prism 4.0 software (GraphPad Software. Inc., La Jolla, CA, USA). The significance of differences between groups was determined using Student's t‑test. P2‑fold, compared with the control group, the change was considered to be significant.
A
B
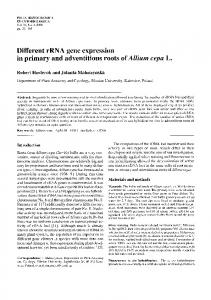
SV40 MES 13 cells. A total of 39,429 genes were detected in the SV40 MES 13 cells, of which 2,991 were significant. The majority of the upregulated genes were associated with ‘ECM’, ‘cell migration,’ ‘cell differentiation’ or ‘immune response’. The majority of the of the downregulated genes were associated with ‘ECM’, ‘immune response’ or ‘cell migration’ (Fig. 1A and B). HK‑2 cells. A total of 34,127 genes were detected in the HK‑1 cells, of which 1,141 were identified as either significantly upregulated or downregulated. The majority of the upregulated genes were associated with ‘ECM’, ‘cell differentiation,’ ‘cell migration’ or ‘immune response’. The majority of the downregulated genes were associated with ‘cell migration’, ‘cell death’, ‘cell differentiation’ or ‘immune response’ (Fig. 1C and D). Hierarchical clustering analysis. Hierarchical clustering analysis revealed that, following treatment of the SV40 MES 13 cells and HK‑2 cells with Gb3 or lyso‑Gb3, the change in gene expression was dependant on the cell type and substrate (Fig. 2). In the SV40 MES 13 cells treated with Gb3, the
Figure 2. Hierarchical clustering analysis. Comparison of gene expression patterns in kidney cells treated with either Gb3 or lyso‑Gb3. (A) SV40 MES 13 cells and (B) HK‑2 cells. Expression levels are indicated by color coding, in which red represents upregulation and green represents downregulation. Gb3, globotriaosylceramide; lyso‑Gb3, deacylated Gb3.
5054
SHIN et al: SUBSTRATE-SPECIFIC GENE EXPRESSION PROFILES ASSOCIATED WITH FABRY DISEASE
A
B
Figure 3. RT‑qPCR analyses to determine changes in gene expression. (A) RT‑qPCR analyses of the HOXA11, FOXP2, F8 and DLL1 genes in SV40 MES 13 cells, and of the (B) ADAMTS6, BEST1, IL4 and MYH11 genes in HK‑2 cells. Expression levels of genes in SV40 MES 13 and HK‑2 cells treated with Gb3 or lyso‑Gb3 were analyzed using RT‑qPCR and expressed as a ratio relative to the expression in untreated cells. Data are presented as the mean ± standard error of the mean of at least three experiments. RT‑qPCR, reverse transcription‑quantitative polymerase chain reaction; Gb3, globotriaosylceramide; lyso‑Gb3, deacylated Gb3.
majority of the significantly altered genes were upregulated, however, their corresponding gene expression patterns were different following treatment with lyso‑Gb3 (Fig. 2A). In the HK‑2 cells, the gene expression pattern was more stable, compared with than that observed in the SV40 MES 13 cells (Fig. 2B), although the patterns differed between treatments with Gb3 and lyso‑Gb3. In contrast to the SV40 MES 13 cells treated with Gb3, the majorit of the significantly altered genes in the HK‑2 cells were upregulated following treatment with lyso‑Gb3. Validation of gene expression patterns in the cell models using RT‑qPCR. To confirm the microarray‑predicted expression patterns, the present study performed RT‑qPCR to analyze the candidate genes. The ‘target’ genes, which presented with relatively consistent patterns in the microarray and RT‑qPCR, including IL4, MYH11, ADAMTS6, BEST1, FOXP2, F8, HOXA11, DLL1 and WT1 were identified. In the SV40 MES 13 mesangial cells treated with Gb3 or lyso‑Gb3, the expression of FOXP2 was upregulated and the expression levels of HOXA11, F8 and DLL1 were downregulated, compared with the control cells (Fig. 3A). In the HK‑2 epithelial cells, the mRNA expression levels of ADAMTS6, BEST1, IL4 and MYH11 were upregulated in the Gb3‑ and lyso‑Gb3‑treated epithelial cells, compared with the control cells (Fig. 3B). Validation of gene expression in kidney tissues. The present study also examined the expression levels of FOXP2, COL15A1, MYH11 and IL4 in kidney tissues from wild‑type and Fabry mice (Fig. 4). Compared with the wild‑type tissues, the expression levels of COL15A1, IL4 and MYH11 were significantly upregulated in the Fabry mouse kidney tissues.
Figure 4. Reverse transcription‑quantitative polymerase chain reaction analyses of the FOXP2, COL15A1, IL4, and MYH11 genes in mouse kidney tissues. The gene expression ratios of each gene in the kidneys were compared between Fabry mice and wild‑type mice. Data are expressed as the mean ± standard error of the mean of at least three experiments. *P