APPLIED PHYSICS LETTERS 90, 254102 共2007兲
Subwavelength resolution with a negative-index metamaterial superlens Koray Aydin,a兲 Irfan Bulu, and Ekmel Ozbay Nanotechnology Research Center-NANOTAM, Bilkent University, Bilkent, 06800 Ankara, Turkey; Department of Physics, Bilkent University, Bilkent, 06800 Ankara, Turkey; and Department of Electrical and Electronics Engineering, Bilkent University, Bilkent, 06800 Ankara, Turkey
共Received 8 March 2007; accepted 26 May 2007; published online 19 June 2007兲 Negative-index metamaterials are candidates for imaging objects with sizes smaller than a half-wavelength. The authors report an impedance-matched, low loss negative-index metamaterial superlens that is capable of resolving subwavelength features of a point source with a 0.13 resolution, which is the highest resolution achieved by a negative-index metamaterial. By separating two point sources with a distance of / 8, they were able to detect two distinct peaks on the image plane. They also showed that the metamaterial based structure has a flat lens behavior. © 2007 American Institute of Physics. 关DOI: 10.1063/1.2750393兴 Refraction is a basic phenomenon that is widely used in electromagnetism and optics, and forms the basis of imaging process and lenses. Ubiquitous materials have positive refractive indices; however, it is possible to obtain negative values of refractive index by making use of the concept of metamaterials and photonic crystals.1,2 The possibility of bringing the refractive index into the domain of negative values was first discussed by Veselago3 in which the first steps to realize these exciting materials were taken four decades later.4 Inspired by the intriguing electromagnetic 共EM兲 properties arising from negative-index metamaterials 共NIMs兲, these types of artificially constructed structures received burgeoning interest from the scientific community.5–11 A perfect lens is one of the most important applications of materials with a negative refractive index. The term, perfect lens, was coined by Pendry owing to the ability of such lenses to reconstruct a perfect image by recovering the evanescent components of EM waves.12 In conventional optics, the lenses are constructed from positive-index materials and require curved surfaces to bring EM waves into focus. Positive-index lenses act only on the phase of the radiation, thus their resolution is limited to the half-wavelength. The finer details of the image are carried by high-k components, the so called evanescent waves, and quickly decay before reaching the image plane. Therefore, the contribution of evanescent components to the resolution of the image is absent in conventional lenses. However, Pendry conceived that it is possible to enhance evanescent waves by using a negative refractive index medium. Photonic crystals13 and metamaterials6–10,14,15 were experimentally demonstrated to achieve diffraction-free imaging, in which further theoretical studies16–18 supported these results. In this letter, we demonstrate an impedance-matched, low loss negative-index metamaterial superlens that is capable of resolving subwavelength features with a record-level 0.13 resolution, which is the highest resolution achieved by a negative-index metamaterial. In our study, we employed a two-dimensional 共2D兲 metamaterial based on split ring resonator 共SRR兲 and wire geometry to achieve subwavelength resolution. The NIM under investigation is a slab of 2D SRR-wire arrays deposited on FR4 printed circuit boards 关Fig. 1共a兲兴, with the parameters provided in Ref. 10. The NIM slab has a兲
Electronic mail:
[email protected]
40⫻ 20⫻ 3 layers along the x, y, and z directions with equal lattice constants in all directions, ax = ay = az = 9.3 mm. The NIM slab has a thickness of 2.79 cm 共⬃ / 3兲 and a length of 38 cm 共4.8兲. Transmission and reflection measurements are performed to characterize 2D NIM, in which the results are plotted in Fig. 1共b兲. A well-defined transmission peak is observed between 3.65 and 4.00 GHz, where the effective permeability and effective permittivity of NIM are simultaneously negative.10 A sharp dip in the reflection spectrum is observed at 3.78 GHz. The reflection is very low, −37 dB, meaning that the incident EM waves nearly do not face any reflection at the NIM surface. The effective parameters of the NIM are retrieved by using the calculated amplitudes and phases of transmission and reflection by following the method in Ref. 19 The ambiguity in the determination of the correct branch is resolved by use of an analytic continuation procedure.19 Dielectric permittivity = ⬘ + i⬙ and magnetic permeability = ⬘ + i⬙ are used to describe the response of materials to the incident electromagnetic field, where ⬘ and ⬘ are the real parts, and ⬙ and ⬙ are the imaginary parts of the corresponding effective parameters. Figure 2共a兲 depicts the real parts of 共blue line兲 and 共red line兲, and simulated reflection spectrum 共black line兲. ⬘ and ⬘ possess negative values between 3.63 and 3.93 GHz. The minimum reflection in the simulations occurs at 3.74 GHz, where ⬘ = ⬘ = −1.8 共dashed orange line兲. The real and imaginary parts of the index of refraction n⬘ 共blue line兲 and n⬙ 共green line兲 and the real part of impedance Z⬘ 共red line兲 are plotted in Fig. 2共b兲. The im-
FIG. 1. 共Color online兲 共a兲 Photograph of NIM slab with three unit cells along the z direction. 共b兲 Measured transmission 共blue兲 and reflection 共red兲 spectra for a NIM slab.
0003-6951/2007/90共25兲/254102/3/$23.00 90, 254102-1 © 2007 American Institute of Physics Downloaded 19 Jun 2007 to 139.179.155.131. Redistribution subject to AIP license or copyright, see http://apl.aip.org/apl/copyright.jsp
254102-2
Aydin, Bulu, and Ozbay
Appl. Phys. Lett. 90, 254102 共2007兲
FIG. 2. 共Color online兲 共a兲 Real parts of retrieved effective permittivity 共blue兲 and permeability 共red兲, and reflection spectrum 共black兲. 共b兲 Real parts of a retrieved refractive index 共blue兲, impedance 共red兲, and imaginary part of the refractive index 共green兲.
pedance is defined as Z = 冑⬘ / ⬘; therefore impedance matching is obtained when ⬘ = ⬘. Expectedly, the impedance of NIM is matched to that of free space at 3.74 GHz, where Z⬘ = 1. The imaging measurements presented here are performed at 3.78 GHz, where the reflection is considerably low and the losses due to reflection are negligible. The NIM has a refractive index of neff = −2.07± 0.22 at 3.78 GHz, which is measured by using a wedge-shaped 2D NIM.10 The refractive index obtained from the retrieval procedure is neff = −1.81. Figure of merit is defined as the ratio of n⬘ to n⬙ and used to characterize the performance of NIMs.20–22 In our simulations, we found n⬘ = −1.81 and n⬙ = −0.15 at 3.74 GHz. Therefore, the figure of merit is 12, the highest value ever reported. The NIM structure has low absorption losses, and therefore can be used to achieve subwavelength resolution. In the imaging experiments, we employed monopole antennae to imitate the point source. The exposed center conductor acts as the transmitter and receiver and has a length of 4 cm 共⬃ / 2兲. Firstly, we measured the beam profile in free space that is plotted in Fig. 3共a兲 with a red dashed line. The full width at half maximum of the beam is 8.2 cm 共1.03兲. Then, we inserted NIM superlens and measured the spot size of the beam as 0.13, which is well below the diffraction limit. The source is located ds = 1.2 cm away from first boundary and the image forms di = 0.8 cm away from second boundary of the superlens. The intensity of the electric field at the image plane is scanned by the receiver monopole antenna with ⌬x = 2 mm steps. The field intensity is normalized with respect to the maximum intensity in figure. However, this focusing behavior could have been due to a channeling effect. The SRR-wire boards are separated with 9.3 mm and the field may propagate on these channels. To ensure that the subwavelength imaging is due to the effective response of NIM and not that of individual channels, we moved the point source along the source plane to check the flat lens behavior.23 The resulting intensity distributions are plotted in Fig. 3共b兲 for different source locations, namely, x = 0 cm 共black line兲, 0.5 cm 共red line兲, and −1.3 cm 共gray line兲. In all the cases, the images were formed exactly at the same x distance with the source. It is noteworthy that the distances are not the multiples of the lattice constant, i.e., the sources are not located on the axes of SRR-wire boards. We used two point sources separated by distances smaller than a wavelength to obtain subwavelength resolution. The sources are driven by two independent signal generators and the power distribution is detected by using a microwave spectrum analyzer. The frequencies of the sources differ by 1 MHz to ensure that the sources are entirely incoherent. The reason behind using incoherent sources is to prevent the contribution of interference effects to the imaging
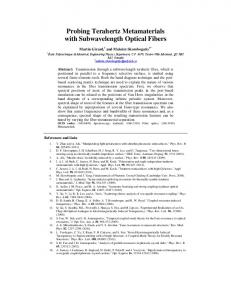
resolution measurements.13 The measured power distribution of sources, separated by / 8, is plotted by the black line 共쎲兲 in Fig. 4. As seen in the figure, the peaks of two sources are clearly resolved. The resolution becomes better for / 5 separation between the sources 共red line, 䉲兲. Finally, when the sources are / 3 apart 共blue line, 䊏兲, two peaks are entirely resolved. In order to avoid any possible channeling effects, the sources are intentionally not placed at the line of SRRwire boards. Besides, the distances between the sources in all three experiments are carefully chosen such that they are not multiples of the lattice constant. The lattice constant is on the order of / 8.5; therefore the NIM structure behaves as an effective medium. The periodicity has a significant effect on the resolution of the superlens by limiting the recovery of evanescent components.17 Following the analysis by Smith et al. where they discussed the effect of deviation from the ideal parameters on subwavelength resolution, one may argue that superlens with = = −1.8 may not provide / 8 resolution. We think that
FIG. 3. 共Color online兲 The measured power distributions at the image plane 共a兲 with 共blue兲 and without 共dashed red line兲 NIM superlens. Normalized intensity in free space is multiplied with 0.4 in the figure. 共b兲 The field profiles from single sources placed at three different locations along the x direction that are x = 0 cm 共black line, 쎲兲, 0.5 cm 共red line, 䉲兲 and −1.3 cm 共gray line, 䊏兲. Downloaded 19 Jun 2007 to 139.179.155.131. Redistribution subject to AIP license or copyright, see http://apl.aip.org/apl/copyright.jsp
254102-3
Appl. Phys. Lett. 90, 254102 共2007兲
Aydin, Bulu, and Ozbay
NIM superlenses. However, meticulous designs are needed to achieve low loss, impedance-matched superlenses at optical frequencies, since the amount of absorption losses is relatively large compared to the losses at microwave frequencies. This work is supported by the European Union under the projects EU-NoE-METAMORPHOSE, EU-NoEPHOREMOST, and TUBITAK under Projects Nos. 104E090, 105E066, 105A005, and 106A017. One of the authors 共E.O.兲 also acknowledges partial support from the Turkish Academy of Sciences. R. A. Shelby, D. R. Smith, and S. Schultz, Science 292, 77 共2001兲. E. Cubukcu, K. Aydin, E. Ozbay, S. Foteinopoulou, and C. M. Soukoulis, Nature 共London兲 423, 604 共2003兲. 3 V. G. Veselago, Sov. Phys. Usp. 10, 509 共1968兲. 4 D. R. Smith, W. J. Padilla, D. C. Vier, S. C. Nemat-Nasser, and S. Schultz, Phys. Rev. Lett. 84, 4184 共2000兲. 5 K. Aydin, K. Guven, L. Zhang, M. Kafesaki, C. M. Soukoulis, and E. Ozbay, Opt. Lett. 29, 2623 共2004兲. 6 A. Grbic and G. V. Eleftheriades, Phys. Rev. Lett. 92, 117403 共2004兲. 7 A. N. Lagarkov and V. N. Kissel, Phys. Rev. Lett. 92, 077401 共2004兲. 8 K. Aydin, I. Bulu, and E. Ozbay, Opt. Express 13, 8753 共2005兲. 9 N. Fang, H. Lee, C. Sun, and X. Zhang, Science 308, 534 共2005兲. 10 K. Aydin, K. Guven, C. M. Soukoulis, and E. Ozbay, Appl. Phys. Lett. 86, 124102 共2005兲. 11 K. Aydin, I. Bulu, K. Guven, M. Kafesaki, C. M. Soukoulis, and E. Ozbay, New J. Phys. 7, 168 共2005兲. 12 J. B. Pendry, Phys. Rev. Lett. 85, 3966 共2000兲. 13 E. Cubukcu, K. Aydin, S. Foteinopolou, C. M. Soukoulis, and E. Ozbay, Phys. Rev. Lett. 91, 207401 共2003兲. 14 R. J. Blaikie and D. O. S. Melville, J. Opt. A, Pure Appl. Opt. 7, S176 共2005兲. 15 M. C. K. Wiltshire, J. B. Pendry, and J. V. Hajnal, J. Phys.: Condens. Matter 18, L315 共2006兲. 16 N. Fang and X. Zhang, Appl. Phys. Lett. 82, 161 共2003兲. 17 D. R. Smith, D. Schurig, M. Rosenbluth, S. Schultz, S. A. Ramakrishna, and J. B. Pendry, Appl. Phys. Lett. 82, 1506 共2003兲. 18 V. A. Podolskiy and E. E. Narimanov, Opt. Lett. 30, 75 共2005兲. 19 X. Chen, T. M. Grzegorczyk, B.-I. Wu, J. Pacheco, Jr., and J. A. Kong, Phys. Rev. E 70, 016608 共2004兲. 20 S. Zhang, W. Fan, N. C. Panoiu, K. J. Malloy, R. M. Osgood, and S. R. J. Brueck, Phys. Rev. Lett. 95, 137404 共2005兲. 21 V. M. Shalaev, W. Cai, U. K. Chettiar, H. Yuan, A. K. Sarychev, V. P. Drachev, and V. Kildishev, Opt. Lett. 30, 3356 共2005兲. 22 G. Dolling, M. Wegener, C. M. Soukoulis, and S. Linden, Opt. Lett. 32, 53 共2007兲. 23 P. V. Parimi, W. T. Lu, P. Vodo, and S. Sridhar, Nature 共London兲 426, 404 共2003兲. 1
FIG. 4. 共Color online兲 The measured power distributions for two point sources separated with distances of / 8 共black line兲, / 5 共red line兲, and / 3 共blue line兲. The normalized intensity in free space is shown with a green dashed-dotted line and multiplied with 0.2 in the figure.
anisotropic effects take place in our superlens and the observed high resolution may be attributed to inherent anisotropy of our structure. The effect of anisotropy on imaging performance is discussed by Lagarkov et al.7 In the near-field regime, the electrostatic and magnetostatic limits apply, and therefore, the electric and magnetic responses of materials can be treated as decoupled.12 This in turn brings the possibility of constructing superlenses from materials with negative permittivity9,14 or negative permeability.15 Recently, Wiltshire et al.15 reported / 64 resolution that is obtained from a magnetostatic superlens operating at radio frequencies with an effective permeability value of eff = −1. The advantage of using negative-index lenses over negative-permittivity or negative-permeability lenses is that the subwavelength resolution can be obtained for both transverse-electric and transverse-magnetic polarizations of EM waves. However, single-negative lenses can only focus EM waves with one particular polarization. Superlenses can be used in several applications such as imaging, sensing, and subwavelength nanolithography. Here, we verified that it is possible to obtain subdiffraction resolution from a microwave superlens with an effective negative refractive index. Since the NIMs are gearing toward optical frequencies,20–22 we believe that subwavelength resolution can be achieved at visible wavelengths by employing thin
2
Downloaded 19 Jun 2007 to 139.179.155.131. Redistribution subject to AIP license or copyright, see http://apl.aip.org/apl/copyright.jsp