Jan 31, 2012 - by the collision of two small sunspots with opposite magnetic polarities and ... In the collision, this AR produced two successive M-class.
The Astronomical Journal, 143:56 (8pp), 2012 March � C 2012.
doi:10.1088/0004-6256/143/3/56
The American Astronomical Society. All rights reserved. Printed in the U.S.A.
SUCCESSIVE SOLAR ERUPTIONS TRIGGERED BY THE COLLISION OF TWO SMALL SUNSPOTS WITH OPPOSITE POLARITIES AND MOTIONAL DIRECTIONS 1
X. L. Yan1,2 , Z. Q. Qu1 , and D. F. Kong1,2 National Astronomical Observatories/Yunnan Astronomical Observatory, Chinese Academy of Sciences, Kunming, Yunnan 650011, China 2 Graduate School of Chinese Academy of Sciences, Zhongguancun, Beijing, China Received 2011 June 6; accepted 2011 December 9; published 2012 January 31
ABSTRACT We present a study of the two successive M-class flares associated with two coronal mass ejections (CMEs) triggered by the collision of two small sunspots with opposite magnetic polarities and motional directions in NOAA active region (AR) 10484 on 2003 October 22. From the evolution of this AR in the TRACE white-light images and 96 minute line-of-sight magnetograms observed by the Michelson Doppler Imager on board SOHO, a large sunspot and a small sunspot with negative polarity rotated clockwise about 33◦ and 18◦ , respectively, from the northeast of a quiescent sunspot with negative polarity to the southeast from 15:00 UT on October 21 to 16:24 UT on October 23. During the process of their motion, the small sunspot with negative polarity collided with the small sunspot with positive polarity and opposite motional direction. In the collision, this AR produced two successive M-class flares and CMEs according to the observations of GOES and the Large Angle and Spectrometric Coronagraph. By analyzing the magnetic fields at polarity inversion lines (PILs) between the two small sunspot, it is found that a sudden squeeze occurred near the onset of the two M-class flares and then recovered itself after the flares. We ruled out the emergence of the magnetic fields near the PIL. According to the brightenings in TRACE 1600 Å and the hard X-ray sources of the RHESSI of two M-class flares, we found that the locations of the two flares are almost situated in the same location at the PIL between the two small sunspots. We suggest that the sudden squeeze between the opposite magnetic polarities is caused by the pressure of the collision of the two small sunspots and resulted in the magnetic reconnection. These results could contribute to understanding the mechanism of flares and CMEs. Key words: Sun: activity – Sun: coronal mass ejections (CMEs) – Sun: flares – Sun: surface magnetism – sunspots Online-only material: animations
Priest 1979, 1980; T¨or¨ok et al. 2004; Srivastava et al. 2010) and loop–loop reconnection (Aschwanden et al. 1999) were also proposed as mechanisms for the occurrence of solar flares and CMEs. Solar eruptions usually occur in magnetic regions with complex polarity patterns (Aulanier et al. 2000), high sheared transverse magnetic fields (Low 1977; Wang 1994; Deng et al. 2001), magnetic flux emergence (Chen & Shibata 2000; Wang et al. 2004; Sakajiri et al. 2004; Li et al. 2007; Archontis & Hood 2010), and magnetic cancellation (Zhang et al. 2001). Recently, the role played by the magnetic gradient of the longitudinal magnetograms was investigated by many authors. The relationship between magnetic gradient and magnetic shear in super ARs producing great flares was investigated by Wang et al. (2006). They found that the magnetic gradient could be a better proxy than the shear for predicting where flares might occur. Cui et al. (2006) have reported that the occurrence of flares is closely correlated with the maximum magnitude of the horizontal gradient in the longitudinal magnetograms of ARs. Schrijver (2007) has found that there is a strong correlation between the large (M-, X-class) flares and the total unsigned magnetic flux near strong fields at polarity inversion lines (PILs). ARs with rotating sunspots (Yan et al. 2008a) are often found to be associated with flares (Tian & Alexander 2006; Yan & Qu 2007; Zhang et al. 2007). The S-shaped or inverse S-shaped structures (Gibson et al. 2006; Fan 2010) are observed in soft X-ray by Yohkoh/SXT (Pevtsov 2002) and Hinode/SXT (Yan et al. 2009) and in EUV (Rust & Labonte 2005) to often be erupted as flares and CMEs (Canfield et al. 1999). Two flares occur almost simultaneously in different ARs named by sympathetic flares (Pearce & Harrison 1990;
1. INTRODUCTION It is widely accepted that solar flares are the release of free energy stored in stressed or non-potential magnetic fields in active regions (ARs; Zirin & Tanaka 1973; Hagyard et al. 1984). Only the magnetic fields can provide sufficient free energy to power the flares (Forbes 2000). The energy released by flares is a process of the rapid transformation of the magnetic energy of the AR into the kinetic energy of particles, radiation, plasma flows, and heat. There are two types of solar flares. One type is the confined flares that often occur in the loops of the lower corona. The emission comes from the plasma in these loops. The other type is the eruptive flares that are typically associated with a coronal mass ejection (CME) and accompanied by a filament eruption. Solar flares and CMEs are often accompanied by eruptions of unstable filaments (Yan et al. 2011) and are involved in magnetic reconnection processes (Aschwanden 2004). The classic model for eruptive flares is called the CSHKP model (Carmichael 1964; Sturrock 1966; Hirayama 1974; Kopp & Pneuman 1976) and it has been put forward by many authors. The CSHKP model was dubbed “the standard model” for CMEs/flares (Hudson & Cliver 2001). Models for the initiation of eruptions have been proposed in the last few decades such as the tether-cutting model (Moore et al. 2001); the magnetic breakout model (Antiochos 1998; Antiochos et al. 1999; DeVore & Antiochos 2008); loss of equilibrium via magnetic flux cancellation, reconnection, or converging motion (van Ballegooijen & Martens 1989; Amari et al. 1999; Forbes & Priest 1995; Priest & Forbes 2002; Lin & Forbes 2000; Fan & Gibson 2007); and so on. In addition, kink instability of the solar coronal loop (Hood & 1
The Astronomical Journal, 143:56 (8pp), 2012 March
Yan, Qu, & Kong
Gopalswamy et al. 1999; Wang et al. 2001; Wheatland & Craig 2006). Moon et al. (2002) evidenced that the sympathetic flares have some physical connection. Wang et al. (2007) and Liu et al. (2009) reported the successive flares in NOAA AR 10808 triggered by the occurrence of the initial flare destabilizing the nearby flux loop system and leading to the filament eruption with the second flare. Homologous flares, defined as flares having similar morphology in Hα, EUV brightenings, soft X-ray structures, etc., are also studied by many authors. Though homologous flares have similar morphology, their processes have different properties (Sterling & Moore 2001; Chandra et al. 2011). To our knowledge, the two successive M-class flares associated with two successive CMEs caused by the collision between two small sunspots with opposite polarities and motional directions have not been reported. Such a process can help us to deeply understand the physics of eruptions. In this paper, we study a clear case of the two successive flares with two successive CMEs that occurred almost at the same location in the NOAA AR 10484 on 2003 October 22.
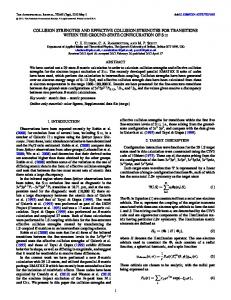
Figure 1 shows the evolution of this AR from 2003 October 21 to 23 in the TRACE WL images and SOHO/MDI 96 minute lineof-sight magnetograms. The white boxes denote the position of the small sunspot with positive polarity and the black boxes denote the position of the small sunspot and large rotating sunspot with negative polarities, respectively. The large rotating sunspot was defined as a type IIa rotating sunspot according to the classification in the paper of Yan et al. (2008b). The solid white and black lines are the contours of the positive and negative magnetic fields, respectively. The levels of the contours are ±100, ±200, ±500, ±1000 G. The arrows point to the positions of the two small sunspots. “P” and “N” denote the sunspots with positive and negative polarities. From the evolution of this AR in TRACE WL images and SOHO/MDI 96 minute line-of-sight magnetograms, the large rotating sunspot and the small sunspots with negative polarities rotated clockwise about 33◦ and 18◦ , respectively, from the northeast of the quiescent sunspot with negative polarity to the southeast from 15:00 UT on 2003, October 21 to 16:24 UT on 2003 October 23. The trajectory of the large rotating sunspot with negative polarity looks like an arch. Meanwhile, the small sunspot with positive polarity moved from the southeast of the leading sunspot with positive polarity to the northeast (also see Figure 3 of Yan et al. 2008b). However, the leading positive sunspots in the west and the sunspot with positive polarity in the south did not experience any detectable motion.
2. OBSERVATIONS The two successive M-class flares were associated with two CMEs that occurred in the NOAA AR 10484 from 15:06 UT to 16:04 UT on 2003 October 22. The events were observed by several space-board instruments via multi-wavelength observation. The main observations used in the paper are as follows. 1. TRACE white-light (WL), 1600 Å and Fe ix/x 171 Å images with a cadence of about 1 minute and a pixel size of 0.�� 5 (Handy et al. 1999). 2. Full-disk line-of-sight magnetograms taken by the Michelson Doppler Imager (MDI) on board SOHO (Scherrer et al. 1995). Two kinds of MDI full-disk magnetograms were used in this paper: 1 minute and 96 minute cadence data with a spatial resolution of 2�� pixel−1 . 3. The images in the 25–50 keV energy band obtained by RHESSI (Lin et al. 2002). 4. GOES12 soft X-ray flux in the range of 0.5–4 Å and 1–8 Å. 5. LASCO (Brueckner et al. 1995) C2 on board SOHO (Domingo et al. 1995). 6. Full-disk Fe xii 195 Å images from the Extreme-ultraviolet Imaging Telescope (EIT) on board SOHO (Domingo et al. 1995) with a cadence of 12 minutes and a pixel size of 2.�� 6 (Delaboudini`ere et al. 1995).
3.2. The Collision of the Two Small Sunspots Figure 2 shows the detailed evolution of the two small sunspots with opposite magnetic polarities and motional directions from 2003 October 21 to October 22. The upper panel denotes the motions of the two small sunspots in TRACE WL images while the lower panel denotes the magnetic evolution of the two sunspots seen from 96 minute magnetograms. The arrows denote the change of the positions of the two sunspots. “P” and “N” denote the same meaning as Figure 1. The three dashed lines in the upper panel of Figure 2 are used to define the start and the end of the collision. Line 1 is parallel to the equator and crosses the center of the positive sunspot. Lines 2 and 3 are also parallel to the equator and denote the south forefront and the north back end of the small sunspot with negative polarity. Where line 1 and line 2 overlap each other is defined as the start of the collision. Where line 1 and line 3 overlap each other is defined as the end of the collision. From the change of the positions of the three lines seen from Figure 2 in TRACE WL images, the two small sunspots with opposite polarities began to collide at 07:02 UT and the collision ended at 23:05 UT on October 22. The sunspot with positive polarity moved from the south to the north and the sunspot with negative polarity moved in the opposite direction. From the magnetogram at 14:27 UT in Figure 2, one can see that the two small sunspots collided with each other. The upper panel of Figure 3 shows the change of the distance between the geometric center of the small sunspot with positive polarity and the south forefront of the small sunspots with negative polarity every hour. The lower panel of Figure 3 denotes the speeds of the two sunspots every hour (the black line is the speed of the sunspot with positive polarity; the red line is the speed of the sunspot with negative polarity). The two vertical dashed lines in Figure 3 indicate the onset of the two M-class flares and the two vertical solid lines denote the start and end of the collision marked by double arrows.
We used the TRACE WL and full-disk line-of-sight 96 minute magnetograms to show the evolution of the photosphere of NOAA AR 10484. Full-disk line-of-sight 1 minute magnetograms are used to present the change of magnetic fields at PIL during the two flares. The TRACE 171 Å images are used to present the change of the topology of magnetic fields in the corona. All the data of space-board instruments are disposed of by the standard Solar Software (SSW) codes before further analysis. 3. THE ANALYSIS OF THE SUCCESSIVE ERUPTIONS 3.1. The Evolution of the Whole Active Region NOAA AR 10484 is a very complex AR that exhibited beta, gamma, and delta magnetic configuration on 2003 October 22. This AR produced many C-class and M-class flares from its appearance to its disappearance on the solar disk. The 1N/M1.9 confined flare in this AR on 2003 October 20 has been studied by Li et al. (2005). 2
The Astronomical Journal, 143:56 (8pp), 2012 March
Yan, Qu, & Kong
Figure 1. Left column: a sequence of TRACE white-light images. Right column: a sequence of SOHO/MDI magnetograms. The white and black boxes denote the small sunspot with positive polarity and the small and large rotating sunspots with negative polarities, respectively. The solid white and black lines in the right column are the contours of the positive and negative magnetic field strengths, respectively. The levels of the contours are ±100, ±200, ±500, ±1000 G. The field of view of the images is 200�� × 200�� . The arrows point to the positions of the two small sunspots with time. “P” and “N” denote the sunspots with positive and negative polarities, respectively. The box of the dashed lines are the field of view (FOV) of Figure 5.
The distance between the two small sunspots decreased rapidly from 15:00 UT to 23:00 UT on October 21. In the next 10 hours, relative motion slowed down before the collision. After the collision the increase of the distance has approximately the same rate as that after the occurrence of flares. The two M-class flares just occurred in the middle of the collision of the two small sunspots. Before the occurrence of the two flares, the speed amplitude of the two sunspots decreased gradually
from 08:00 UT to 15:00 UT on October 22. After the two flares, the speed of the two sunspots increased abruptly at 20:00 UT. The average speed before the collision is 4501.2 km hr−1 for the sunspot with positive polarity and 3920.4 km hr−1 for the sunspot with negative polarity. During the collision, the average speed is 3902.6 km hr−1 for the positive sunspot and 3847.8 km hr−1 for the negative sunspot. The average speed became 5009.4 km hr−1 for the positive sunspot and 3
The Astronomical Journal, 143:56 (8pp), 2012 March
Yan, Qu, & Kong
30
Distance (arcsec)
25 20 15 10 5 15:00 20:00 01:00 06:00 11:00 16:00 21:00 02:00 07:00 Start time (21-Oct-2003 15:00) 3000
Velocity (km/hour)
2500 2000 1500 1000 500
Figure 2. Upper panel shows the motions of the two small sunspots with opposite polarities and motional directions in TRACE WL. The lower panel shows the evolution of the two sunspots seen from 96 minute magnetograms. The arrows denote the positions of the two sunspots with time. “P” and “N” have the same meanings as in Figure 1. The three dashed lines in the upper panel are used to define the start and the end of the collision. Line 1 is parallel to the equator and crosses the center of the positive sunspot. Lines 2 and 3 are also parallel to the equator and denote the south forefront and the north back end of the small sunspot with negative polarity.
0 15:00 20:00 01:00 06:00 11:00 16:00 21:00 02:00 07:00 Start time (21-Oct-2003 15:00)
Figure 3. Upper panel: the change of the distance between the geometric center of the small sunspot with positive polarity and the south forefront of the small sunspots with negative polarity. Lower panel: the speed of the two sunspots (black line: the sunspot with positive polarity; red line: the sunspot with negative polarity). The two vertical dashed lines denote the onset times of the two M-class flares. The two vertical solid lines indicate the start and end of the collision marked by the double arrows.
3775.2 km hr−1 for the negative sunspot after the collision. The average speed of the positive sunspot was a little larger than that of the negative sunspot. From the change of the speed of the positive sunspot, the average speed decreased during the collision and then increased after the collision. The average speed of the small negative sunspot began to decrease from the onset of the collision. 3.3. The Two Successive M-class Flares and CMEs Figure 4 shows the soft X-ray flux observed by GOES12 in the range 0.5–4 Å and 1–8 Å from 14:00 UT to 17:00 UT on 2003 October 22. The two pairs of the dashed vertical lines indicate the start and end of the two M-class flares. According to the soft X-ray flux of GOES12, the first flare started at 15:06 UT, peaked at 15:11 UT, and ended at 15:13 UT and the second flare started at 15:57 UT, peaked at 16:01, and ended at 16:04 UT. The time interval of the two successive M-class flares was 51 minutes. The images at the peak times of the two M-class flares acquired at TRACE 1600 Å can be seen from Figure 5. The bright patches and complex configurations were clearly seen in the chromosphere. The dashed boxes in Figure 1 show the field of view (FOV) of Figure 5. Figure 6 shows the change of the topology of magnetic loops in the corona during the two M-class flares in a sequence of TRACE 171 Å images. The left panel (Figures 6(a)–(g)) denotes the change of magnetic loops during the M1.4 class flare while the right panel (Figures 6(a1)–(g1)) denotes the change of magnetic loops during the M1.2 class flare in the corona, respectively. In the first event, a bright blob of hot plasma in TRACE 171 Å rose marked
Figure 4. Soft X-ray flux observed by GOES12 in the range 0.5–4 Å and 1–8 Å from 14:00 UT to 17:00 UT on 2003 October 22. The two pairs of the dashed vertical lines indicate the start and end time of the two M-class flares.
by the arrows in Figures 6(b) and (c). The onset of the M1.4 flare and the rising of the bright blob were almost simultaneous. The rising motion of this plasma element led to a CME-like eruption. After this eruption, the surrounding magnetic field was reconfigured. Next, the two bright belts of outflow appeared. They are marked by two arrows in Figure 6(d). Figure 7 shows the velocities of the bi-directional outflow during the M1.4 flare. The solid and dashed lines indicate the maximum velocities of 4
The Astronomical Journal, 143:56 (8pp), 2012 March
Yan, Qu, & Kong
Figure 5. Two TRACE images acquired at 1600 Å. The observation time of these images were all close to the peak of the flares. FOV is 120�� × 120�� .
Velocity (Km S-1)
1000 800 600 400 200 0 15:08:06
15:08:32 15:08:58 15:09:24 15:09:50 Start time (22-Oct-2003 15:08:06UT)
15:10:16
Figure 7. Velocities of the bi-directional outflow during M1.4 flare. The solid and dashed lines indicate the maximum velocities of the bi-directional outflow as a function of time, measured from 171 Å images along the two white lines in Figure 6(d).
of hot plasma. This secondary plasma blob was surrounded by magnetic loops at 15:59 UT on October 22 (see Figure 6(b1)). Following the opening of the enclosed magnetic loops, the secondary plasma blob gradually moved upward, then escaped, and finally formed the second CME. The movies of the two flares can be seen in the supplementary online material directly linked with Figure 6. Figure 8 shows the SOHO/LASCO difference images with superposed EIT difference images. The upper panels (Figures 8(a) and (b)) denote the first CME and the lower panels (Figures 8(c) and (d)) denote the second CME seen from SOHO/LASCO. The arrows denote the position of NOAA AR 10484. The bright cores of CMEs were often believed to be the flux ropes indicated by arrows in Figures 8(a) and (d). In order to identify the location of the flares, we superposed the bright patches of the TRACE 1600 Å image at the peak of the flares and RHESSI hard X-ray source at 25–50 KeV on the SOHO/MDI 96 minute line-of-sight magnetograms (see Figure 9). The left column of Figure 9 denotes the magnetograms of SOHO/MDI with TRACE 1600 Å superposed. The contour levels of the intensity of the TRACE 1600 Å images signed by the white lines are 10% and 50% of the maximum values of the images. The right column of Figure 9 denotes the magnetograms of SOHO/MDI with RHESSI 25–50 KeV images superposed. The contour levels of RHESSI images are 60%, 70%, 80%, and 90% of the maximum values of the images. From Figure 9, one can see that the locations of the two flares and the sources of hard X-rays are situated just above the PIL between the two small sunspots.
Figure 6. Sequence of TRACE 171 Å images show the change of the topology of magnetic loops in the corona during two M-class flares. The left panel denotes the change of magnetic loops during the M1.4 class flare while the right panel denotes the change of magnetic loops during the M1.2 class flare in the corona, respectively. The two white solid lines in Figure 6(d) are used to measure the maximum velocities of the bi-directional outflow as a function of time. The arrows are described in the text. (Animations of this figure are available in the online journal.)
the bi-directional outflow as a function of time, measured from 171 Å images along the two white lines in Figure 6(d). Later, the two belts were divided into several bright loops seen from Figures 6(f) and (g). The onset of the M1.2 flare was almost simultaneous with the rising of another bright blob of hot plasma seen from TRACE 171 Å images. The arrows in the right panel of Figure 6 denote the position of the secondary bright blob 5
The Astronomical Journal, 143:56 (8pp), 2012 March
Yan, Qu, & Kong
Figure 8. SOHO/LASCO difference images with superposed EIT difference images. The arrows denote the position of NOAA AR 10484 and the cores of CMEs.
For the purpose of investigating magnetic fields at PILs, we used higher time resolution data of 1 minute magnetograms. Figure 10 shows the change of magnetic fields at PIL during the two M-class flares. The white boxes denote the squeeze of the two opposite polarities. After contouring the 1 minute magnetograms of SOHO/MDI, we found that the magnetic fields of the sunspot with positive polarity near the PIL changed rapidly during the flares. The magnetic fields suddenly squeezed within several minutes near the flares and soon relaxed after the flares. That is to say that the gradient of the magnetic field at PIL increased suddenly just at the onset of the flares. Moreover, we calculated the change of the magnetic flux with positive polarities. Figure 11 shows the evolution of the line-of-sight magnetic flux of the small sunspot with positive polarity during the two M-class flares on 2003 October 22. The dashed vertical lines indicate the start and end of the two M-class flares. One can see that the positive magnetic strengths were not obviously increased before the occurrence of the flares. We have not calculated the magnetic flux of negative magnetic fields because of the negative sunspot motion. This implies that the collision between the two small sunspots is the main reason that resulted in the sudden change of the configuration of the magnetic fields.
using the GOES12 soft X-ray flux; TRACE WL, 1600 Å and 171 Å images; SOHO/MDI 96 minute and 1 minute magnetograms; SOHO/EIT Fe xii 195 Å images and SOHO/LASCO C2 images; and RHESSI hard X-ray images. From the TRACE WL image and SOHO/MDI magnetograms, one can find that the two small sunspots with opposite polarities have opposite motional directions. The successive M-class flares associated with two CMEs occurred just in the middle of their collision. After identifying the location of the successive M-class flares, we found that the two flares occurred almost in the same region. Before the occurrence of these flares, it is found that the longitudinal magnetic fields on the left side of the PIL produced a sudden squeeze to the right side. That is to say, the positive magnetic fields close to the PIL squeezed the negative magnetic fields. These changes occurred within several minutes near the two M-class flares. After calculating the fluxes of positive polarity magnetic fields, we have not found the increase of the fluxes before the flares. We excluded the possibility of the emerging magnetic fields leading to this phenomenon. Consequently, the high gradient between the opposite magnetic polarities was caused by the motion of the two small sunspots. We suggest that the sudden squeeze of the magnetic fields was caused by the change of the magnetic field configuration when the squeeze reached a critical state. The accumulation of the motions of the magnetic fields can cause the high magnetic gradient between the opposite
4. CONCLUSION AND DISCUSSION We investigate two successive M-class flares associated with two CMEs in NOAA AR 10484 on 2003 October 22 6
The Astronomical Journal, 143:56 (8pp), 2012 March
Yan, Qu, & Kong
Figure 9. Left column: the magnetograms of SOHO/MDI with TRACE 1600 Å superposed. The contour levels of the intensity of the TRACE 1600 Å images are 10% and 50% of the maximum value of the images denoted by the white lines. The right column: the magnetograms of SOHO/MDI with RHESSI 25–50 keV images superposed. The contour levels of RHESSI images are 60%, 70%, 80%, and 90% of the maximum value of the images.
Figure 10. Change of magnetic fields at PIL during the two M-class flares. The white boxes denote the position of the squeeze of the two opposite polarities.
magnetic polarities. Our assumption for the process of two flares is that the collision of the two small sunspots results in photospheric stressing transferred to the coronal magnetic fields. The increase of the non-potential fields leads to the instability of the coronal magnetic fields. Finally, the eruptions were triggered. The two M-class flares are all compact flares. The rising of the first and the second plasma blobs appeared almost simultaneous with the onset of the two M-class flares. However, from the
evolution of magnetic fields seen from TRACE 171 Å images, the processes of the two flares are not the same. The first plasma blob was ejected at the previous phase of the M1.4 flare and followed the bi-directional outflow. In the second flare, the second plasma blob gradually moved upward and was ejected at the late phase of the M1.2 flare. The overlying magnetic fields enclosed the secondary plasma blob seen from the TRACE 171 Å images. Following the occurrence of the flare, the overlying magnetic fields were removed and the secondary plasma blob erupted. The 7
Magnetic Flux(1020 Mx)
6.0
Magnetic Flux(1020 Mx)
The Astronomical Journal, 143:56 (8pp), 2012 March
6.0
Yan, Qu, & Kong Antiochos, S. K., DeVore, C. R., & Klimchuk, J. A. 1999, ApJ, 510, 485 Archontis, V., & Hood, A. W. 2010, A&A, 514, 56 Aschwanden, M. J. 2004, Physics of the Solar Corona—An Introduction (Chichester: Praxis), 1 Aschwanden, M. J., Kosugi, T., Hanaoka, Y., Nishio, M., & Melrose, D. B. 1999, ApJ, 526, 1026 Aulanier, G., DeLuca, E. E., Antiochos, S. K., McMullen, R. A., & Golub, L. 2000, ApJ, 540, 1126 Brueckner, G. E., Howard, R. A., Koomen, M. J., et al. 1995, Sol. Phys., 162, 357 Canfield, R. C., Hudson, H. S., & McKenzie, D. E. 1999, Geophys. Res. Lett., 26, 627 Carmichael, H. 1964, in The Physics of Solar Flares, ed. W. N. Hess (NASA Special Publication, Vol. 50; Washington, DC: NASA), 451 Chandra, R., Schmieder, B., Mandrini, C. H., et al. 2011, Sol. Phys., 269, 83 Chen, P. F., & Shibata, K. 2000, ApJ, 545, 524 Cui, Y. M., Li, R., Wang, H. N., & He, H. 2006, Sol. Phys., 242, 1 Delaboudini`ere, J. P., Artzner, G. E., Brunaud, J., et al. 1995, Sol. Phys., 162, 291 Deng, Y., Wang, J., Yan, Y., & Zhang, J. 2001, Sol. Phys., 204, 11 DeVore, C. R., & Antiochos, S. K. 2008, ApJ, 680, 740 Domingo, V., Fleck, B., & Poland, A. I. 1995, Sol. Phys., 162, 1 Forbes, T. G. 2000, J. Geophys. Res., 105, 23153 Forbes, T. G., & Priest, E. R. 1995, ApJ, 446, 377 Fan, Y. 2010, ApJ, 719, 728 Fan, Y., & Gibson, S. E. 2007, ApJ, 668, 1232 Gibson, S. E., Fan, Y., T¨or¨ok, T., & Kliem, B. 2006, Space Sci. Rev., 124, 131 Gopalswamy, N., Nitta, N., Manoharan, P. K., Raoult, A., & Pick, M. 1999, A&A, 347, 684 Hagyard, M. J., Teuber, D., West, E. A., et al. 1984, Sol. Phys., 91, 115 Handy, B. N., Acton, L. W., Kankelborg, C. C., et al. 1999, Sol. Phys., 187, 229 Hirayama, T. 1974, Sol. Phys., 34, 323 Hood, A. W., & Priest, E. R. 1979, Sol. Phys., 64, 303 Hood, A. W., & Priest, E. R. 1980, Sol. Phys., 66, 113 Hudson, H. S., & Cliver, E. W. 2001, J. Geophys. Res., 106, 25199 Kopp, R. A., & Pneuman, G. W. 1976, Sol. Phys., 50, 85 Li, H., Berlicki, A., & Schmieder, B. 2005, A&A, 438, 325 Li, H., Schmieder, B., Song, M. T., & Bommier, V. 2007, A&A, 475, 1081 Lin, J., & Forbes, T. G. 2000, J. Geophys. Res., 105, 2375 Lin, R. P., Dennis, B. R., Hurford, G. J., et al. 2002, Sol. Phys., 210, 3 Liu, C., Lee, J., Karlicky, M., et al. 2009, ApJ, 730, 757 Low, B. C. 1977, ApJ, 212, 234 Moon, Y. J., Choe, G. S., Park, Y. D., et al. 2002, ApJ, 574, 434 Moore, R. L., Sterling, A. C., Hudson, H. S., & Lemen, J. R. 2001, ApJ, 552, 833 Pearce, G., & Harrison, R. A. 1990, A&A, 228, 513 Priest, E. R., & Forbes, T. G. 2002, A&AR, 10, 313 Pevtsov, A. A. 2002, Sol. Phys., 207, 111 Rust, D. M., & Labonte, B. J. 2005, ApJ, 622, L69 Sakajiri, T., Brooks, D. H., Yamamoto, T., et al. 2004, ApJ, 616, 578 Scherrer, P. H., Bogart, R. S., Bush, R. I., et al. 1995, Sol. Phys., 162, 169 Schrijver, C. J. 2007, ApJ, 665, L117 Srivastava, A. K., Zaqarashvili, T. V., Kumar, P., & Khodachenko, M. L. 2010, ApJ, 715, 292 Sterling, A. C., & Moore, R. L. 2001, J. Geophys. Res., 106, 25227 Sturrock, P. A. 1966, Nature, 211, 695 Tian, L., & Alexander, D. 2006, Sol. Phys., 233, 29 T¨or¨ok, T., Kliem, B., & Titov, V. S. 2004, A&A, 413, L27 van Ballegooijen, A. A., & Martens, P. C. H. 1989, ApJ, 343, 971 Wang, H., Chae, J., Yurchyshyn, V., et al. 2001, ApJ, 559, 1171 Wang, H., Liu, C., Qiu, J., et al. 2004, ApJ, 601, 195 Wang, H. M., Liu, C., Jing, J., & Yurchyshyn, V. 2007, ApJ, 671, 973 Wang, H. M., Song, H., Jing, J., et al. 2006, Chin. Astron. Astrophys., 6, 477 Wang, J. X. 1994, Sol. Phys., 155, 285 Wheatland, M. S., & Craig, I. J. D. 2006, Sol. Phys., 238, 73 Yan, X. L., & Qu, Z. Q. 2007, A&A, 468, 1083 Yan, X. L., Qu, Z. Q., & Kong, D. F. 2008b, MNRAS, 391, 1887 Yan, X. L., Qu, Z. Q., & Kong, D. F. 2011, MNRAS, 414, 2803 Yan, X. L., Qu, Z. Q., & Xu, C. L. 2008a, ApJ, 682, L65 Yan, X. L., Qu, Z. Q., Xu, C. L., Xue, Z. K., & Kong, D. F. 2009, Res. Astron. Astrophys., 9, 596 Zhang, J., Li, L., & Song, Q. 2007, ApJ, 662, L35 Zhang, J., Wang, J., Deng, Y., & Wu, D. 2001, ApJ, 548, L99 Zirin, H., & Tanaka, K. 1973, Sol. Phys., 32, 173
5.5 5.0 4.5 4.0 14:50
15:00
15:10 15:20 Time (UT)
15:30
15:50
16:00 16:10 Time (UT)
16:20
5.5 5.0 4.5 4.0 15:40
Figure 11. Evolution of the line-of-sight magnetic flux of the small sunspot with positive polarity during the two M-class flares on 2003 October 22. The dashed vertical lines indicate the start and end of the two M-class flares.
following points are important for the two successive events. First, as the two sunspots have opposite motional directions, the magnetic fields between them must be sheared. Second, as the separation between them decreased and finally collided, there was a convergence motion of the two sunspots before the flares. Starting with a simple bipolar magnetic arcade, van Ballegooijen & Martens (1989) proposed that the shearing and converging footpoint motions will force magnetic reconnection between the arcade magnetic field lines, gradually transforming the arcade magnetic field lines into a twisted flux tube. The twisted flux tube is driven upward and may evolve into a CME. Our interpretation is that the mechanism of the two flare–CME events is closely associated with the loss of equilibrium of the sheared and twisted core fields via shearing/converging motion(s) and reconnection (Amari et al. 1999; Forbes & Priest 1995; Priest & Forbes 2002; Lin & Forbes 2000). The result implies that the collision between the small sunspots with opposite polarities can produce large flares and CMEs. These results could contribute to understanding the mechanism of flares and CMEs. The authors thank the referee for a careful reading of the manuscript and constructive comments which improved the original version. The authors thank the TRACE, SOHO, and GOES consortia for their data. SOHO is a project of international cooperation between ESA and NASA. This work is supported by the National Science Foundation of China (NSFC) under grant numbers 10903027, 11078005, and 10943002, the Yunnan Science Foundation of China under number 2009CD120, and the National Basic Research Program of China 973 under grant number G2011CB811400. REFERENCES Amari, T., Luciani, J. F., Mikic, Z., & Linker, J. 1999, ApJ, 518, L57 Antiochos, S. K. 1998, ApJ, 502, L181
8