International Journal of Computer Communication and Information System ( IJCCIS) – Vol2. No1. ISSN: 0976–1349 July – Dec 2010
Suitability Assessment of TPM through Fuzzy Based Simulation Model B.Vijaya Ramnath1, and V.R.Raman Bharath2 1
Research Scholar, Dept. of Production Technology, M.I.T. Campus, Anna University, Chennai-600044, India. Email:
[email protected] 2 P.G.Student, (M.E. CAD/CAM), Sri Sai Ram Engineering College, Chennai- 600 044, India. Email:
[email protected]
Abstract— In the present scenario all the companies concentrate on producing quality products with low cost. The success of an industry depends on its product’s quality, cost and delivery time. In order to achieve above said factors, the maintenance policy adopted in the industry should be perfect and easy to implement. So, now a days all manufacturers are trying to implement new manufacturing methods for their production process. In this paper, an attempt has been made to find the suitability of Total Productive Maintenance (TPM) in a leading steering manufacturing company in India. Even though lot of Multi Criteria Decision Making (MCDM) models like AHP, ANP and PVA are available, a Fuzzy Based (FB) model is necessary to assure the suitability by considering important factors and simulate the factors with data given by the experts in those fields. This paper mainly focused on the modeling of a ‘Fuzzy Based Simulation’ for finding the suitability of the TPM by considering the following important factors: Quality, cost, delivery time. Index Terms— TPM, Fuzzy Based model (FB model), Quality, Cost, and Delivery time. I. INTRODUCTION Guiffrida and Nagi (1998) have developed a Mathematical programming approaches include only tangible criteria, and have been extensively used for vendor selection. They include fuzzy programming, utility theory and chance constrained programming, utility theory and interval programming. fuzzy goal programming, interval-programming, mixed integer nonlinear programming, and stochastic integer programming. Holland (1995) have proposed a integrated fuzzy multiple criteria decision making (MCDM) techniques for solving vendor selection problems, he utilized triangular fuzzy numbers to express the subjective preferences of evaluators with respect to the considered criteria, and also use the criterion gauges to evaluate a well-known high-tech manufacturing company. McKone et al (1998) explored the contextual differences of plants to better understand what types of companies have adopted TPM programs. They propose
258
a theoretical framework for understanding the use of TPM and how it depends on managerial factors such as Just-in-Time (JIT), Total Quality Management (TQM) and Employee Involvement (EI) as well as environmental and organizational factors such as country, industry and company characteristics. They tested this framework using data from 97 plants in three different countries to determine what types of companies are most likely to aggressively pursue TPM practices. They found that specific contextual variables explain a significant portion of the variance in the level of TPM implementation. Their results indicated that while environmental contextual factors, such as country, help to explain differences in TPM implementation, managerial contextual factors, which are under the direction of plant management, are more important to the execution of TPM programs. McKone et al (2000) investigated the relationship between Total Productive Maintenance (TPM) and manufacturing performance (MP) through Structural Equation Modeling (SEM). They found that TPM has a positive and significant relationship with low cost (as measured by higher inventory turns), high levels of quality (as measured by higher levels of conformance to specifications), and strong delivery performance (as measured by higher percentage of on-time deliveries and by faster speeds of delivery). They also found that the relationship between TPM and MP can be explained by both direct and indirect relationships. In particular, there is a significant and positive indirect relationship between TPM and MP through Just-In-Time (JIT) practices. Chand and Shirvani (2000) conducted an investigation in collaboration with a first tier automotive component supplier to determine the overall equipment effectiveness (OEE) of a semi-automated assembly cell. The big losses associated with equipment effectiveness were also identified. The production output of the cell over the observed period was 26 515. This represents 97% good components, 0.33% scrap and 2.67% rework. The number of stoppages recorded was 156, where the 10 most common causes were identified. The OEE was 62% and the six big losses represent 38% loss of the productive time. Based on the findings, it was recommended that a pilot project to be
International Journal of Computer Communication and Information System ( IJCCIS) – Vol2. No1. ISSN: 0976–1349 July – Dec 2010 conducted to implement a TPM programme for the cell and expand it further to the other cells in the factory Cua et al (2001) investigated the practices of the three programs simultaneously. They found that there is evidence supporting the compatibility of the practices in these programs and that manufacturing performance is associated with the level of implementation of both socially- and technically-oriented practices of the three programs. Chan et al (2003) aimed to study the effectiveness and implementation of the TPM programme for an electronics manufacturing company. Through a case study of implementing TPM in an electronics manufacturing company, the practical aspects within and beyond basic TPM theory, difficulties in the adoption of TPM and the problems encountered during the implementation are discussed and analysed. Moreover, the critical success factors for achieving TPM are also included based on the practical results gained from the study. After the implementation of TPM model machine, both tangible and intangible benefits are shown to be obtained for equipment and employees respectively. The productivity of the model machine increased by 83%. Kumar and Vrat (2004) developed a fuzzy goal programming approach to deal with the effect of information uncertainty in the objectives of vendor selection process, and showed how the quota allocation of vendors is varied with uncertainty. Eti et al (2004) explores the ways in which Nigerian manufacturing industries can implement TPM as a strategy and culture for improving its performance and suggests self-auditing and bench-marking as desirable prerequisites before TPM implementation.
subjective preferences of evaluators with respect to the considered criteria. In addition, a relationship map is constructed to identify the independence or interdependence of the sub-criteria of a criterion by using interpretive structural modeling (ISM). A suitable TPM method is expressed by the following equation: ‘Suitable TPM method’ = f[quality, cost, delivery time] (Eq. 1) Therefore the above equation is optimized with use of fuzzy logic. In recent years, a number and variety of applications of fuzzy logic have increased significantly. The applications range from consumer products such as cameras, two wheelers, washing machines, televisions, cell phones and microwave ovens to industrial process control, medical instrumentation, decision-support systems, and portfolio selection. Here the work focuses on identifying the suitability of TPM by Fuzzy Based Simulation (FBS) model. Therefore, the most important factors like Quality, Cost, Delivery time are taken into account. Fuzzy Logic Toolbox with MATLAB is a tool for solving problems with fuzzy. The result shows that the selection of TPM is acceptable and suitable for the case situation considered. II. HELPFUL HINTS The fuzzy inference system contains the following major five steps. They are i) Fuzzifier, ii) Rule base, iii) Fuzzy inference engine, iv) Defuzzifier and v) output quantity. The fuzzy inference system is shown in Figure 1.
Ghodsypour and O’Brien (1998) proposed an integration of an analytical hierarchy process and linear programming to consider both tangible and intangible factors in choosing the best vendors and placing the optimum order quantities among them such that the total value of purchasing is maximized. Karthick (2008) has proposed an integrated multi criteria supplier selection process and use of PVA in the actual selection process. He also developed a program in MATLAB to calculate the aggregated performance measure for each supplier. Category analysis is also performed for certain significant criteria to see how the alternatives perform with respect to a significant criterion. Jiann Liang Yang et al. (2008) proposed an integrated fuzzy multiple criteria decision making (MCDM) techniques for vendor selection problems. Jiann utilized triangular fuzzy numbers to express the
259
Figure 1. A. Fuzzification for suitability of TPM: The fuzzification process is performed during run time and consists of assigning membership degrees to Quality, Cost, and Delivery time. The Figure 2 shows the fuzzification process of a fuzzy logic system with input and output being fuzzified with suitable membership function. Here the inputs are the factors like Quality, Cost, and Delivery time. The output is the result whose value shows whether to accept, under consider or reject the selection of TPM as shown in Figure 3.
International Journal of Computer Communication and Information System ( IJCCIS) – Vol2. No1. ISSN: 0976–1349 July – Dec 2010
Figure 2. Figure 4. Cost: Cost is measured by the value of the product.. The categories in the measure are very less, acceptable less, optimum, acceptable high, very high. If the cost is less or more than 6% of required value then it is considered as very high or very less. If the cost is between 3-5% less or greater then the required value then it is considered as acceptable less or acceptable high. If the cost is 2% less or greater than the required value then it is considered as optimum. The transfer function in fuzzy format is shown in Figure 5.
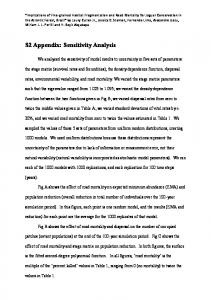
Figure 3. Delivery time: Delivery time is the time required to deliver the product completely according to customer requirement.. The categories in the measure are late, delay, in time, early, very early. If delivery time is between 10 – 20 % less or more than the actual delivery time it is considered as very late or very early. Similarly if delivery time is between 5 – 15% less or greater then the actual delivery time, is considered as late or early... In time is less or more than 5% the actual delivery time. The transfer function in fuzzy format is shown in Figure 4.
Table 2. Range for cost measurement Fuzzy
Linguistic Variable
Range
1. 2. 3. 4. 5.
Very less Acceptable less Optimum Acceptable high Very high
-6 -5 to -3% -2 to 2% 3 to 5% 6%
Table 1. Range for Delivery Time
Fuzzy
Linguistic Variable
Range
1.
Very early
-20 to 10
2.
early
-15 to -5
3.
in time
-5 to 5
4.
late
5 to 15
5.
Very late
10 to 20 Figure 5. Quality: Quality is measured by how extent the product serve for its use. If the quality is less or more than 6%
260
International Journal of Computer Communication and Information System ( IJCCIS) – Vol2. No1. ISSN: 0976–1349 July – Dec 2010 of required quality, then it is considered as very less or very high. If the actual quality is less or greater than 45% of the quality, then it is considered as less or high. If the quality is 3% less or greater than the required quality, then it is considered as optimum. The transfer function in fuzzy format is shown in Figure 6. Table 3. Range for quality measurement Fuzzy
Linguistic Variable
Range
1. 2. 3. 4. 5.
Very Less Less Optimum High Very High
-6 -5 to -3% -3 to 3% 4 to 5% 6%
III. FUZZY EVALUATION RULES (IF- THEN RULES) These if-then rule statements are used to formulate the conditional statements that comprise fuzzy logic. A single fuzzy if-then rule assumes the form “if x is A then y is B” where A and B are linguistic values defined by fuzzy sets. The if-part of the rule “x is A” is called the premise, while the then-part of the rule “y is B” is called the conclusion. There are 75 rules following the format ‘if (condition a) and (condition b) and (condition c) then (result c)’ corresponding to the combination of input conditions is shown in Figure 8. For example, ‘if delivery time is less’ and ‘cost required is acceptable less ‘ and ‘quality is less’ then the result is ‘the system is acceptable’. The rules are formed with the expert knowledge, feedback and guidance given by experts in the manufacturing industries and are further refined with experienced persons in the field of operation, production management and are further refined, following real life application and appraisal which will either confirm them or require them to be modified. The following Tables 5, 6, and 7 shows the formation of fuzzy rules. Table 5. Fuzzy rule for delivery time is late: cost quality
Figure 6. Result The result is to decide whether to select the TPM or not. The result value lies between 0 to 4 is considered as reject the TPM, between 4 to 6 is considered as poor and between 6 to 10 is considered as accept the system. The transfer function in fuzzy format is shown in Figure 7.
Very less
less
optimum
high
Very high
Poor
Accept
Accept
Accept
Poor
Reject
Low
Accept
Accept
Poor
Poor
Reject
Medium
Accept
Accept
Poor
Reject
Reject
High
Poor
Poor
Poor
Reject
Reject
Very high
Poor
Reject
Reject
Reject
Reject
Table 6. Fuzzy rule for delivery time is in time cost Very less
less
Optimum
high
Very high
Poor
Accept
Accept
Poor
Poor
Reject
Low
Accept
Accept
Poor
Poor
Reject
Medium
Accept
Poor
Poor
Reject
Reject
High
Poor
Poor
Reject
Reject
Reject
Very high
Reject
Reject
Reject
Reject
Reject
quality
Table 4. Range for Result-output measurement
Fuzzy 1. 2. 3.
Linguistic Variable Accept Under consider Reject
Range 6 to 10 3 to 6 0 to 3
Table 7. Fuzzy rule for delivery time is early’ cost quality poor
Figure 7.
261
Very less
less
optimum
high
Very high
Poor
Poor
Reject
Reject
Reject
low
Poor
Reject
Reject
Reject
Reject
medium
Reject
Reject
Reject
Reject
Reject
high
Reject
Reject
Reject
Reject
Reject
Very high
Reject
Reject
Reject
Reject
Reject
International Journal of Computer Communication and Information System ( IJCCIS) – Vol2. No1. ISSN: 0976–1349 July – Dec 2010 REFERENCES [1] G. Chand, B. Shirvani. "Implementation of TPM in cellular manufacture", Journal of Materials Processing Technology, Vol. 103, No.1, pp. 149-154, 2000.
[2] F. T. S. Chan, H. C. W. Lau, H. K. Chan, and S. Kong. "Implementation of total productive maintenance: A case study", 2005.
[3] M. C. Eti,, S. O. T. Ogaji, and S. D. Probert. "Implementing total productive maintenance in Nigerian manufacturing industries", Applied Energy, Vol. 79, No. 4, pp. 385-401, 2004.
[4] A.Farnaz and C. Hayes", A comparison of two multi-criteria decision making Techniques", IEEE, 2003.
[5] O.Kristy. C.Kathleen, E. McKone, and G. Schroeder. "Relationships between implementation of TQM, JIT, and TPM and manufacturing performance", Journal of Operations Management, Vol.19, No.6, pp.675-694, 2001.
[6] R.Marceloand and K. Hatakeyama. "Analysis of the fall of TPM
Figure 8. IV. FUZZY SOLUTION RESULTS A continuum of fuzzy solutions for equation (1) is presented in Figure 9 using the fuzzy tool box of MATLAB. The three inputs can be set within the upper and lower specification limits and the output response is calculated as a score that can be translated into linguistic terms. In this instance the order output of 6.79 indicates “Accept” linguistically from Table 4.
in companies", Journal of Materials Processing Technology, Vol. 179, No. 1-3, pp 276-279, 2006.
[7] E.Kathleen, McKone, G. Schroeder and O.Cua. "The impact of total productive maintenance practices on manufacturing performance", Journal of Operations Management, Vol. 19, No. 1, pp 39-58, 2001.
[8] E.Kathleen, McKone, G. Schroeder and O.Cua. "Total productive maintenance: a contextual view", Journal of Operations Management, Vol. 17, No.2, pp. 123-144, 1999.
[9] L.Jorge and P.Lafont. "Installation of a T.P.M. program in a caribbean plant", Computers & Industrial Engineering, Vol. 33, No. 1-2, pp. 315-318, 1997.
[10] S.Ricky and B. Hawkins."TPM", Lean Maintenance, pp.55-104, 2004.
[11] H.Shih, H.Shyur and S.Lee. "An extension of TOPSIS for group decision making", Mathematical and Computer Modeling, Vol.45, pp.801-813, 2006.
[12] A.J. Thomas, G.R. Jones and P. Vidales. "An Integrated Approach to TPM and Six Sigma Development in the Castings Industry ", Intelligent Production Machines and Systems, pp. 620-625, 2006.
[13] J.Yang, H.Chiu, G. Tzeng and R.Yeh. "Vendor selection by integrated fuzzy MCDM techniques with independent and interdependent relationships" International Journal of Information Sciences, Vol.178, pp.623-642, 2008.
[14] M.Kumar and P.Vrat. "A fuzzy goal programming approach for vendor selection problem in a supply chain", Computer & Industrial Engineering, Vol.46, pp.69-85, 2004.
[15] L.Baoding and L.Yankui. "Expected value of fuzzy variable and fuzzy expected value model", IEEE Transactions on Fuzzy Systems, Vol.10, 445-450, 2002.
[16] L.Xiang and L.Baoding. "A sufficient and necessary condition
Figure 9. CONCLUSION This paper introduced a new model known as ‘Fuzzy Based Simulation’ (FBS) for finding suitability of TPM in aleading steering company in india. The model considered the important factors like Quality, Cost, Delivery time. This has been seen that the value of result is above 5. As per the Fuzzy range for result, the TPM is suitable and acceptable for the case situation considered in this paper.
262
for credibility measures", International Journal of Uncertainty, Fuzziness & Knowledge-Based Systems, Vol.14, 527-535, 2006.
[17] M.Taghi and D.Mirheydari. "A new framework for evaluation and prioritization of supplier's using a Hierarchy Fuzzy TOPSIS", Proceedings of world academy of science, Vol.31, 118, 2008.
[18] L.Saaty. "How to make a decision - The Analytic Hierarchy Process," European Journal of Operational Research, Vol.48, 9-26, 1990.