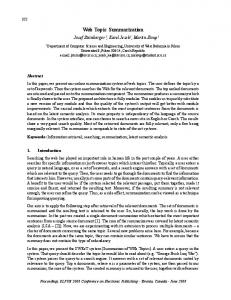
Feb 27, 2004 - pharmaceutical companies and telecoms. The FTSE 100 index rose 0.6 per cent to 4,544.6 and the mid-cap FTSE 250 added 0.4 per cent at.
Summarization of Multimodal Information1 Saif Ahmad, Paulo C F de Oliveira and Khurshid Ahmad Department of Computing, University of Surrey Guildford, Surrey, GU2 7XH, UK {s.ahmad, p.oliveira and k.ahmad}@surrey.ac.uk Abstract Information Summarization is one of the key challenges for current and future information systems. In this paper, we will outline a system that comprises modules for summarizing texts and time series to study the link between the two. Summaries of texts are generated using a lexical analysis of cohesion in texts focusing on key sentences that provide cohesion: by implication, these are the sentences that comprise chief points of a given text. Time series summarization is accomplished using the so-called wavelet analysis to separate out the trend, cyclical fluctuations and autocorrelational effects and generating verbal signals to describe each phenomenon. Finally, we present a case study performed on the UK financial market with regards to multimodal information processing, namely textual and numerical summarization.
1 Introduction The Oxford English Dictionary defines multimodal as “characterized by several different modes of occurrence or activity; incorporating or utilizing several different methods or systems”. With the advent of the Internet and online data vendors (for example Reuters and Bloomberg), data availability is no longer a problem. The information provided by these data vendors is not restricted to text alone. In fact, information is provided in different modes ranging from text, graphics, video, sound, etc. If we look at sectors of a financial market as reported in financial newspapers, we find information with two distinct modes of expression namely textual and numeric. The textual information comprises financial news stories whereas the numeric information is essentially time series plots of financial instruments. This widening concept of “information or knowledge” makes it necessary to process multimodal information with a unified perspective, which demands for integrating various techniques, such as image and video processing, time series analysis and general text processing techniques. Typically, summaries are understood as abridgements of natural language text documents – chief points, sum or substance of a matter (Mani, 2000). More recently, the notion of finding “chief points” has been extended to time series (Boyd, 1998) and (Sripada et al, 2001), and to video sequences. Perhaps sometimes in the future, one can talk about a system which will be able to synthesize the chief points about a matter from texts, and if relevant, time serial data and video sequences. In this paper, we will outline a system that comprises modules for summarizing texts and for summarizing time series. Summaries of texts are generated using a lexical analysis of cohesion in texts focusing on key sentences that provide cohesion: by implication, these are the 1
To appear in the proceedings of LREC 2004, Lisbon, Portugal.
sentences that comprise chief points of a given text (Hoey, 1991). Time series summarization can be accomplished using the so-called wavelet analysis (Daubechies, 1996) to separate out the trend, cyclical fluctuations and autocorrelational effects and generating verbal signals to describe each phenomenon. The text and time-series components are used in the analysis of financial market movements in conjunction with the SATISFI system (Taskaya and Ahmad, 2003) developed at the University of Surrey under the auspices of the EU sponsored GIDA project (IST-2000-31123). Traders want to make a note of “turning” points in the time series data, i.e. when did the market start to fall or rise or what were the days on which the market fell or rose. Subsequent to this identification of tuning points, they wish to check on the news prior-to, on, or after-the rise or fall. Here, accurate summaries of financial news texts appear to be useful in that a mere display of a headline seldom suffices, as headlines do not have the discriminating power for examining the content of the texts. In financial newspapers we often come across a news story that talks about the performance of the market and shows a time series as a “picture illustration” accompanying the text. Figure 1 shows an excerpt from the Financial Times Online (www.ft.com). The picture illustration shows the FTSE 100 time series while the accompanying text talks about the markets in London. The graph of the FTSE 100 shows an uptrend in the latter half and a text defines this uptrend in percentage and even gives the value to which it rises (highlighted yellow in Figure 1). Stronger telecom stocks push London higher By Chris Flood Published: February 27 2004 9:13 | Last Updated: February 27 2004 12:36 Equity markets in London moved ahead by noon in the final session of the week, helped by a stronger showing from the engineering sector, pharmaceutical companies and telecoms. The FTSE 100 index rose 0.6 per cent to 4,544.6 and the mid-cap FTSE 250 added 0.4 per cent at 6,281.4 by 1200 GMT.
Figure 1: Excerpt from Financial Times Online Here, the concise reporting about the London markets can be regarded as a textual summary whereas the description of the FTSE 100 trend (highlighted yellow) can be regarded as a time series summary.
1.1 Chief Points of Collateral Texts Consider again the news accompanying the time series in Figure 1. The news headline is one of the main chief points: ‘Stronger telecom stocks push London higher’. This is a summary, which, however, requires considerable real-world knowledge: London stands for the London Stock Exchange and ‘higher’ is an abbreviation for ‘higher values of the index’. The summary appears quite cryptic without the background knowledge of the
The time series in Figure 1 can be summarized by suggesting that it has three major peaks and two major valleys and additionally has a number of minor peaks and valleys. The average value of the FTSE index is around 4500 and there is an observable uptrend Monday onwards. Furthermore, one can argue that the time between two peaks – one on Tuesday and the other on Friday is 72 hours and perhaps this cycle will persist. However, there are sections of rapid fluctuations – during Tuesday and Thursday. The “chief points” of a time series are thus the cycles, trends and fluctuations. Violently fluctuating time series, when the first difference varies between positive (a rising series), or negative (a falling series) are said to have high volatility. If all the predictable patterns including cycles, trends and fluctuations are subtracted from a time series, then what is left is a set of random numbers – the socalled “shocks” in the system. These numbers are usually distributed according to a random distribution function with well-defined movements. However, if different random distributions are required over a period of time then the series is called nonstationary. A time series is defined usually as an ordered series of numbers. The various changes in the value of the series have different return periods – cyclical changes have different periods, fluctuations or more accurately volatility patterns emerge over a period of time and then never recur and different volatility patterns appear at different times. These return periods manifest themselves as the so-called turning points or edges in a time series.
2 The Approach Figure 2 outlines the basic approach we adopt to process multimodal information. We analyze data provided by Reuters, comprising 5000 stories per day (c.200-500 words/story) in over 150 ad-hoc topics, with a volatile time series – tick data from currency trading comprising 50 ticks per/second over an 8-hour period daily.
Textual Data
1.2 Chief Points of a Time Series
Reuters Feed
Numeric Data
semantic relations that may exist between the keywords in the headlines. The headline of the news item introduces the topics to be discussed, the so-called topic opening sentences; the first sentence in the body has some new words (engineering, equity market, pharmaceutical) but is dominated by words (or topics) already introduced – the so-called central sentences. The text in the Figure 1 is short, otherwise in longer texts there are sentences that introduce no new topics – all words have been introduced in the topic opening and central sentences. Some of the sentences have no links (the marginal sentences) and others have above average of number of links. The sentences with above average links can be collated and be used as a surrogate for the original document – a summary. This summary is more informative than, say, the headline alone. The cohesion link-based network shows the repeating textual patterns in a manner analogous to the time series with its cycles, fluctuations and trends – all the result of the distribution of frequently and rarely used patterns of number distribution.
Text Summarization
Time Series Summarization
Textual Summary
Time Series Summary
Investigate Link / Correlation Buy / Sell Signal
Figure 2: Synthesis of multimodal information The traders mine and fuse this semi-structured and volatile data visually to generate buy/sell signals. Our framework (a) summarizes financial news articles using linguistic resources (e.g. lexical cohesion); (b) summarizes the locally-volatile financial time series in terms of the turning points using wavelet analysis; and (c) facilitates the visualization of the buy/sell signal. In this section, we will define our text summarization and time series summarization modules in greater detail. (a) Text Summarization This module is a computer implementation based on a linguistic theory of text organization called lexical cohesion (Hoey, 1991). Lexical cohesion is the tendency of the sentences in a text to carry information about a certain topic through related words and that provides quality of unity to the text. Hoey has argued that there is a very important connotation of marking cohesion explicitly in a text, which is lexical repetition. In fact, this approach uses the most frequent words of the text, their variants and conceptual relationships to establish connections between sentences in the text. The sentences that have a strong degree of association are selected for the summary. Two key notions were proposed by Hoey. The first key notion is links – which occur whenever there is a repetition of an item in two separate sentences. The second notion is bond – which is established whenever there is an above-average degree of linkage between two sentences. He stressed that the number of links, which constitute a bond, is relative to the type of text and to the average number of links in the text, but normally, three links constitute a bond, in order to avoid accidental repetition. Figure 3 is an excerpt from a financial news file collected from Reuters’ Website (www.reuters.com) and illustrates both concepts. For example, the two sentences (nos. 18 and 20) in Figure 3 are bonded by four links, which together constitute a bond.
May 15, 2002
5239 May 08, 2002
5189 5139 May 07, 2002
5089
3 A Case Study Here, we report about a case study performed on the UK financial market for the month of May in 2002. The textual dataset comprises six financial news stories per day in May 2002 whereas the numeric data is the FTSE 100 index for the same period. Figure 4 below shows the FTSE 100 time series for May 2002 with the trend (green line) and three most
31-May
26-May
1-May
5039
(b) Time Series Summarization Traditional time series analysis methods involve decomposing a series into trend, seasonal variation, other cyclical changes and the remaining “irregular” fluctuations. However, this decomposition can be unique and effective only if certain assumptions about the underlying phenomena of the process are made, for example nonstationarity and volatility. Recently, it has been claimed that the so-called wavelet filtering provides insight into the dynamics of financial time series beyond that of current classical statistical methodology. A number of concepts, for example, nonstationarity, multiresolution, and approximate decorrelation have emerged from wavelet filters (Gençay et al, 2002). Wavelet filtering provides a natural platform to deal with the time-varying characteristics of real-world time series and is not restrained by the assumption of stochastic stability. Wavelet analysis decomposes a time series into several sub-series (A1, D1, D2, … DN), which may be associated with particular time scales. The interpretation of features in complex financial time series is made easy by first applying the wavelet transform and subsequently interpreting each individual sub-series. The extrema of the DWT sub-series detect major edges in the signal and hence correspond to most of the turning points. The recursive DWT filtering process removes long and shortterm fluctuations from the signal in each recursion to give a linear trend in the end. Each recursive component is a time series in its own right. The major cycles within the various components (A1, D1, D2, … DN) can be found using FFT techniques: this technique gives the frequency and amplitude for n/2 periods, where n is the number of data points in the time series. Different frequencies have different amplitudes – or loosely strengths – and in order to judge which of the n/2 cycles within the various components are important, the strength of the period of the signal can usually be determined by computing the Fourier coefficients. The variance change location is detected using the DWT on the volatility time series and making use of the so-called normalized cumulative sum of squares (NCSS) index.
21-May
Signal Trend Turning Point
Figure 3: Example of bonded sentences
16-May
In a related vote, Compaq shareholders are expected on Wednesday to back the deal, catapulting HP into contention against International Business Machines for the title of No. 1 computer company.
significant turning points (circled red) identified by our system.
11-May
20.
In other news, Hewlett-Packard said preliminary estimates showed shareholders had approved its purchase of Compaq Computer -- a result unconfirmed by voting officials.
6-May
18.
Figure 4: FTSE 100 (daily) for May-2002 showing turning points and trend identified by system Table 1 shows our system’s summary output (verbal signal generation) for other features extracted from the FTSE 100 time series data for May 2002. By looking at the system output for the FTSE 100 (Figure 4 and Table 1) we conclude that May 15, 2002 signifies a major turning point in that the trend is an uptrend until this point and a downtrend thereafter. FTSE 100
Feature
(May 2002) Uptrend from 1st to 10th day Trend
SL'(t) = +(8.89) t + 5151.79 Downtrend from 11th to 22nd day SL'(t) = -( 15.99) t + 5426.98
Dominant Cycle
2.66 days Starts on the 2nd day
Variance Change th 5 day Occurs on the
Table 1: FTSE 100 summary output for May-2002 As discussed earlier, traders often want to know the news on and around financial turning points to make buy/sell decisions. In such a scenario, text summarization of news articles published on the day of the turning point and around it gains considerable importance. Table 2 shows the output from our text summarization module for the May 15 turning point, one day before it and one day after it. We have set the text summarization program to produce a one-sentence summary for each of these days so that we can correlate the news easily with the FTSE 100 time series. In Table 2, May 14 summary is good in the sense that it talks about the FTSE 100 “opening higher” the next day. This is supported well by the FTSE 100 index, which shows a peak the next day (May 15) in Figure 4. However, the time series module defines May 15 as a turning point and hence the index or the market is expected to fall from this point onwards.
Day May 14
May 15
May 16
One-sentence News Summary Financial bookmakers in London expect the FTSE 100 to open 10-16 points higher after a close of 5,204.8 and France's CAC-40 to start two points stronger than its close at 4,375.39 points. Retailer Kingfisher dipped 3.5 percent to 372 pence after it made a two billion pound cash call to help it fully buy French-based DIY group Castorama Dubois. The firm reported pre-tax profits of 1.273 billion pounds in its year to end March, slightly above analysts' forecast range of 900 million to 1.25 billion pounds but down 28 percent on the year-ago period reflecting the new, slimmed-down BT Group.
Table 2: News on and around the May 15 turning point The news itself on May 15 (the day of the occurrence of the turning point) in Table 2 talks about the retailer Kingfisher “dipping” – sort of indicating that the market could go down. The trend of FTSE 100 from this day onwards confirms it as a major turning point and the index continues to fall for the remainder of the month. Referring to Table 2 again, the news on May 16 (one day after the turning point) also talks about the British Telecom as “slimmed-down”.
4 System SATISFI The text and time series modules described herein are being used in conjunction with the SATISFI system developed at the University of Surrey (Taskaya and Ahmad, 2003). SATISFI is a multimodal information visualization and synthesis tool. Other capabilities of SATIFI include extracting market sentiment and events from news texts and then correlating it with the FTSE 100 time series; and news categorization using self-organizing maps. Figure 5 shows the SATISFI screenshot.
5 Afterword Information about an event can be disseminated in a number of different modalities: science and technology, finance and business, linguistic modality and that of numbers, are amongst the key modes of interaction. The information supplied in these modes is voluminous and it is important to extract the chief points especially those points that show major changes related to the events. We have described a method for extracting turning points in a fluctuating and volatile time series and suggested ways in which this modality of numbers can be summarised in linguistic statements. Furthermore, we have attempted to introduce two possible uses of linguistic information that accompanies or complements the numerical information. First is the verificational use of the chief points of news streams for investigating the causes of potential turning points identified in the time series analysis. Second is the predictive use of news stories in predicting turning points based entirely on the class of news reported at a given time. The method and analysis described above has been evaluated successfully but with a limited range of experts to both assess the efficacy of the time series summarisation and that of news summarisation. An extended trial involving a larger number of experts is required and is being planned. The other important development related to the trials is the release of the software on the web so the public at large can try. The method will be introduced in our work on the financial Grid project sponsored by the UK ESRC’s initiative on eScience.
Acknowledgments The authors wish to acknowledge the support of the EU-IST GIDA project (IST-2000-31123) and the UK ESRC’s eScience project FINGRID.
References • •
•
Figure 5: System SATISFI screenshot The blue line in Figure 5 depicts the FTSE 100 index whereas the green and red lines depict the upward and downward market movement indicator time series. The user can correlate the market sentiment with the FTSE 100 index and can even shift the series forward and backward to check whether the news precedes the market movement or vice-versa. Moreover, each point on these time series can be double clicked to view the news headlines for that day. Furthermore these news headlines can be double clicked to display the entire news or its summary.
• • •
•
Boyd, S., “TREND: A System for Generating Intelligent Description of Time-Series Data”, Proceedings of the IEEE ICIPS-1998. Daubechies, I., "Where do wavelets come from? – A personal point of view", Proceedings of the IEEE Special Issue on Wavelets, 84 (no. 4), pp. 510--513, April 1996. Gençay, R., Selçuk, F., Whitcher, B., "An Introduction to Wavelets and Other Filtering Methods in Finance and Economics", Academic press, 2002. Hoey, M., Patterns of Lexis in Text, Oxford University Press, 1991. Mani, I., Automatic Summarization, Amsterdam and Philadelphia: John Benjamins Publishing Company, 2000. Sripada, S., Reiter, E., Hunter, J., and Yu, J., “Modelling the task of Summarising Time Series Data using KA Techniques”, In: Macintosh, A., Moulton, M., and Preece, A. (ed), Applications and Innovations in Intelligent Systems IX, Proceedings of ES 2001. Taskaya, T., and Ahmad, K., “Bimodal Visualisation: A Financial Trading Case Study”, IEEE IV03, 7th International Conference on Information Visualisation, London, UK, 2003.