from multiple documents â proves to be an abstractive mental process [Dang ... though they seem to suffer in terms of the legibility of the summary text [Dang.
Summarization System Evaluation Revisited: N-gram Graphs GEORGE GIANNAKOPOULOS and VANGELIS KARKALETSIS National Centre for Scientific Research Demokritos Institute of Informatics and Telecommunications GEORGE VOUROS University of the Aegean AI-Lab – Department of Information and Communication Systems Engineering PANAGIOTIS STAMATOPOULOS University of Athens Department of Informatics and Telecommunications
This paper presents a novel automatic method (AutoSummENG) for the evaluation of summarization systems, based on comparing the character n-gram graphs representation of the extracted summaries and a number of model summaries. The presented approach is language neutral, due to its statistical nature, and appears to hold a level of evaluation performance that matches and even exceeds other contemporary evaluation methods. Within this study, we measure the effectiveness of different representation methods, namely word and character n-gram graph and histogram, different n-gram neighbourhood indication methods, as well as different comparison methods between the supplied representations. A theory for the a priori determination of the methods’ parameters, along with supporting experiments, concludes the study, to provide a complete alternative of existing methods concerning the automatic summary system evaluation process. Categories and Subject Descriptors: I.2.7 [Computing Methodologies]: Natural Language Processing—Text analysis; I.2.7 [Computing Methodologies]: Natural Language Processing— Language models General Terms: Algorithms, Languages, Measurement, Performance Additional Key Words and Phrases: automatic summarization, summarization evaluation, n-gram graph
1.
INTRODUCTION
The over-information commonground of recent information retrieval efforts has created a serious motive for the design and implementation of summarization systems, which are either based on existing information retrieval practices, or provide a
Permission to make digital/hard copy of all or part of this material without fee for personal or classroom use provided that the copies are not made or distributed for profit or commercial advantage, the ACM copyright/server notice, the title of the publication, and its date appear, and notice is given that copying is by permission of the ACM, Inc. To copy otherwise, to republish, to post on servers, or to redistribute to lists requires prior specific permission and/or a fee. c 20YY ACM 0000-0000/20YY/0000-0001 $5.00
ACM Journal Name, Vol. V, No. N, Month 20YY, Pages 1–36.
2
·
G. Giannakopoulos et al.
new point of view on the retrieval process. The value of summarization has been identified in the domain of cognitive psychology, as a means of optimizing learning [Anderson 1985, p.14]. The efforts for automatic extraction of summaries date back to 1958 and Luhn [Luhn 1958], but is still an open issue. The difficulty in the automation of the summarization process is that summarization – especially from multiple documents – proves to be an abstractive mental process [Dang 2005], which is not easy to model (see also [Endres-Niggemeyer 2000]). However, several systems have managed to extract summaries that are rather informative, even though they seem to suffer in terms of the legibility of the summary text [Dang 2005]. On the other hand, the evaluation of summarization systems seems to be non-trivial in itself. 1.1
Motivation
We focus on the problem of evaluating summarization systems in an automated fashion. In recent scientific attempts to evaluate summarization systems, a multitude of problems arose, concerning mostly the inter-judge disagreement as well as the difficulty to automatically determine the quality of a summary. These problems are met mainly within the domain of multi-document summarization, where the synthesis of summaries appears to be more than mere extraction of text snippets [van Halteren and Teufel 2003; Nenkova 2006]. The problem of inter-judge disagreement, as indicated in [van Halteren and Teufel 2003; Lin and Hovy 2002], is the result of human subjectivity in terms of evaluation of summaries: it has been noted that human judges, appointed to grade the quality of a summary, disagree notably between each other on the grades assigned to different summaries. Several methodologies have been examined to systematize the grade assignment process, aiming at smoothing or nullifying the disagreement caused by methodology-specific practices [Nenkova 2006; Radev et al. 2000; Marcu 2000; Saggion and Lapalme 2002]. If one fails to create a methodology for humans to correlate vigorously to each other on the process of evaluation, then either the process of evaluation cannot be modeled objectively, which would be interesting to examine further by itself, or we need to define the process of summarization and its evaluation more precisely (for a more thorough discussion see [Giannakopoulos et al. 2006]). On the other hand, the rankings posed by human grading over summarization systems correlate strongly. This indicates that people tend to prefer the same systems over other systems, which leads, as we will shortly present, to research concerning automatic evaluation methods that produce similar rankings. In order to achieve the ranking, several attributes of summarization systems have to be examined and graded. These attributes are based on the qualities of the output summaries. The problem of automatically determining the quality of a given summary appears to be approached using two different perspectives: either by intrinsic or extrinsic evaluation [Mani and Bloedorn 1997; van Halteren and Teufel 2003]. Intrinsic evaluation operates on the characteristics of the summary itself, independent of the domain it may be used, trying for example to capture how many of the ideas expressed in the original sources appear in the output. On the other hand, extrinsic evaluation decides upon the quality of a summary depending on the effectiveness of ACM Journal Name, Vol. V, No. N, Month 20YY.
Summarization System Evaluation Revisited: N-gram Graphs
·
3
using the latter for a specified task. Such a measure of extrinsic evaluation, namely responsiveness, appeared in the Document Understanding Conference (DUC) of 20051 . This extrinsic measure has been used in later DUCs as well. In DUC 2005, the appointed task was the synthesis of a 250-word, well-organized answer to a complex question, where the data of the answer would originate from 25 documents [Dang 2005]. In DUC 2005, the question the summarizing “peers”, i.e. summarizer systems or humans, were supposed to answer consisted of a topic identifier, a title, a narrative question and a granularity indication, with values ranging from “general” to “specific”. The responsiveness score was supposed to provide, as Dang states in [Dang 2005], a “coarse ranking of the summaries for each topic, according to the amount of information in the summary that helps to satisfy the information need expressed in the topic statement, at the level of granularity requested in the user profile”. In other words, responsiveness grade was meant to result in a partial ordering, indicative of how well a given summary answers a given question, taking into account the specifications of a question. According to the definition of extrinsic evaluation, responsiveness is an extrinsic evaluation measure. The responsiveness grade was appointed by human judges and is therefore a useful measure, which an automatic evaluation system would aim at determining automatically. It is important to note that responsiveness was not meant to be an absolute grading measure, but rather a partial ordering of the summarization abilities of the peers [Dang 2005]. An automatic measure that could provide a similar ordering should strongly correlate to the responsiveness grade ordering assigned by humans. Since there appears to be no absolute measure of quality for a summary, even for human judges, an automatic measurement would require at least one model summary (i.e. human extracted summary produced as a reference for measuring the goodness of the summaries produced by others), also called ‘gold standard’ or ‘reference’ summary. Then, it would be possible to judge the peer summaries (i.e. summaries extracted by peer systems). Such measurements actually determine some kind of distance between the peer and the model summaries. The questions posed for such an automatic measure, having the same utility as the one responsiveness provides, would be: —What is the kind of information that can be used in order to represent the peer and model summary? —What should the actual representation method for the extracted information be, in order to retain information valuable in the comparison process? —What kind of similarity measure can be used or defined, in order to provide meaningful results? Automatic methods for the evaluation of summaries exist [Hovy et al. 2005; Lin 2004; Zhou et al. 2006] and correlate highly to the measure of responsiveness. There are, however, some desired characteristics that do not coexist in a single method. More precisely: 1 Also
see http://duc.nist.gov/ ACM Journal Name, Vol. V, No. N, Month 20YY.
4
·
G. Giannakopoulos et al.
—Language-neutrality. A method that does not require language dependent resources (thesauri, lexica, etc.) can be applied directly to different languages. —Full automation. A method should not require human intervention, apart from the human model summaries. —Context-sensitivity. A method should take into account contextual information, so that well-formedness of text is taken into account. Well-formedness can be loosely defined as the quality of a text that allows easy reading. A text that is a random sequence of words would lack this quality, even if the words are on topic. Our method, named AutoSummENG (AUTOmatic SUMMary Evaluation based on N-gram Graphs), attempts to hold all these qualities, while bearing results with high correlation to the responsiveness measure, which indicates correlation to human judgement. The results of our experiments indicated that our method outperforms current state-of-the-art systems in that sort of correlation, while remaining strictly statistical, automated and context-sensitive due to the nature of the representation used, namely the n-gram graph (more on this in section 3). 1.2
Structure of the Document
Within this document, we present an overview of the AutoSummENG method, followed by a brief introduction to required background knowledge and related work. After that, we elaborate on our method, both in terms of the proposed representation of summaries, as well as the proposed similarity measures that can be applied upon these representations. In section 3.1 we support the selection of the presented representation via experimental results. Then, a second part concerning a detailed model for a-priori estimation of the method’s parameters is presented and evaluated. In addition, experiments indicative of the high evaluation performance of the proposed method are presented in the evaluation section (section 5). We close the paper with conclusions and future work. 2.
SUMMARY OF METHOD AND BACKGROUND KNOWLEDGE
The AutoSummENG method, is based on the concept of using statistically extracted textual information from summaries, integrated into a rich representational equivalent of a text, to measure similarity between generated summaries and a set of model summaries. The novelty of the method concerns the following points: —The type of statistical information extracted. —The representation chosen for the extracted information. —The method of similarity calculation. The information extracted from source texts is a set of indicators of neighbourhood between n-grams contained within the source text. In other words, the method proposes the extraction of relations between n-grams, given spatial proximity of those n-grams within a given text. Then, a graph is constructed to indicate the full set of relations deduced (as edges between n-gram-labeled vertices), together with additional information concerning these relations. Such representations are extracted from both generated and model (i.e. human composed) summaries. The edges of the graphs may contain such ACM Journal Name, Vol. V, No. N, Month 20YY.
Summarization System Evaluation Revisited: N-gram Graphs
·
5
information as the mean distance between the neighbouring n-grams in all occurrences, or a distance-weighted co-occurrence count for any given pair of n-grams, or even a detailed distribution of distances between pairs of n-grams in texts. Finally, a comparison between the graph representation of generated and model summaries is made, returning a degree of similarity between the graphs. At this point, generated summaries that are found to be on average more similar to model summaries are considered better. Systems that generate, on average, better summaries are in turn considered better systems. The comparison methodology varies from vertex-only comparison between graphs, to full comparison including the information attached to the edges. Given the above, we have evaluated different representation types, based on both the type of represented data (character or word n-grams) as well as the use or not of connectivity information between the data (graph or histogram). During its evaluation the system was found to perform differently based on its parameters. Therefore, a full study was conducted, focusing on how these parameters can be a priori optimized, to provide a fully automated evaluation methodology. The study was based on the fact that there are relations between meaningful n-grams, we call ‘symbols’ and non-meaningful ones, which we call ‘non-symbols’. These categories of n-grams are based on statistical criteria and are used to describe how noise can deteriorate the performance of our method, as a function of the methodology parameters. Given this noisy-channel model of our approach, we were able to perform an a priori estimation of the method parameters. At this point, we will review underlying theory used in evaluation of summarization systems, as well as existing methods of such evaluation. We begin by indicating how the performance of evaluation methods is measured along with the required statistical measures, then describe existing approaches for the evaluation of summaries and summarization systems. Then, we provide background related to basic concepts of our methodology, such as n-grams and graphs, also presenting how comparison between graphs is performed and the use of graphs in the domain of automatic summarization. 2.1
Measuring Correlation – Evaluation Method Performance
In the automatic evaluation of summarization systems we require automatic grades to correlate to human grades. The measurement of correlation between two variables provides an indication of whether two variables are independent or not. Highly correlated variables are dependent on each other, often through a linear relationship. There are various types of correlation measures, called correlation coefficients, depending on the context they can be applied. Three types of correlation will be briefly presented here, as they are related to the task at hand: —The Pearson’s product moment correlation coefficient reflects the degree of linear relationship between two variables2 . The value of Pearson’s product moment correlation coefficient ranges from -1 to 1, where 1 indicates perfect positive correlation and -1 perfect negative correlation. Perfect positive correlation indicates 2 The
linear relationship of two correlated variables can be found using methods like linear regres-
sion. ACM Journal Name, Vol. V, No. N, Month 20YY.
6
·
G. Giannakopoulos et al.
that there is a linear relationship between the two variables and that when one of the variables increases, so does the other in a proportional manner. In the case of negative correlation, when one of the two variables increases, the other decreases. A value of zero in Pearson’s product moment correlation coefficient indicates that there is no obvious correlation between the values of two variables. —The Spearman’s rank correlation coefficient [Spearman 1906] performs a correlation measurement over the ranks of values that have been ranked before the measurement. In other words, it calculates the Pearson’s product moment correlation of the ranking of the values of two variables. If two rankings are identical, then the Spearman’s rank correlation coefficient will amount to 1. If they are reverse to each other, then the correlation coefficient will be -1. A value of zero in Spearman’s rank correlation coefficient indicates that there is no obvious correlation between the rankings of values of two variables. It is important to note that this coefficient type does not assume linear relation between the values, as it uses rankings. However, it presumes that subsequent ranks indicate equal distance between the corresponding values of the measured variable. —The Kendall’s tau correlation coefficient [Kendall 1962] raises one more limitation of the previous methods: it does not expect subsequent ranks to indicate equal distance between the corresponding values of the measured variable. The above correlation coefficients have all been used as indicators of performance for summary systems evaluation [Lin 2004; Nenkova 2006]. To clarify how this happens, consider the case where an automatic evaluation method is applied on a set of summarization systems, providing a quantitative estimation of the latter’s performance by means of a grade. Let us say that we have assigned a number of humans to the task of grading the performance of the same systems as well. If the grades appointed by the method correlate to the grades appointed by humans, then we consider the evaluation method good. Let us now elaborate on how summary evaluation has been described and conducted according to the literature. 2.2
Summary Evaluation
A summary, even though it is supposed to be a reduced version of original texts, is in any case a text by itself. This stands for the model summary as well as the peer summaries. Therefore, one needs a representation of text, which will enable semantic similarity determination between two texts. This representation would be an intermediate one, that would – ideally – allow us to position the original textual information in a metric space. However, in previous publications the presented measures do not necessarily abide by the triangle inequality and are rather simple similarity measures. A number of different intermediate representations of summaries’ information have been introduced in existing summarization evaluation literature, ranging from automatically extracted snippets to human-decided sub-sentential portions of text. More specifically, the “family” of BE/ROUGE3 [Hovy et al. 2005; Lin 2004] evaluation frameworks, uses statistical measures of similarity, based on n-grams of words4 , 3 See 4 We
also [Papineni et al. 2001] for the BLEU method on machine translation. remind the reader that N-grams of words are groups of words with N elements. N-grams of
ACM Journal Name, Vol. V, No. N, Month 20YY.
Summarization System Evaluation Revisited: N-gram Graphs
·
7
although it supports different kinds of analysis, ranging from n-gram to semantic [Hovy et al. 2005]. The intuition behind the BE/ROUGE family is that, in order two texts to have similar meaning, they must also share similar words or phrases. One can take into account simple unigrams (single words) in the similarity comparison, or may require larger sets of words to be shared between compared texts. Basic Elements (BE) are considered to be ‘the head of a major syntactic constituent’ and its relation to a single dependent. BEs are decided upon in many ways, including syntactic parsing and the use of cutting rules [Hovy et al. 2005]. BEs can be matched by simple string matching, or by more complex matching methods, like semantic generalization and matching, according to the proposed framework [Dang 2005; Hovy et al. 2006]. A different approach [van Halteren and Teufel 2003] uses the “factoids”, which are predicate-like structures representing summary information, while the approach in [Passonneau et al. 2006] uses “Semantic Content Units” (SCUs) of the Pyramid annotation method. These representation types – factoids, SCUs – represent elementary information units, mapping semantic information items to different surface appearances. Elaborating, the factoid concept specifies “atomic” pieces of information that can differentiate summaries. These factoids are of various lengths, they are represented in a manner similar to First Order Predicate Logic, and they are subjective. The main directives on which factoid annotation was based, as indicated in [van Halteren and Teufel 2003], was that a factoid could generally be represented by a simple First Order Predicate Logic predicate. Additionally, potential factoids always appearing together within a (source) text were viewed as one, joined factoid, containing the union of all corresponding information. Systems with a high F-measure – i.e. 2×Recall×P recision – concerning factoids appearing in a gold-standard summary, Recall+P recision were deemed better. On the other hand, Semantic Content Units are annotated, semantically adequate fragments of a text, no longer than a sentence, which are defined by humans as instructed by a set of predefined rules. The notion of “semantically adequate” supposes that no useless fragments of information will be used as SCUs. On the other hand, Semantic Content Units, need not be atomic, or predicatelike. They are mere semantic equivalents of different surface appearances. In other words, they represent the common meaning of a set of phrases. SCUs carry a varying weight, which is calculated in terms of the number of appearances each SCU has within the model summaries. Thus, SCUs appearing in many model summaries are considered salient. The evaluated summaries were given a higher score if more high-weight SCUs appeared within them (see also [Nenkova 2006] for more information). Other human-decided information items appearing in the literature are “information nuggets” [Voorhees 2003], which were defined as facts for which the (human) “assessor could make a binary decision as to whether a response contained the nugget”. The information nuggets were used in the question answering track of TREC2003, which explains what the word “response” refers to in the previous definition. Summaries containing more and distinct information nuggets were assigned characters are groups of characters with N elements. ACM Journal Name, Vol. V, No. N, Month 20YY.
8
·
G. Giannakopoulos et al.
a higher score. The use of factoids, SCUs, information nuggets and similar information representations, require human assessment, which can be costly. Therefore, even though the definition of frameworks that reduce inter-judge agreement are a necessity to perform more robust evaluation, one needs to devise automated evaluation methods to avoid the cost of human intervention. The family of BE/ROUGE evaluation frameworks support such automated evaluation. They rely on the statistical analysis of co-occurring word n-grams between the peer and reference summary. There exist different models of n-gram analysis methodology, for example ROUGE-2 identifies common bigrams, while ROUGESU4 is a method where bigrams with a maximum gap of four words between them are considered matching bigrams between the evaluated and model summary (also consult [Lin 2004] for more information). Although ROUGE takes into account contextual information, it remains at the word-level, which means we either regard different types of the same word as different, or we need to apply (languagedependent) stemming or lemmatization to remove this effect. Basic Elements (BE) on the other hand use extraction techniques, based on the use of structured representation in the form “head-modifier-relation”, where head is a major syntactic constituent and relation is the relation holding between modifier and head. The BE approach can use several preprocessing modules to extract head terms, according to different parsing and cutting rules [Hovy et al. 2005], which are language dependent. Therefore, this method cannot be easily applied when the required linguistic modules do not exist for the specified language of the summaries. Thus, one would prefer a method to be language-neutral to avoid prerequisites. The approach of ParaEval described in [Zhou et al. 2006], uses a method based on Machine Translation practices, where a paraphrase table is created based on parallel aligned corpora in two different languages. The assumption made is that “if two English phrases are translated into the same foreign phrase with high probability (shown in the alignment results from a statistically trained alignment algorithm), then the two English phrases are paraphrases of each other” [Zhou et al. 2006]. This kind of table is extracted automatically – even though the parallel corpus should already exist. Then a three-level comparison between the peer and the model summary is conducted, where, in the first-level, paraphrases are located in the two summaries. If, for some portions of texts, this matching process fails, the evaluation attempts to locate synonym words. Finally, if the latter match fails, then simple lexical matching occurs. The results of the application of Pyramid evaluation, and ROUGE-2, ROUGESU4 on the DUC 2005 data, indicated high correlation to the responsiveness measure, and thus the measures were considered useful. The method presented herein matches and even exceeds the correlation of the aforementioned methodologies on the newer, DUC 2006 5 data, in a language neutral, statistical manner, while taking into account contextual information.
5 Also
see http://duc.nist.gov/
ACM Journal Name, Vol. V, No. N, Month 20YY.
Summarization System Evaluation Revisited: N-gram Graphs
2.3
·
9
N-grams and Q-grams
In various applications of information extraction and retrieval, as well as natural language processing, there have been a number of uses for the n-gram aspect of texts. An n-gram is a, possibly ordered, set of words or characters, containing n elements. Character n-grams are also called q-grams[Ukkonen 1992], but the term q-grams is used mainly in database indexing and string matching research, thus we will refer to q-grams as “character n-grams” to facilitate all readers. N-grams have consisted a useful representation for tasks like text-categorization [Cavnar and Trenkle 1994], machine translation [Zens and Ney 2006], authorship identification [Houvardas and Stamatatos 2006] and summarization and summary evaluation [Banko and Vanderwende 2004; Lin and Hovy 2003; Copeck and Szpakowicz 2004]. Especially in the automatic summarization domain, n-grams appear as word ngrams, either used in the evaluation or the summarization process itself (e.g. in the ROUGE/BE family of evaluator methods [Hovy et al. 2005; Lin 2004]). N-gram fuzzy matching detects similar portions of text, even if other words appear between the n-gram words in the text [Lin 2004]. There are different methods to allow for varying degrees of flexibility in the comparison, indicating a tradeoff between precision and laxity. 2.4
Graph-based Methods and Graph Matching
Graphs have been apparent in artificial intelligence for some time as a means of representing related objects. In the domain of automatic summarization, graphs have been used as a means to determine salient parts of text [Mihalcea 2004; Erkan and Radev 2004a; 2004b] or determine query related sentences (see [Otterbacher et al. 2005] for a related sentece retrieval methodology). A text can be represented as a graph, either to indicate simple, lexical relationships [Mohamed and Rajasekaran 2006], or more complex, rhetorical structure [Marcu 2000] and even non-apparent information [Lamkhede 2005]. In multi-document summarization, graphs have also been used to detect differences and similarities between source texts [Mani and Bloedorn 1997] and interdocument relations [Witte et al. 2006], as well as relations of various granularity from cross-word to cross-document as described in Cross-Document Structure Theory [Radev 2000]. We also find the application of graphs to be a useful representation for multi-document summarization, for example in [Mihalcea 2005], where different iterations over graph representations of texts determine the salient terms over a set of source texts. Salience has also been determined by the use of graphs, based on the fact that documents can be represented as ‘small world’ topology graphs [Matsuo et al. 2001]. Graphs have not been used widely in the summary evaluation domain, even though they can represent relations of complex structure. Probably this is linked to the fact that graph comparison or graph matching is a non-trivial process. There is a number of known methods for the calculation of graph similarity, classified in two main categories: Isomorphism-based. Isomorphism is a bijective mapping between the vertex set of two graphs V1 , V2 , such that all mapped vertices are equivalent, and every pair of vertices from V1 shares the same state of neighbourhood, as their corresponding ACM Journal Name, Vol. V, No. N, Month 20YY.
10
·
G. Giannakopoulos et al.
vertices of V2 . In other words, in two isomorphic graphs all the nodes of one graph have their unique equivalent in the other graph, and the graphs also have identical connections between equivalent nodes. Based on the isomorphism, a common subgraph can be defined between V1 , V2 , as a subgraph of V1 having an isomorphic equivalent graph V3 , which is a subgraph of V2 as well. The maximum common subgraph of V1 and V2 is defined as the common subgraph with the maximum number of vertices. For more formal definitions and an excellent introduction to the error-tolerant graph matching, i.e. fuzzy graph matching, see [Bunke 1998]. Given the definition of the maximum common subgraph, a series of distance measures have been defined using various methods of calculation for the maximum common subgraph, or similar constructs like the Maximum Common Edge Subgraph, or Maximum Common Induced Graph (also see [Raymond et al. 2002]). Edit-distance Based. Edit distance has been used in fuzzy string matching for some time now, using many variations (see [Navarro 2001] for a survey on approximate string matching). The edit distance between two strings corresponds to the minimum number of edit character operations (namely insertion, deletion and replacement) needed to transform one string to the other. Based on this concept, a similar distance can be used for graphs [Bunke 1998]. Different edit operations can be given different weights, to indicate that some edit operations indicate more important changes than others. The edit operations for graphs are: —node deletion. —node insertion. —node substitution. —edge deletion. —edge insertion. —edge substitution. Given graph representations of text, these graph matching methods can be used as a means to indicate text similarity, as will be shown in the description of our method. 3.
PROPOSED EVALUATION METHOD
Tackling the problem of what kind of information should be used to represent a peer and a model summary in the evaluation of a summary, one should take into account that the surface appearance of two equivalent pieces of the same semantic content need not be identical, as happens in the case of paraphrases [Zhou et al. 2006]. Nevertheless, it is quite probable that the words expressing the content will exist in the same context, or that part of the words used will be identical, for example if different inflections are used. For more on the linguistic aspect of this assumption please consult [Manning and Sch¨ utze 1999]. Our method accounts for these assumptions, while retaining language-neutrality, by using only statistical methods and language-independent assumptions for the extraction of information from texts and for the computation of textual similarity. 3.1
Representation
Trying to capture more than simple co-occurrence of words and in order to allow for different types of the same word, our method uses character n-grams, positioned ACM Journal Name, Vol. V, No. N, Month 20YY.
Summarization System Evaluation Revisited: N-gram Graphs
·
11
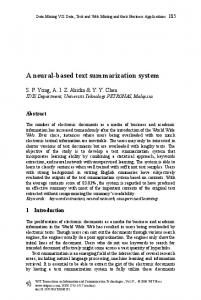
within a context-indicative graph. We shall call this construct an n-gram graph. In our analysis, we consider that we view neighbourhood with respect to a current n-gram, which is a subsequence of the text analysed. In the following analysis, we have also used word n-grams to be able to evaluate the method, as the n-gram graph representation is applicable to both word or character n-grams. We have tested three methods, concerning how the n-gram graph can be constructed, based on how neighbourhood between adjacent n-grams is calculated in a text. In general, a fixed-width window of characters (or words) around a given n-gram N0 is used, with all characters (or characters) within the window considered to be neighbours of N0 . These neighbours are represented as connected vertices in the text graph. The edge connecting the neighbours is weighted, indicating for example the distance between the neighbours or the number of co-occurrences within the text. Based on different types of windows, we can use: The non-symmetric approach. A window of length n runs over the summary text. If N0 is located (i.e. begins at) at position p0 , then the window will span from p0 − 1 to p0 − n, taking into account only preceding characters or words. Each neighbourhood-indicative edge is weighted by the number of co-occurrences of the neighbours within a given window of the text. The symmetric approach. A window of length n runs over the summary text, centered at the beginning of N0 . If the n-gram we are interested in is located at position p0 , then the window will span from p0 − [ n2 ] to p0 + [ n2 ], taking into account both preceding and following characters or words. Each neighbourhood indicative edge is weighted based on the number of window co-occurrences of the neighbours, as previously indicated, within the text. The Gauss-normalized symmetric approach. A window of length 3 × n runs over the summary text, centered on the beginning of our current n-gram, N0 . If N0 is 3×n located at position p0 , then the window will span from p0 − [ 3×n 2 ] to p0 + [ 2 ] (where [x] gives the integer part of x), taking into account both preceding and following characters and words. However, in this case the distance of a neighbour n-gram to the current n-gram is taken into account. In other words, an n-gram N1 with distance d1 from the beginning of N0 , positioned at p0 , is considered to be “less of a neighbour” than n-gram N2 , positioned at distance d2 , d2 < d1 from p0 . Therefore, each neighbourhood indicative edge is weighted based on the number of co-occurrences of the neighbours within the text and the neighbours’ distance at each occurrence. Also, the Gauss-normalized symmetric approach takes into account neighbours outside the given window size Dwin , to a full distance of 3 × Dwin . This distance was selected given the fact that this accounts for 99.99% of the mass under the Gaussian distribution, given we consider a standard deviation of Dwin 6 ; that is to say, n-grams outside that distance have almost no effect. Thus, it is better in terms of complexity to just ignore those outliers. In figure 1 schematic representations of the three approaches have been illustrated. The numbers indicate adjacent n-grams, which can either be word n-grams or character ones. The line over a number indicates that the n-gram has been taken 6 This
can be easily derived by using the probability mass function of the Gaussian distribution: 2
pdf(x) =
σ
(x−µ) √1 exp− 2σ 2 2π
. See also [Duda et al. 2001, Appendix A] ACM Journal Name, Vol. V, No. N, Month 20YY.
12
·
G. Giannakopoulos et al.
Fig. 1. Different types of n-gram windows (top to bottom): non-symmetric, symmetric and Gauss-normalized symmetric. N-gram 4 is the n-gram of interest.
Fig. 2. Graphs extracted from the string abcdef, based on the three types of windows (left to right): non-symmetric, symmetric and Gauss-normalized symmetric. The n-grams are character n-grams of rank 3.
into account as a neighbour. In the third part of the figure, the bell-shaped line indicates the different weights assigned to different distances from the n-gram positioned at p0 . The latter n-gram, we call n-gram of interest, is indicated by the emphasized number in the figure. We found, through a set of experiments, that the most promising approach was the symmetric one, which may indicate that there is indeed a maximum distance, outside which relations do not hold. We now provide the definition of n-gram, given a text (viewed as a character sequence): Definition 3.1. If n > 0, n ∈ Z, and ci is the i-th character of an l-length character sequence T l = {c1 , c2 , ..., cl } (our text), then a character n-gram S n = (s1 , s2 , ..., sn ) is a subsequence of length n of T l ⇐⇒ ∃i ∈ [1, l − n + 1] : ∀j ∈ [1, n] : sj = ci+j−1 . We shall indicate the n-gram spanning from ci to ck , k > i, as Si,k , while n-grams of length n will be indicated as S n . The meaning of the above formal specification, is that n-gram S n can be found as a substring of length n of the original text, spanning from the i-th to the j-th character of the original text. For example if the text is the following sentence: Do you like this summary? then S1,2 is the sequence {‘D’,‘o’}≡‘Do’ for display purposes. ACM Journal Name, Vol. V, No. N, Month 20YY.
Summarization System Evaluation Revisited: N-gram Graphs
·
13
Extracting N-grams If we choose to extract the n-grams (S n ) of a text T l , the (elementary) algorithm is indicated as algorithm 1.
1 2 3
Input: text Output: n-gram set // T is the text we analyse for all i in [1,length(T)-n+1] do get substring of T from index i to i+n-1 end Algorithm 1: Extraction of n-grams
The algorithm applies no preprocessing (such as extraction of blanks, punctuation or lemmatization). Furthermore, it obviously extracts overlapping parts of text, as the window is shifted by one position at a time and not by n positions at a time. This technique is used to avoid the problem of segmenting the text. The redundancy apparent in this approach proves to be useful similarly to a convolution function: summing similarities over a scrolling window may prove more useful if you do not know the exact centre of the match. In other words, the extracted n-grams are certain to result in a match to n-grams of the model summary, if such an n-gram exists, whereas a method where the text was segmented in equal n-grams might not locate the matching n-grams. Example 3.2. Application of our method to the sentence we have used above, with a requested n-gram size of 3 would return: {‘Do ’, ‘o y’, ‘you’, ‘ou ’, ‘u l’, ‘ li’, ‘lik’, ‘ike’, ‘ke ’, ‘e t’, ‘ th’, ‘thi’, ‘his’, ‘is ’, ‘s s’, ‘ su’, ‘sum’, ‘umm’, ‘mma’, ‘mar’, ‘ary’, ‘ry?’} while an algorithm taking disjoint n-grams would return {‘Do ’, ‘you’, ‘ li’, ‘ke ’, ‘thi’, ‘s s’, ‘umm’, ‘ary’} (and ‘?’ would probably be omitted). In the case of the word n-gram extraction, the text is considered to be a word sequence (as opposed to character sequence). The text has been preprocessed, using a simple tokenizer based on punctuation and blanks, to determine word boundaries. However, it is important that this ‘simple’ tokenizer deprives the method of its complete language neutrality, if used. Therefore, we will prefer the character n-gram version to the word n-gram version, if their use in evaluation renders equivalent results. Back to the character n-gram version, it is rather obvious that segmentation should be done carefully in order to avoid redundancy, without losing information on important sequences of characters. Consider the case where we match character n-grams between two segmented texts. In the given example, the fact that the word ‘summary’ has been broken down in three disjoint n-grams may cause a mismatch, or not match at all, of the word ‘summary’. For n-grams of higher length, or rank as it is called, the effect of information loss in the case of a careless segmentation may prove more deteriorating, if we consider two n-grams to match if and only if they are exactly the same. Perhaps other methods of string comparison, like ACM Journal Name, Vol. V, No. N, Month 20YY.
14
·
G. Giannakopoulos et al.
substring comparison, may decrease this loss. However, within this method we will use simple string matching between n-grams. The segmentation process by itself, even if one uses our approach, does not keep information concerning the relative position of n-grams in the original text; it only extracts n-grams. What this means is that we do not know if the n-gram ‘Do’ is next to the n-gram ‘you’, or not. Thus, words (n-grams) that consist what is called a “collocation”, i.e. that when found together possess a meaning that is not simply a concatenation or composition of each separate word meaning [Manning and Sch¨ utze 1999], will lose their connection when extracted. This is where the graph representation comes in. N-gram Graph The n-gram graph is a graph G = {V G , E G } which has n-grams as its vertices v G ∈ V G and the edges eG ∈ E G (the superscript G will be omitted where easily assumed) connecting the n-grams indicate proximity of the corresponding vertex n-grams (also see figure 2). The edges can be weighted, by applying the distance between the two neighbouring n-grams in the original text. If the n-grams are found to be neighbours more than once in the original text, which is usually the case, one could assign a distribution of distances to each edge to use the distance information. More formally: Definition 3.3. if S = {S1 , S2 , ...}, Sk 6= Sl , fork 6= l, k, l ∈ N is the set of distinct n-grams extracted from a text T l , and Si is the i-th extracted n-gram, then G is a graph, where there is a bijection (one-to-one and onto) function f : S → V . The edges E, are assigned weights of ci,j where ci,j is the number of times a given pair Si , Sj of n-grams happen to be neighbours within some distance Dwin (in characters for character n-grams) of each other, or within a function of the given distance Dwin - as in the Gauss-normalized approach. Since, probably, not all distances are of importance, and thus two n-grams neighbouring by 150 characters probably have no actual relation, we take into account only a window around Si in the original text, to determine which Sj deserves our attention. The vertices vi , vj corresponding to n-grams Si , Sj that are located within this parameter distance Dwin are connected by a corresponding edge e ≡ {vi , vj }. Following this method of representation, we have reached a point where we have kept some information for a determined n-gram length n and parameter distance Dwin . It is non-trivial, though, to choose a single {n, Dwin } pair, that can be optimal for n-gram extraction independent of the text: if one chooses a very low value for n, then the relation between different n-grams can be taken into account only by augmenting the Dwin parameter. However, in the case of a high Dwin value, the fact that we only take into consideration whether the n-grams are neighbours and not their actual distance, may prove detrimental to the information we keep. In other words, if our Dwin is 50, then a neighbour by 1 character will be considered equally close to one with a distance of 50 characters. If n, on the other hand, is too high, then the information we gather for each text will be extremely redundant and will definitely cause consumption of more resources, as well as make the matching process more time-consuming. This happens because there are much more unique 10-grams than 2-grams in any selected ACM Journal Name, Vol. V, No. N, Month 20YY.
Summarization System Evaluation Revisited: N-gram Graphs
·
15
(adequately long) text of a natural language, like English or Greek. Furthermore, the number of vertices of the graph Gn for rank n of n-grams will increase exponentially to the rank n of n-grams7 (subscript n of Gn will be omitted when easily assumed). In order to tackle these problems we take into consideration n-grams of various ranks, with a rather small maximum distance between them, determined to be valued around the average word length of the text language. The selection of different n-gram ranks allows for matching of various length n-grams, without use of the distance metric, while the small Dwin allows small variations of distances and provides less accuracy loss concerning the distribution of distances. However, the selection of an optimal n-gram rank range [rmin , rmax ] proved to be an issue worth investigating, and so we did as will be seen in section 4. In the research conducted, it was important to see if a histogram offers equally well results with a graph in the process of the evaluation. If that stood, it would mean that the graph representation should not be used altogether. N-gram Histogram The n-gram histogram representation is a simple frequency histogram measuring n-grams occurrences. In other words, it simply indicates the number of times an n-gram appears, without any neighbourhood information. This representation will be used as a baseline to indicate whether neighbourhood information is indeed important in our domain of application. 3.2
Comparison
In order to compare two summaries T1 and T2 , we need to compare their representations. Given that the representation of a text Ti is a set of graphs Gi , containing graphs of various ranks, we propose the following similarity measures between graphs Gi , Gj of the same supposed rank n: —Co-occurrence Similarity (CS), indicating how many of the edges contained in graph Gi are contained in graph Gj . We define e ∈ E G ≡ e ∈ G. Thus cooccurrence is defined as: P j i µ(e, G ) i j (1) CS(G , G ) = e∈G i max(|G |, |Gj |) µ is the membership function, which returns 1 if e belongs to G, else it returns 0. Also |G| is the number of edges e ∈ G. The definition causes CS to be symmetric, i.e. CS(Gi , Gj ) = CS(Gj , Gi )
(2)
Also, CS takes values in [0, 1], with a value of 1 indicating a full match of the two graphs, even though edge weights are not taken into account. On the other hand, a value of 0 means that no edge from one graph exists in the other. In this measure, each matching edge contributes by max(|G1i |,|Gj |) to the sum. The 7 The
grammar of each language does not allow all combinations of alphabet characters, and thus the possible 5-grams of a language with 26-letter alphabet are not 265 , but somewhat lower. See also [Manning and Sch¨ utze 1999, sections 2.2.1-2.2.2]. ACM Journal Name, Vol. V, No. N, Month 20YY.
16
·
G. Giannakopoulos et al.
CS is a normalized derivative of common graph distance measures, based on the Maximum Common Subgraph [Bunke 1998]. —Value Similarity (VS), indicating how many of the edges contained in graph Gi are contained in graph Gj , considering also the weights of the matching edges. In this measure each matching edge e having weight wei in graph Gi contributes VR(e) max(|Gi |,|Gj |) to the sum, while not matching edges do not contribute (consider that if an edge e ∈ / Gi we define wei = 0). The ValueRatio (VR) scaling factor is defined as: min(wei , wej ) VR(e) = (3) max(wei , wej ) The equation indicates that the ValueRatio takes values in [0, 1], and is symmetric. It is easy to see that this allows the VS metric to retain the symmetricity inherited from the CS equation part. Thus, the full equation for VS is: P min(wei ,wej ) j e∈Gi (µ(e, G ) × max(wi ,wej ) ) e VS(Gi , Gj ) = (4) max(|Gi |, |Gj |) VS is a metric converging to 1 for graphs that share both the edges and similar weights, which means that a value of VS = 1 indicates perfect match between the compared graphs. The analogous measure of CS from graphs to histograms, which we name CSH , is actually based upon a binary decision of whether an element h of histogram H1 , with a value of v1 , also exists in a histogram H2 , independent of the value v2 of the same element in H2 . Each co-existing element h contributes to CSH a quantity of 1 max(|H1 |,|H2 |) and, therefore, the equation for CSH is: X
CSH (H1 , H2 ) =
h∈H1
µ(h, H2 ) max(|H1 |, |H2 |)
(5)
where µ(h, H) equals to 1 if ∃h ∈ H : v(h, H) > 0, otherwise it equals to 0, where v is the value corresponding to h in histogram H. Also, |H| is the number of elements in histogram H. On the same basis and by setting v(h, H) of h ∈ / H to 0, then VSH is defined as: X µ(h, H2 ) × v(h, H2 ) VSH (H1 , H2 ) = (6) max(|H1 |, |H2 |) h∈H1
The fact that we have proposed extraction of different ranks of n-grams for the composition of the graphs allows us to take advantage of matching between different ranks. The overall result of both the CS and the VS calculations, here depicted by the superscript ‘O’, is a weighted average of the ranks. For example, for CS we have: P O
CS =
r∈[Lmin ,LMAX ]
P
r × CSr
r∈[Lmin ,LMAX ]
r
(7)
where CSr is the CS measure for extracted graphs of rank r, and Lmin , LMAX are arbitrary chosen minimum and maximum ranks. ACM Journal Name, Vol. V, No. N, Month 20YY.
Summarization System Evaluation Revisited: N-gram Graphs
·
17
The intuition behind equation 7 is that matching between higher order ranks is more important between matching in lower level ranks. This intuition relies on the fact that languages rely on the composition of simpler character strings to create more complex ones, which bear richer meaning than their components. This composition occurs in characters, words, sentences, paragraphs and so forth and has been founded both by generative as well as statistical language processing research O (e.g. [Manning and Sch¨ utze 1999, Introduction]). Similarly for VSO , CSO H , VSH . In the experiments, these overall values were used as results for the comparison process. It should be noted that the function of weight given the rank has been found empirically, and thus better alternatives can be found8 . 3.3
Experimental Setup – Representation
Based on the definition of the proposed similarity measures we wish to show, by experiments, that systems with summaries getting higher CS or VS than others, are indeed better systems; and so it has proved to be, by correlation to the responsiveness measure (see table VI). We will refer to this correlation to the responsiveness measure as evaluation performance (EP), as opposed to system or method performance which refers to the grade appointed to an evaluated system or method. The data on which the measurements were conducted was the summary and evaluation corpus of DUC 2006. The corpus consists of summaries for 50 different topics. Each topic had a number of automatically extracted summaries, one for each participating system, and 4 human created summaries. The human summaries were differentiated by means of an identifier, as were the baseline system summaries, which originated from a baseline system created by NIST, which simply took the first 250 words of the most recent document for each topic. It is important to indicate that human summaries were used both as model summaries and as peer summaries. All summaries were truncated to 250 words before being evaluated. To verify some of our experiments using a second corpus, we have used the corpora of DUC 2005 and DUC 2007 as well. The corpus of DUC 2005, similarly to the one of DUC 2006, consists of summaries for 50 different topics. The only major difference is that 30 of the topics had 4 human summaries each, while the remaining 20 topics each had either 9 or 10 human summaries. The corpus of DUC 2007 consists of summaries for 45 different topics. Each topic has 4 humanly created summaries, as well as 28 machine generated summaries. The measure used for evaluation performance was the correlation of the method evaluation metric to the responsiveness measure, which has already been used and accepted by recent research [Dang 2005; Hovy et al. 2005; Nenkova 2006]. The statistical measures used were Pearson’s product moment correlation coefficient, as well as Spearman’s rank correlation. We remind the reader that Pearson correlation takes values in [−1, 1], where a value of 1 (or -1) indicates perfect (or negative perfect) correlation between two measures, while a value of 0 indicates no apparent correlation. Spearman correlation indicates whether two measures used as grades will provide similar rankings given a set of contesting entities, with values near 1 indicative of a higher correlation. On that basis, we would require our method to approach the maximum correlation value of 1 to the responsiveness measure. 8 We
have also tried the simple reverse of rank r ( r1 ), with worse results. ACM Journal Name, Vol. V, No. N, Month 20YY.
·
18
G. Giannakopoulos et al.
In the following tests, we consider representations and measures with Spearman’s coefficient values closer to 1 better. It should be noted that the experiments used both character and word n-grams as granularity levels, to see if there is a difference between the two. The set of experiments concerning representation, attempted to evaluate simple n-gram histogram representation, in comparison to the graph representation. The measures of Co-occurrence Similarity CS and Value Similarity VS have been used for both representation schemes and the results of the experiments were correlated to the responsiveness measure. Each peer summary was compared both in terms of character n-gram and word n-gram graphs, as well as the corresponding character and word n-gram histograms, to all model summaries separately. Then the similarities were averaged to conclude a final similarity of the peer summary to the models. Human summaries, that appeared both as peer and model summaries, were not compared to themselves in the process of comparison. Requiring that representations are compared between themselves, regardless of the parameters, we conducted a series of experiments within a very wide range of parameter settings. The three parameters used are: (1) Minimum n-gram length, indicated as Lmin . (2) Maximum n-gram length, indicated as LMAX . (3) Neighbourhood Window Size, indicated as Dwin . The values given to the above parameters were as follows: —Lmin ∈ [1, 10], which means we have taken into account n-grams from unigrams to ten-grams. —LMAX ∈ [Lmin , 10], which means we have taken into account n-grams from the size of the selected Lmin and up to ten-grams. —Dwin ∈ [1, 20], which means we have taken into account a window size of one and up to twenty in different iterations of the experiment. The features that differentiate representations are: —the word or character nature of the n-grams in the representation. —the type of the representation: histogram or graph. —the existence of binary or real values in the representation (co-occurrence vs. value). For example, a histogram indicative of occurrence would only use binary values, while a histogram containing frequence or probability of occurrence would use real values. In the case of a graph, a binary value may indicate co-occurrence, while a real value may also indicate strength of this co-occurrence. 3.4
Results on Characters: Histogram or Graph – Co-occurrence or Value
Table I depicts the evaluation performance of four different approaches concerning the representation (either graph or histogram) and measure (either co-occurrence or value). For each approach, we have measured the maximum evaluation performance, the minimum evaluation performance, the mean and the standard deviation of evaluation performance. Concerning character n-grams, in table I we can see that ACM Journal Name, Vol. V, No. N, Month 20YY.
Summarization System Evaluation Revisited: N-gram Graphs Table I.
·
19
Histogram and Graph Character N-gram Statistics Ranked by Mean Performance Representation - Measure Max Min Mean Std. Deviation Graph – Value 0.938 0.803 0.914 0.019 Histogram – Co-occurrence 0.934 0.723 0.912 0.035 Graph – Co-occurrence 0.912 0.738 0.883 0.020 Histogram – Value 0.854 0.502 0.633 0.097
the most promising representation is that of the graph value, based on the ranking of average performance and robustness (i.e. least standard deviation). Statistical Evidence In order to statistically support whether different approaches indeed rendered different results and, thus, conclude on which approach is better, we tested whether the distribution of evaluation performance values for each method was normal (Gaussian). If this stood, we would be able to apply a simple one-sided t-test to reach a decision about comparison between approaches. The Anderson-Darling normality test [Stephens 1974] was used to judge normality. This test has the null hypothesis that the samples examined come from a normal distribution. Unfortunately, the distributions of the samples used are not normal (the samples had a probability of less than 2.2 × 10⁻¹⁶ to originate from a normal distribution) and we had to use another test. At first, we tested whether the distributions of results from all methods were all different from one another, which would indicate that there is not a reason to choose a specific distribution. To do this, the Kolmogorov-Smirnov goodness-offit test [Massey Jr 1951] was used, which has the null hypothesis that two sets of samples come from the same distribution. The test indicated that all distributions are indeed different with a confidence of more than 99%9 . The test selected as appropriate for the task of deciding which evaluation approach performs better was the Wilcoxon rank sum test (also called Mann-Whitney test) [Hollander and Wolfe 1973, p. 27-33,68-75]. This test ranks the samples (in our case the evaluation performance values) over a common axis (in our case the R axis). Then, it uses the sum of the ranks of each sample set to see which corresponding distribution is more probable to give samples that stand higher than the samples of the other in the given axis. According to this test, the ranking of methods indicated that Histogram-Co-occurrence is probably a little better than Graph-Value methods, contrary to what the mean and standard deviation have indicated. In the bottom half of the ranking, Graph-Co-occurrence is worse than Graph-Value but better than Histogram-Value, as expected. There was a hint that the oddity concerning Histogram-Co-occurrence and GraphValue may be due to the effect of the Dwin parameter in Graph-Value results. In other words, there are a lot of samples from the Graph-Value approach that have extreme Dwin values, which affect the whole distribution of results. To check this possibility we performed the same test between Histogram-Co-occurrence and Graph-Value evaluation performances, where we had kept only performances of the Graph-Value approach for Dwin P (yr ) then st = ct ; end else S = S + st ; st = y; end end // Add last symbol S = S + st ; Algorithm 2: Extracting Symbols
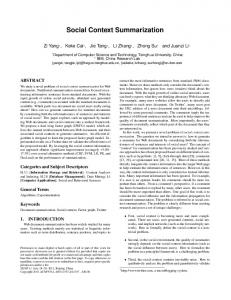
Descriptively, the above algorithm runs through the text, splitting symbols when the next character seems to have been positioned after the current substring by mere chance. Starting with a single-character candidate symbol, the algorithm adds new characters to the candidate symbol, until a split point is reached. Then, the candidate symbol is upgraded to a symbol, and a new candidate symbol is formed using the next character. In figure 8 we can see the distribution of symbol sizes as extracted by the algorithm from the DUC 2006 corpus. ACM Journal Name, Vol. V, No. N, Month 20YY.
Summarization System Evaluation Revisited: N-gram Graphs
Fig. 8.
·
27
The Distribution of Symbols per Rank (Symbol Size) in the DUC 2006 corpus
The aware reader may note that this method is related to the Symmetric Conditional Probability used in the LocalMaxs algorithm [da Silva et al. 1999], as well as the notion of “glue” in [Houvardas and Stamatatos 2006]. The main difference is that we do not evaluate candidate n-grams to keep the most prominent ones, but we consider all n-grams that represent symbols to be important, and all others not important. Additionally, the probabilities used in the extraction of symbols here are different from the ones already in previous publications (e.g. SCP), and there are no fixed rules based on the n-gram size, because these would be languagedependent. However, it would be interesting to see whether the use of other existing methods for variable rank n-gram extraction can prove more fruitful than the proposed one. This has not been done in the context of the current work, due to the reasons stated above. 4.3
Signal to Noise – Symbol Importance
In order to determine a measure of the importance of each symbol in our method, we insisted on the probabilistic approach. We consider any given symbol to be more important, if it is less probable to be generated by a random symbol creator. This symbol creator, in order to create a new n-gram of size n, would choose randomly a n − 1 rank n-gram from a pool of valid symbols and would randomly select an 1-gram symbol to append, creating the new n-gram. The importance of a symbol is indicated by a weighting factor. On the other hand, we consider non-symbols to be equally (un)important, in that each non-symbol has an importance of 1. The fact that we have interesting and uninteresting pieces of data that form our input is analogous to a noisy channel model, where a signal (interesting pieces) is transmitted over a medium (algorithm) that adds noise (uninteresting pieces). In this case we would like to change the medium parameters (Lmin , LMAX , Dwin ), in order to maximize the signal and minimize the noise. A signal-to-noise approach, trying to predict what is the tradeoff between different values of Lmin and LMAX ACM Journal Name, Vol. V, No. N, Month 20YY.
28
·
G. Giannakopoulos et al.
concerning the signal-to-noise ratio, can be based on an equation like: SN (Lmin , LMAX ) = 10 × log10 (
S(Lmin , LMAX ) ) N (Lmin , LMAX )
(10)
where S(Lmin , LMAX ), N (Lmin , LMAX ) are functions returning a measure of signal and noise correspondingly, for a given range (Lmin , LMAX ). SN indicates the function of signal-to-noise. The signal is the useful information we have captured via symbols, while the noise is the redundant or useless information we have captured via non-symbols. N (Lmin , LMAX ) is defined as the count of non-symbols appearing in a given corpus for the given range: LX MAX
N (Lmin , LMAX ) =
|Non-Symbolsi |
(11)
i=Lmin
where |Non-Symbolsi | is the number of symbols of rank i. On the other hand, for the case of symbols we wish to take into account the importance of each symbol, and therefore calculate normalized weighted symbols. The latter are weighted according to their importance, which is a function of their rank. The normalization step occurs over the weighted symbols to provide a new set of symbols, same in number as the ones found in the texts, which are however rearranged over different ranks in a way that they also illustrate the importance of any given rank. The number of weighted symbols for each n-gram rank r is calculated in two steps, within the given range [Lmin , LMAX ]: (1) Calculate the weight wr of symbols for the specified rank r and sum over all weighted symbols to find the total, weighted symbol sum Wr for rank r. The weight ws is defined to be the inverse of the probability of producing a symbol of rank r given a symbol of rank r − 1, as longer symbols are less probable to appear as a result of a random sampling of characters. Thus: ( 1 if r = 1. r| P (sr |sr−1 ) = |Symbolsr |+|Non-Symbols 1 1 else. |Symbols |+|Non-Symbols | × |Symbols |+|Non-Symbols | r−1
r−1
r
So wr = 1/P (sr |sr−1 )
r
(12)
where |Symbolsr | is the number of symbols in rank r. (2) Normalize Wr so that the sum of Wr over r ∈ Lmin ,LMAX is equal to the original number of symbols in the texts. The normalized, weighted symbols Wr0 for rank r are calculated by: |Symbolsr | Wr0 = Wr × PLMAX i=Lmin |Symbolsi |
(13)
We indicate once more that the Wr0 measure actually represents the importance of symbols per rank r for the symbols of the texts, instead of the number of symbols per rank that is indicated by |Symbolsr |. ACM Journal Name, Vol. V, No. N, Month 20YY.
Summarization System Evaluation Revisited: N-gram Graphs
29
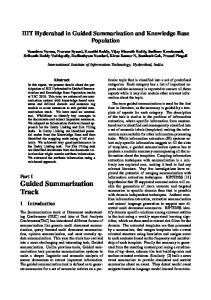
Correlation between Estimation (SN ) and Performance
0.94
Fig. 9.
·
0.92
● ● ● ● ●● ● ● ● ● ● ●●● ● ● ●● ●●● ●● ● ● ●● ● ● ● ● ● ● ● ●
● ● ●
●
0.88
●
●
0.82
0.84
0.86
Performance
0.90
●
●
● ● ●
●
−30
−25
−20
−15
−10
Estimation
Thus, S(Lmin , LMAX ) finally equals to: S(Lmin , LMAX ) =
LX MAX
Wi0
(14)
i=Lmin
Having defined our signal-to-noise function, we wish to maximize it and, therefore, we search the space of parameter values for optimum values. However, we have to investigate whether our estimate of signal-to-noise is correlated to the performance of the system, because only then will SN be useful. Indeed, SN offers an important 0.949 rank correlation (Spearman) to the maximum performance that can be achieved by our method (see figure 9). The same correlation holds for the mean performance for a given Lmin , LMAX pair and different values of Dwin . In fact, SN is also almost linear to the performance of the system, with a Pearson correlation of 0.918. Therefore, our estimator is rather good in finding optimal values for Lmin and LMAX . However, we have not yet discussed the distance parameter. We have said that it has a rather serious impact on the performance of the system. Up to this point the Dwin parameter was presumed to be independent from Lmin and LMAX . However, further evolution and testing of our model indicated a possible connection between Dwin and LMAX . We want to know, in the same manner as above, what is the signal-to-noise ratio as a function of distance Dwin . We shall refer to this ratio as SNd . In order to determine SNd , we can once more count the symbols and non-symbols expected to be found in a given distance Dwin from our n-gram. Let us consider, without harming generality, the case where we are in the middle of our (infinitely long) text and we have a visibility of Dwin characters to the right and left. Our ACM Journal Name, Vol. V, No. N, Month 20YY.
30
·
G. Giannakopoulos et al.
current n-gram is of rank s0 . We are extracting n-grams of size r. During our n-gram extraction, we extract d0 = 2 × Dwin n-grams (for the symmetric approach). Thus, there are d0 candidate symbols. In order to calculate the probability of extracting Ns symbols from d0 attempts, we can model the process of extraction with a binomial success probability, calculated for Ns successes in d0 attempts. The chance of success for the binomial for a given n-gram rank of r is given by: Ps =
Wr0
Wr0 + |Non-Symbolsr |
(15)
The chance that our current n-gram is a symbol Ps0 is the probability calculated by: Ws00
Ws00 + |Non-Symbolss0 |
(16)
Presuming that only information about neighbouring symbols is important, the signal function should take into account only the probability of having both a symbol current n-gram and a symbol neighbour n-gram. Even though the maximum number of non-overlapping, neighbour symbols we can find within d0 is [ dr0 ], we will not use this limitation in our analysis. We do so, because the analogy of symbols and non-symbols remains the same on average over all our corpus and our estimator can count on this analogy to extract good results on average. To extract an estimate Esr of the number of symbols that can be extracted for a given rank r, we use the algorithm indicated as algorithm 3.
1 2 3
4
Input: Distance Dwin , Success Probability of Single Trial Ps Output: Expected Number of Symbols Esr // D(x) is a discrete probability distribution for all i in [1,Dwin ] do D(x) = binomial(i;Dwin ,Ps ) ; end // E(y) is the mean function Esr =E(D(x)) ; Algorithm 3: Symbol Count Estimation
From algorithm 3, we get an estimated number of symbols. The rest of the d0 extractions are non-symbols and account for d0 − Esr extractions. Therefore, SNd can be calculated by: SNd (Lmin , LMAX ) = 10 × log10
Sd (Lmin , LMAX , Dwin ) Nd (Lmin , LMAX , Dwin )
(17)
where Sd , Nd are the signal and noise functions correspondingly, calculated by: ACM Journal Name, Vol. V, No. N, Month 20YY.
Summarization System Evaluation Revisited: N-gram Graphs
31
Correlation between Estimation (SN ) and Performance for Given Lmin , LMAX
0.935
Fig. 10.
·
●
● ●
●
●
● ●
●
0.925
●
0.920
Performance
0.930
●
●
●
0.915
●
●
● ●
−19
●
−18
−17
−16
−15
−14
Estimation
Sd (Lmin , LMAX , Dwin )
=Ps0
M X
×
(Esr )
(18)
(d0 − Esr )
(19)
i=Lmin
Nd (Lmin , LMAX , Dwin ) =
M X i=Lmin
(20) As a result of this analysis, we conclude that the optimal distance is a function of Lmin , LMAX and should be considered as an independent parameter. In order to evaluate our model we will repeat the extraction of correlation between the SNd and actual performance for different values of Dwin . Indeed, SNd offers an important 0.920 rank correlation (Spearman) to the maximum performance that can be achieved for the selected optimal n-gram range (see figure 10). SNd has a promising Pearson correlation of 0.896 to the performance. Therefore, our estimator is good in finding near-optimal Dwin values11 . In the given example of the DUC 2006 corpus, the best performance was 0.938 and the one returned using the estimation was 0.935, while the average over all candidate distances was 0.927, with a standard deviation of 0.008. The near-optimal values for the pair (Lmin , LMAX ) were according to the estimation values (4, 4), while in deed they optimal values were (1, 3) (DUC 2006 corpus). 11 This
holds for already decided optimal values of Lmin , LMAX as we found through a series of experiments. ACM Journal Name, Vol. V, No. N, Month 20YY.
·
32
G. Giannakopoulos et al.
Table VI. Correlation of Measures to the Content Responsiveness Metric of DUC 2006 for Automatic peers only. Within parethenses the p-value of the corresponding test. Metric Spearman Pearson Kendall Overall Responsiveness 0.718 0.833 Rouge-2 0.767 0.836 Rouge-SU4 0.790 0.850 BE-HM 0.797 0.782 AutoSummENG AutoSummENG B/S
0.870 (0.00) 0.858 (0.00)
0.904 (0.00) 0.899 (0.00)
0.712 (0.00) 0.712 (0.00)
Table VII. Pearson Correlation of Measures to the Content Responsiveness Metric of DUC 2006 for Automatic peers, Human peers and All peers, excluding peer 17. Within parethenses the p-value of the corresponding test. Evaluated Group Rouge-2 Rouge-SU4 BE-HM AutoSummENG - B/S Automatic Peers 0.84 (0.00) 0.85 (0.00) 0.78 (0.00) 0.91 (0.00) - 0.90 (0.00) 0.64 (0.05) 0.69 (0.03) 0.57 (0.09) 0.68 (0.03) - 0.67 (0.00) Human Peers All Peers 0.90 (0.00) 0.88 (0.00) 0.88 (0.00) 0.97 (0.00) - 0.97 (0.00)
5.
OVERALL PERFORMANCE OF AUTOSUMMENG
In order to check the performance of our method, compared to other existing methods, we used the Spearman correlation and Pearson correlation that is used in [Dang 2006], but for our method we have also calculated the Kendall’s tau correlation coefficient, which we consider to be the most fitting coefficient for the given task, based on its definition (see section 2.1). The Responsiveness measure in DUC 2006 was named Content Responsiveness, because another measure appeared named Overall Responsiveness (see [Dang 2006]). Briefly, Overall Responsiveness represents an overall quality measure (including grammaticality and other textual qualities) for a given system, while Content Responsiveness only refers to whether the required information were contained in summaries from a given system, without taking into account the well-formedness of output summary. The results concern application of the character n-gram Graph – Value representation with a symmetric window. P-values reported zero (0.00) indicate actual p-values that are rounded to zero when two digits are considered significant. We should note that we have also used an ordinary non-parametric bootstrapping approach12 with 10000 replications to better determine the results for our method. The corresponding results appear either in the AutoSummENG entries as seperate entries (see table VI) or as second value – p-value pairs (see table VII). 13 In table VI, there is an obvious difference between the performance of AutoSummENG and existing approaches. Table VII indicates the Pearson correlation performance of evaluation methods when not including system 17 of DUC 2006, for which BE-HM breaks (due to some characters in the input) and performs abnormally. As an overview of the major evaluation systems’ performance over the data of 12 For
an introduction to bootstrapping see [Efron and Tibshirani 1993]. the fact that the results using bootstrapping were only marginally modified over many experiments we did not further perform bootstrapping, considering the given original values to be good and indicative estimations of the process, not wanting to diversify the method of calculation of our results from other corresponding works. 13 Given
ACM Journal Name, Vol. V, No. N, Month 20YY.
Summarization System Evaluation Revisited: N-gram Graphs
·
33
Table VIII. Correlation of AutoSummENG to the Responsiveness Metric of DUC 2005 for Automatic peers, Human peers and All peers. Within parethenses the p-value of the corresponding test. Evaluated Group Spearman Pearson Kendall Automatic peers 0.906 (0.00) 0.908 (0.00) 0.755 (0.00) Human peers 0.857 (0.00) 0.830 (0.00) 0.764 (0.00) 0.957 (0.00) 0.985 (0.00) 0.847 (0.00) All peers Table IX. Correlation of AutoSummENG to the Content Responsiveness Metric of DUC 2006 for Automatic peers, Human peers and All peers. Within parethenses the p-value of the corresponding test. Statistical importance lower than the 95% threshold are noted by emphatic text in the parentheses. Evaluated Group Spearman Pearson Kendall Automatic peers 0.870 (0.00) 0.904 (0.00) 0.712 (0.00) Human peers 0.648 (0.04) 0.684 (0.03) 0.471 (0.07 ) All peers 0.935 (0.00) 0.966 (0.00) 0.804 (0.00) Table X. Correlation of AutoSummENG to the Content Responsiveness Metric of DUC 2007 for Automatic peers, Human peers and All peers. Within parethenses the p-value of the corresponding test. Statistical importance lower than the 95% threshold is noted by emphatic text in the parentheses. Evaluated Group Spearman Pearson Kendall Automatic peers 0.864 (0.00) 0.88 (0.00) 0.707 (0.00) Human peers 0.615 (0.06 ) 0.649 (0.04) 0.396 (0.12 ) 0.935 (0.00) 0.964 (0.00) 0.801 (0.00) All peers
DUC 2005 to 2007, the table XI has been provided, based partly on [Conroy and Dang 2008]. It should be noted that the AutoSummENG performance does not correspond necessarily to its optimal value, but rather to the performance achieved using pre-estimated parameters. Another important note is that, even though there is a difference between the performance of systems, statistic analysis indicates through confidence intervals that the difference in performance may be due to randomness (see also [Dang 2005; 2006; Hovy et al. 2005]). Even though the evaluation process itself contains the a-priori estimation step for its parameters, we wanted to check whether the model parameters determined for the corpus of DUC 2006 would function effectively when applied to DUC 2005 and DUC 2007 corpora. In tables VIII, IX, X we can see the results for all corpora (DUC 2005, DUC 2006, DUC 2007). In the tables the results have been separated by groups (automatic peers and human peers) and there is also the overall ranking correlation, including all peers. The results indicate that the DUC 2006 parameters perform well in other corpora as well, showing that the parameters did not simply overfit the DUC 2006 corpus. To verify this fact, we also determined model parameters for DUC 2005 and applied them to all corpora: DUC 2005, DUC 2006, DUC 2007. The results were once more satisfying as can be seen in table XII. This hints on the fact that the model parameters are more language-dependent than corpus dependent, but this will have to be verified against another language. The fact that our method does not require parsing of some kind, nor syntactic or grammatical analysis like other existing methods, offers an advantage, both in terms of complexity, as well as in terms of inherited noise from erroneous preprocessing ACM Journal Name, Vol. V, No. N, Month 20YY.
34
·
G. Giannakopoulos et al.
Table XI. Pearson Correlation of Measures to the Content Responsiveness Metric of DUC 20052007 for Automatic Systems Year BE(-HM) Rouge-2 Rouge-SU4 AutoSummENG 2005 0.87 0.94 0.93 0.91 2006 0.85 0.84 0.85 0.90 2007 0.89 0.88 0.83 0.88 Table XII. Correlation of AutoSummENG to the Responsiveness Metric of DUC 2005 and Content Responsiveness Metric of DUC 2006, 2007 for Automatic peers, Human peers and All peers using estimated parameters based on DUC 2005. Within parethenses the p-value of the corresponding test. Statistical importance lower than the 95% threshold are noted by emphatic text in the parentheses. Year - Evaluated Group Spearman Pearson Kendall 2005 - Automatic peers 0.840 (0.0) 0.885 (0.0) 0.669 (0.0) 2005 - Human peers 0.936 (0.0) 0.878 (0.00) 0.854 (0.00) 2005 - All peers 0.929 (0.00) 0.977 (0.00) 0.803 (0.0) 2006 - Automatic peers 0.871 (0.0) 0.891 (0.0) 0.709 (0.0) 0.759 (0.01) 0.715 (0.02) 0.566 (0.03) 2006 - Human peers 2006 - All peers 0.937 (0.00) 0.967 (0.00) 0.806 (0.0) 2007 - Automatic peers 0.842 (0.0) 0.871 (0.0) 0.687 (0.0) 0.659 (0.04) 0.673 (0.03) 0.442 (0.08 ) 2007 - Human peers 2007 - All peers 0.925 (0.00) 0.966 (0.00) 0.792 (0.0) Table XIII. Correlation of AutoSummENG to the Overall Responsiveness Metric G stands for Graph, H for Histogram, C for co-occurrence and V for value. Representation Spearman Pearson G–C 0.748 0.860 0.786 0.893 G–V H–C 0.811 0.920 H–V 0.537 0.858
(which was indicated as a problem in the case of BE [Dang 2006]). In the course of our experiments, we used the optimal values found for content responsiveness correlation to check the correlation of the proposed method to the Overall Responsiveness of systems in DUC 2006. The results are illustrated in table XIII. Once more the method seems to do adequately well, with the histogramco-occurrence version reaching the highest performance (for the given parameter setting of Lmin = 4, LMAX = 4, Dwin = 4). This indicates that our method can have more applications than meets the eye and this seems worth investigating. The fact that we need to estimate parameters, on the critic side of this analysis, can be time consuming and even error-prone, which will affect the overall performance of the system. This problem is only partially addressed by the robustness of the results for non-marginal parameter values. Another lesser drawback of our method is that the graph representation can be memory consuming, even though in our implementation14 we have optimized the code and the problem has been tackled. Finally, there have been no experiments in different languages, which means that we have not answered the question of whether the language-neutral approach will have similar performance in other languages. On the other hand, this does 14 The
full project, including source code, of AutoSummENG http://www.ontosum.org/static/AutomaticSummarization. ACM Journal Name, Vol. V, No. N, Month 20YY.
can
be
found
at
Summarization System Evaluation Revisited: N-gram Graphs
·
35
not contradict the fact that the approach remains strictly language-neutral in its methodology.
6.
CONCLUSIONS – FUTURE WORK
The AutoSummENG method for summarization evaluation is a promising method based on language-neutral analysis of texts and comparison to gold-standard summaries. The method is based on n-gram graphs, even though it provides support for other, histogram-based, approaches. We have found that the character n-gram graph representation, including information of neighbourhood frequency, can render the best results for the given task. The presented method appears to outperform current approaches in the corpus of DUC 2006, providing a good evaluation alternative for future attempts. Answering the questions posed in section 1.1, statistical information related to cooccurrence of character n-grams seem to provide important information concerning the evaluation process of summary systems. The actual representation used for capturing this information can be an n-gram graph, as this has been described within out method, with parameters optimized a priori. The distance metric to be preferred would be the Value Similarity between the graph representation of peer summaries and model summaries. Our method, complemented by the parameter optimization step, has proved to be a language-neutral, fully automated, contextsensitive method with competitive performance. Concerning future work, it would be interesting to use only symbols in our analysis of the summary texts, to see if there is hidden information in what we have called “non-symbols” or not. On the same basis, a parameter-free version of the method would determine n-grams of various length and synthesize a single n-gram graph, not requiring any input but the corpus of summaries. It would also be interesting to investigate different types of neighbourhood and different functions of importance for neighbourhood, as well as different weighting functions for the importance of matching n-grams of specific rank (e.g. longer vs. shorter n-grams) or nature (e.g. rare vs. common n-grams). We are planning to investigate the evaluation of other characteristics, like grammaticality, cohesion and so forth, using the same scheme with different parameters. In this investigation, the word n-gram dimension should be re-examined, because it may provide more noise-free information, considering the fact that whole words usually follow our definition of symbols by being meaningful. Furthermore, there is a drawback of our method tied to the complexity of extracting and comparing n-gram graphs. This drawback has already been handled in terms of implementation, but the algorithm itself holds a complexity much higher that that of constructing a histogram, per se. Therefore, it would be interesting to hold only “useful” subgraphs based on a statistical measure of usefulness or find an algorithmic alternative to our own. Even though a series of numerous experiments has already been conducted, we feel that the presented method should be further investigated, as it may hold implications concerning the potential of using the graph representation in a language neutral way for various NLP tasks. ACM Journal Name, Vol. V, No. N, Month 20YY.
36
·
G. Giannakopoulos et al.
ACKNOWLEDGMENTS
The research described within this paper was supported be the research and development project ONTOSUM15 , which is in turn funded by the Greek General Secretariat for Research and Technology. The corpora of DUC 2005, 2006, 2007 were kindly provided by NIST and has been used according to the TIPSTER, TREC directions. The whole range of experiments for this paper, as well as the editing process and statistical analysis were conducted on Open Source software. The JInsect toolbox is implemented with Java programming language and can be found as an open source project at http://www.ontosum.org/static/ AutomaticSummarization. Received January 2008 REFERENCES Anderson, J. 1985. Cognitive psychology and its implications (2nd Ed.), Second Edition ed. WH Freeman. Banko, M. and Vanderwende, L. 2004. Using n-grams to understand the nature of summaries. In HLT-NAACL 2004: Short Papers, D. M. Susan Dumais and S. Roukos, Eds. Association for Computational Linguistics, Boston, Massachusetts, USA, 1–4. Bunke, H. 1998. Error-tolerant graph matching: a formal framework and algorithms. Advances in Pattern Recognition, LNCS 1451, 1–14. Cavnar, W. B. and Trenkle, J. M. 1994. N-gram-based text categorization. In Proceedings of SDAIR-94, 3rd Annual Symposium on Document Analysis and Information Retrieval. Las Vegas, US, 161–175. Cleveland, W. 1981. LOWESS: A Program for Smoothing Scatterplots by Robust Locally Weighted Regression. The American Statistician 35, 1, 54–54. Conroy, J. and Dang, H. T. 2008. Mind the gap: dangers of divorcing evaluations of summary content from linguistic quality. In Coling 2008 (to appear). Copeck, T. and Szpakowicz, S. 2004. Vocabulary Usage in Newswire Summaries. In Text Summarization Branches Out: Proceedings of the ACL-04 Workshop. Association for Computational Linguistics, 19–26. ´, S., and Lopes, J. 1999. Using LocalMaxs Algorithm for the da Silva, J., Dias, G., Guillore Extraction of Contiguous and Non-contiguous Multiword Lexical Units. Proceedings of the 9th Portuguese Conference on Artificial Intelligence: Progress in Artificial Intelligence, 113–132. Dang, H. 2005. Overview of DUC 2005. In Proceedings of the Document Understanding Conf. Wksp. 2005 (DUC 2005) at the Human Language Technology Conf./Conf. on Empirical Methods in Natural Language Processing (HLT/EMNLP 2005). Dang, H. 2006. Overview of DUC 2006. In Proceedings of HLT-NAACL 2006. Duda, R., Hart, P., and Stork, D. 2001. Pattern classification. Wiley New York. Efron, B. and Tibshirani, R. 1993. An Introduction to the Bootstrap. Chapman & Hall/CRC. Endres-Niggemeyer, B. 2000. Human-style www summarization. Erkan, G. and Radev, D. 2004a. LexRank: Graph-based Lexical Centrality as Salience in Text Summarization. Journal of Artificial Intelligence Research 22, 457–479. Erkan, G. and Radev, D. 2004b. Michigan at DUC 2004 – Using Sentence Prestige for Document Summarization. Proceedings of the Document Understanding Conferences Boston, MA. Giannakopoulos, G., Karkaletsis, V., and Vouros, G. 2006. Automatic Multi-document Summarization and Prior Knowledge: Past, Present and Vision (DEMO-2006-2). Technical report, NCSR Demokritos. Hollander, M. and Wolfe, D. 1973. Nonparametric statistical inference. New York . 15 See
also http://www.ontosum.org/
ACM Journal Name, Vol. V, No. N, Month 20YY.
Summarization System Evaluation Revisited: N-gram Graphs
·
37
Houvardas, J. and Stamatatos, E. 2006. N-gram feature selection for authorship identification. In J. Euzenat, and J. Domingue (Eds.) Proc. of the 12th Int. Conf. on Artificial Intelligence: Methodology, Systems, Applications (AIMSA’06). 77–86. Hovy, E., Lin, C., and Zhou, L. 2005. Evaluating DUC 2005 using Basic Elements. Proceedings of DUC-2005 . Hovy, E., Lin, C., Zhou, L., and Fukumoto, J. 2005. Basic Elements. Hovy, E., Lin, C., Zhou, L., and Fukumoto, J. 2006. Automated Summarization Evaluation with Basic Elements. Proceedings of the Fifth Conference on Language Resources and Evaluation (LREC). Kendall, M. 1962. Rank correlation methods. Hafner New York. Lamkhede, S. 2005. Multidocument Summarization Using Concept Chain Graphs. M.S. thesis. Lin, C. 2004. Rouge: A Package for Automatic Evaluation of Summaries. Proceedings of the Workshop on Text Summarization Branches Out (WAS 2004), 25–26. Lin, C. and Hovy, E. 2002. Manual and automatic evaluation of summaries. In Proceedings of the ACL-02 Workshop on Automatic Summarization-Volume 4. Association for Computational Linguistics Morristown, NJ, USA, 45–51. Lin, C.-Y. and Hovy, E. 2003. Automatic evaluation of summaries using n-gram co-occurrence statistics. In NAACL ’03: Proceedings of the 2003 Conference of the North American Chapter of the Association for Computational Linguistics on Human Language Technology. Association for Computational Linguistics, Morristown, NJ, USA, 71–78. Luhn, H. 1958. The automatic creation of literature abstracts. IBM Journal of Research and Development 2, 2, 159–165. Mani, I. and Bloedorn, E. 1997. Multi-document summarization by graph search and matching. In Proceedings of AAAI-97. AAAI, 622–628. ¨ tze, H. 1999. Foundations of Statistical Natural Language Processing. Manning, C. and Schu The MIT Press. Marcu, D. 2000. The Theory and Practice of Discourse Parsing and Summarization. The MIT Press. Massey Jr, F. 1951. The Kolmogorov-Smirnov Test for Goodness of Fit. Journal of the American Statistical Association 46, 253, 68–78. Matsuo, Y., Ohsawa, Y., and Ishizuka, M. 2001. A Document as a Small World. In Proceedings the 5th World Multi-Conference on Systemics, Cybenetics and Infomatics (SCI2001. Vol. 8. 410–414. Mihalcea, R. 2004. Graph-based ranking algorithms for sentence extraction, applied to text summarization. In Proceedings of the 42nd Annual Meeting of the Association for Computational Lingusitics (ACL 2004)(companion volume). ACL. Mihalcea, R. 2005. Multi-document Summarization with iterative graph-based algorithms. In Proceedings of the First International Conference on Intelligent Analysis Methods and Tools (IA 2005). McLean. Mohamed, A. and Rajasekaran, S. 2006. Query-Based Summarization Based on Document Graphs. Navarro, G. 2001. A guided tour to approximate string matching. ACM Computing Surveys 33, 1, 31–88. Nenkova, A. 2006. PhD in Philosophy. Ph.D. thesis, Columbia University. Otterbacher, J., Erkan, G., and Radev, D. R. 2005. Using random walks for question-focused sentence retrieval. In HLT ’05: Proceedings of the conference on Human Language Technology and Empirical Methods in Natural Language Processing. Association for Computational Linguistics, Morristown, NJ, USA, 915–922. Papineni, K., Roukos, S., Ward, T., and Zhu, W. 2001. BLEU: a method for automatic evaluation of machine translation. Proceedings of the 40th Annual Meeting on Association for Computational Linguistics, 311–318. Passonneau, R., McKeown, K., Sigelman, S., and Goodkind, A. 2006. Applying the Pyramid Method in the 2006 Document Understanding Conference. ACM Journal Name, Vol. V, No. N, Month 20YY.
38
·
G. Giannakopoulos et al.
Radev, D. 2000. A common theory of information fusion from multiple text sources, step one: Cross-document structure. In Proceedings, 1st ACL SIGDIAL Workshop on Discourse and Dialogue. Radev, D., Jing, H., and Budzikowska, M. 2000. Centroid-based summarization of multiple documents: sentence extraction, utility-based evaluation, and user studies. ANLP/NAACL Workshop on Summarization. Raymond, J., Gardiner, E., and Willett, P. 2002. RASCAL: Calculation of Graph Similarity using Maximum Common Edge Subgraphs. The Computer Journal 45, 6, 631. Saggion, H. and Lapalme, G. 2002. Generating indicative-informative summaries with sumUM. Computational Linguistics 28, 4, 497–526. Spearman, C. 1906. Footrule for measuring correlation. British Journal of Psychology 2, 89–108. Stephens, M. 1974. EDF Statistics for Goodness of Fit and Some Comparisons. Journal of the American Statistical Association 69, 347, 730–737. Ukkonen, E. 1992. Approximate string-matching with q-grams and maximal matches. Theoretical Computer Science 92, 1, 191–211. van Halteren, H. and Teufel, S. 2003. Examining the consensus between human summaries: initial experiments with factoid analysis. In Proceedings of the HLT-NAACL 03 on Text summarization workshop-Volume 5. Association for Computational Linguistics Morristown, NJ, USA, 57–64. Voorhees, E. 2003. Overview of the TREC 2003 Question Answering Track. In Proceedings of the Twelfth Text REtrieval Conference (TREC 2003). Witte, R., Krestel, R., and Bergler, S. 2006. Context-based Multi-Document Summarization using Fuzzy Coreference Cluster Graphs. In Proceedings of Document Understanding Workshop (DUC). New York City, NY, USA. Zens, R. and Ney, H. 2006. N-gram posterior probabilities for statistical machine translation. 72–77. Zhou, L., Lin, C., Munteanu, D., and Hovy, E. 2006. ParaEval: Using Paraphrases to Evaluate Summaries Automatically. In Proceedings of the Human Language Technology Conference - North American chapter of the Association for Computational Linguistics annual meeting (HLT/NAACL-2006).
ACM Journal Name, Vol. V, No. N, Month 20YY.