necessarily add up to 156 since most questions in the survey were optional. ... yielded for each theme, they do not necessarily indicate the importance of a ...
Summarizing and Measuring Development Activity Christoph Treude, Fernando Figueira Filho, Uirá Kulesza Departamento de Informática e Matemática Aplicada Universidade Federal do Rio Grande do Norte Natal, RN, Brazil
{ctreude,fernando,uira}@dimap.ufrn.br
ABSTRACT Software developers pursue a wide range of activities as part of their work, and making sense of what they did in a given time frame is far from trivial as evidenced by the large number of awareness and coordination tools that have been developed in recent years. To inform tool design for making sense of the information available about a developer’s activity, we conducted an empirical study with 156 GitHub users to investigate what information they would expect in a summary of development activity, how they would measure development activity, and what factors influence how such activity can be condensed into textual summaries or numbers. We found that unexpected events are as important as expected events in summaries of what a developer did, and that many developers do not believe in measuring development activity. Among the factors that influence summarization and measurement of development activity, we identified development experience and programming languages.
Categories and Subject Descriptors D.2.9 [Software Engineering]: Management
Keywords Summarization, empirical study, development activity
1.
INTRODUCTION AND MOTIVATION
Software developers produce a large number of artifacts in their day-to-day work, ranging from source code and development issues to online discussions and documentation. Making sense of this plethora of data is becoming harder with every new artifact created. Despite many metrics, software projects continue to be difficult to predict and risky to conduct [6] and finding relevant information within the vast amount of information available is challenging [23]. The need to condense the activity taking place in a software project into a more consumable format has given rise to software analytics [7] and many tools that offer awareness
support [54], such as the dashboards in IBM’s Jazz [56] or Palant´ır’s views for “awareness in the large” [50]. Many of these tools attempt to condense development activity into numbers, such as the number of issues closed by a developer or the number of open issues. While the resulting peer pressure is often seen as a good thing (“The need to look like you are making progress is useful” [56]), it is evident that numbers are insufficient to capture all aspects of development activity, as we found in previous research: “Just because one team has a lot more defects than another, that doesn’t necessarily mean that the quality of that component is any worse” [56]. Recently, qualitative dashboards have been proposed to improve developers’ situation awareness [1]. Even though many metrics have been introduced to measure a developer’s activity, such as the number of tasks per month [59], the number of source code lines per hour [17], or the number of logical source statements per month [34], none of these metrics have found wide acceptance. Given recent advances in the automatic summarization of software artifacts, such as bug reports [47, 48], classes [43], methods [51], or code snippets [58], it is conceivable that summaries could be generated to capture the development activity of a developer or team in a given time frame. In other words, development activity cannot only be condensed into numbers, but also into textual summaries. Potential advantages of such summaries would be the possibility of explaining rather than simply measuring, the opportunity to include context where needed, and reducing the cognitive effort required for consuming, interpreting, and making sense of large amounts of data. This combination of textual and numerical data to summarize development activity is the ultimate goal of this work. As a first step, here we present the results of an empirical study with 156 GitHub users to identify (1) what information such a summary should contain, (2) how development activity can be measured, and (3) what factors influence how development activity can be condensed. Using analysis methods from Grounded Theory, we found that unexpected events are as important as expected events when summarizing development activity, and that many developers do not believe in the existence of any measure suitable for measuring development activity. We also identify factors which influence how development activity can be condensed, including experience and programming languages.
2.
RELATED WORK
Work related to this research can be divided into work on productivity, awareness, and summarization.
2.1
Measuring Developer Productivity
Previous work on developer productivity has attempted to measure developer activity in different ways. Looking at different conceptualizations of developer productivity in the literature, Meyer et al. [39] found a long list of definitions: the number of tasks [59], function points [30], lines of code [17, 44], modification requests [42], or logical source statements [34] in a given time frame or compared to spent effort [28, 32]; or alternatively the resolution time of a modification request [8] or the ratio of editing events to selection and navigation events [31]. Since there is no consensus on how to measure developer activity, in this work, we asked developers how they would design such a measure. Meyer et al. [39] conducted a study on software developers’ perceptions of their own productivity through a survey and an observational study. They found that developers perceive their days as productive when they complete many or big tasks without significant interruptions or context switches. In contrast to their work, we focus on measuring developer activity. In earlier work, DeMarco and Lister [16] studied programmers in a one-day implementation benchmarking exercise. They found evidence that characteristics of the workplace and of the organization seemed to explain a significant part of the difference in productivity between different programmers. Blackburn et al. [3] found team size to have a negative correlation with productivity. Boehm [4] described various avenues for improving developer productivity, including better management, staffing, incentives, work environments, integrated development environments, rework elimination, and component reuse. In contrast, in this work, we focus on summarizing and measuring development activity.
2.2
Awareness in Software Development
Awareness is related to social transparency [55] and defined as “an understanding of the activities of others, which provide context for your own activity” [18]. Awareness spans technical and social aspects [14] as well as articulation work [40], and it is indispensable in sustaining team cognition [25] and in constructing mental models of a software project [35]. However, who should be aware of whom is an open question [15]. Since maintaining awareness is time-consuming [45], many tools have been developed to support awareness in software development. Seesoft [19] is a visualization approach which maps each line of source code to a thin row and uses colours to indicate changes. Augur [24] adds software development activities to a Seesoft-style visualization, allowing developers to explore relationships between artifacts and activities. Palant´ır [49] provides insight into workspaces of other developers, focusing on artifact changes. FastDASH [2] uses a representation of a shared code base to highlight current activities aggregated at the level of files and methods. Social Health Overview [20] mines the history of development artifacts to reveal social and historical patterns in the development process. WIPDash [29] is a large screen visualization for small co-located teams designed to increase awareness of tasks and source code activity. The dashboard component of IBM’s Jazz [56] is intended to provide information at a glance and to allow easy navigation to more complete information. The dashboards of the Pco-Vision platform [41] are intended to support and enhance project-based learning. Our work is related to awareness since summaries of devel-
opment activity have the potential to support awareness in collaborative software development. We asked software developers what information they expect to be kept aware of, and what information they disseminate to others.
2.3
Summarizing Software Artifacts
Our assumption that development activity can automatically be summarized is based on the large body of work that has introduced summarizers for software artifacts. Haiduc et al. [26] explored the suitability of various automatic summarization techniques for generating source code summaries and found that a combination of text summarization techniques is most appropriate for source code summarization. Moreno et al. [43] automatically summarized Java classes, focusing on the content and responsibilities of a class rather than its relationships with other classes. Sridhara et al. [51] presented a technique that summarizes a method’s actions, which requires the detection of code fragments implementing high level actions within methods [52]. McBurney and McMillan [38] proposed to include method context in summaries of Java methods by analyzing how these methods are invoked. Rastkar et al. [46] introduced an automated approach that produces a natural language summary which describes cross-cutting concerns and how they are implemented. Ying and Robillard [58] investigated the feasibility of summarizing code examples for better presenting such examples. Focusing on bug reports, Rastkar et al. [47, 48] investigated whether it is possible to summarize them automatically and effectively so that developers can consult summaries instead of entire bug reports. Czarnecki et al. [10] posed three hypotheses on what makes a sentence in a bug report relevant: discussing frequently discussed topics, being connected to other sentences, and keeping focused on the bug report’s title and description. Mani et al. [37] proposed to improve the quality of unsupervised bug report summarization techniques by automatically removing noise, such as email dumps and chat transcripts. All of these approaches suggest that it is indeed possible to automatically summarize software artifacts.
3.
RESEARCH METHOD
In this section, we present our research questions and the methods used for data collection and analysis. In addition, we show demographic data about the study participants.
3.1
Research Questions
Our research is guided by the following research questions: RQ1 From a developer’s perspective, what information should be included in a summary of development activity? RQ2 How would software developers design a metric to measure the input/output of a software developer? RQ3 What factors influence how development activity can be condensed into textual summaries or numbers? Answers to these questions will shed light on the requirements for tool support that automatically condenses development activity into words (i.e., textual summaries) or numbers (i.e., measures). We make no distinction between individual developer activity and project activity in this study
Data Collection
To answer our research questions, we designed a webbased survey which was sent to 2,000 GitHub users (156 responses) and we conducted follow-up interviews with ten of the survey respondents to validate the findings. Table 1 shows the most important questions of the survey where each horizontal line represents a page break. The complete survey is available at http://tinyurl.com/DevActivities. The first three questions ask for demographic information from each participant. In addition to the data collected through these questions, we used the data available on GitHub about each participant in the data analysis. Following Fink’s advice on survey design [22], we used specific time periods and a specific scenario to make the question about expected content in a summary (question 4) as concrete as possible. The answer options to question 5 (potential sources for summary items) were not yet visible when answering the previous questions to minimize bias and avoid generic answers, such as “All these options sound good”. Since the survey instrument was static, it was not possible to use the answers to question 4 as answer options in question 5. To get participants to think about measuring development activity, we asked them to compare their own development activity in the two months prior to the survey (question 7) before asking how they would design a metric to automate such a comparison (question 8). Again, specific options that we asked about in question 9 were not visible when answering the earlier questions. The answer options to question 9 were taken from de Lima [13] since his work also explores different ways of measuring development activity. To distribute the survey, we downloaded all GitHub user data on December 6, 2014. Out of a total of 3,271,509 users, 616,501 had published their email address. We further limited the study population to users that had made at least one public contribution (push, pull, or issue creation) in the past twelve months, resulting in 384,144 users. We randomly sampled 2,000 of these users and asked them to complete the survey. A draw for corporate gift cards was conducted to incentivize participation. We received 156 responses (response rate 7.8%). After analyzing all responses, we sent messages to 21 survey respondents asking for a follow-up interview, ten of which resulted in an interview. The interviews were semi-structured, clarifying survey responses and asking about themes that emerged in our analysis.
3.3
Data Analysis
Considering the exploratory nature of our research questions, we used methods from Grounded Theory [9] to analyze the collected data. We designed our study from first principles since to the best of our knowledge, no tool that summarizes development activity has been widely adopted in practice. In three coding sessions of about four hours each, the first two authors collaboratively performed open coding of the responses to open-ended questions in the survey. Answers related to summarizing development activity and answers related to measuring development activity were coded separately. Collaborative open coding was done until saturation was reached. In both cases, this happened after coding approximately 50 to 60 survey responses. The first two authors then divided the remaining survey responses
participants
3.2
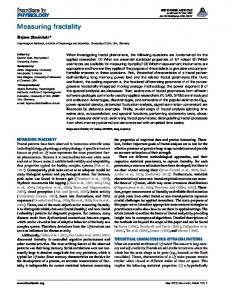
40 30 20 10 0
2 3 4 5+ projects Figure 1: Number of projects across participants participants
since our research questions do not assume a particular organizational structure for either project or team.
0
1
40 20 0
0
1
2
3
4
5
6
7
8
9 10+
experience (in years) Figure 2: Experience across participants and coded them separately, consolidating additional codes in an additional collaborative session. In the end, we obtained 120 codes for the summarization part of the study, and an additional 119 codes for the measurement part. We used axial coding to find higher level conceptual themes to answer our research questions. In the last phase of the research, core themes were formed into statements that we validated through the follow-up interviews.
3.4
Demographics
In this section, we present basic demographic information about the participants in our study. Figure 1 shows the distribution of the number of active projects per participant as indicated by their survey responses. By far most of the participants were active in more than one project. Figure 2 shows the distribution of years of development experience per participant. Half of them had at least five years of development experience, and many indicated having ten or more years of experience. For the majority of participants, developing software was part of their job: 131 (85%) of the participants gave a positive response to the corresponding survey question compared to 23 (15%) negative responses.1 124 (84%) of the participants indicated that they currently develop software in a team, compared to 24 (16%) solo developers. We calculated all correlations between the demographic data we collected using Spearman’s rho. In addition to all GitHub metrics being correlated with each other, there is a moderate positive correlation between a participant’s experience and the number of projects they are involved in. All other correlations are weak (following Dancey and Reidy’s interpretation [12]).2 In the following sections, we will correlate responses to the survey questions with this demographic data.
4.
FINDINGS
In this section we report our findings on summarization (Section 4.1) and measurement (Section 4.2) of software de1 Note that the numbers for different survey questions do not necessarily add up to 156 since most questions in the survey were optional. 2 The complete data is available in our online appendix at http://tinyurl.com/DevActivityAppendix.
1 2 3 4
5
6 7
8 9
10 11
Table 1: Survey questions (excerpt) In how many different software development projects are you currently an active participant? (drop-down) Is developing software part of your job? (yes/no) For how long have you been developing software? (drop-down) Assume it’s Monday morning and you have just returned from a week-long vacation. One of your colleagues is giving you an update on their development activities last week. What information would you expect to be included in their summary? (text box) In your opinion, are any of the following items important in summaries of what a developer did last week? - Names of methods added by the developer, Commit messages by the developer, Titles of issues closed by the developer, Titles of issues opened by the developer, Titles of issues commented on by the developer, Source code comments added by the developer (5-point Likert scale for each option) What other information sources might be useful to consider for such a summary? (text box) In terms of input/output, how would you compare your development activity in November to that in October? - I had more/better development activity in October - I had more/better development activity in November - October and November were similar in terms of development activity for me How would you design metrics to automatically measure the input/output of a software developer in a given month? Why? (text box) In your opinion, are any of the following metrics suited to measure input/output of a developer? - Lines of code, Number of bugs fixed, Complexity of code added or modified, Low number of bugs introduced (5-point Likert scale for each option) What other aspects are important to consider when assessing input/output of a developer? (text box) Do you currently develop software in a team? (yes/no)
velopment activity. For each code that emerged in the qualitative analysis, we indicate how many participants mentioned the particular theme in superscript. Note that these numbers only indicate how much evidence the data analysis yielded for each theme, they do not necessarily indicate the importance of a theme since we did not explicitly ask all participants about each theme specifically.
4.1
Summarizing Development Activity
Our findings related to the summarization of development activity can be divided into findings on primary artifacts, expected and unexpected events, coordination, and secondary artifacts. In addition, we describe the factors that influence what information should be included in a summary.
4.1.1
Primary Artifacts
The importance of being updated on how different artifacts move through the development cycle was a recurrent theme among the participants. In our analysis, we observed a difference between primary artifacts(98) —those that move through a development cycle—and secondary artifacts(67) . We summarize our findings regarding secondary artifacts in Section 4.1.5. Among the primary artifacts, projects(46) play an important role, as P83’s request of what should be in a summary shows: “Any projects that were completed and started”. Within these projects, information on development tasks(46) is essential, as described by P141: “Task state transition history – which tasks were taken, which were done, which were tested”. Similarly, P27 described the importance of features(33) : “I would expect to include a description of the new feature, how the new feature impacts the current work flow”. Other primary artifacts that were mentioned included documentation(12) , modules(6) , and user stories(6) , as detailed by P20: “I’d like to know how many stories moved through the development cycle”.
4.1.2
Expected
In this section, we discuss in more detail the information that developers need about the process(140) that these
Table 2: High-level codes that emerged for process expect. 117 unexpect. 121 coord. 69 status 93 changes 72 people 29 planning 53 bugs 65 communic. 27 time 29 difficulties 32 awareness 24 goal 18 blocked 21 integration 9 justification 15 releases 5 changes 4 strategy 2 responsib. 1 primary artifacts follow. Table 2 shows the higher-level themes that emerged for process in our study. Expected(117) events describe status updates that are generally not surprising to the consumer of the summary (i.e., some primary artifact is following the development cycle as planned), whereas unexpected(121) events are unforeseen. We first focus on the expected updates, where updates on the status(93) play a central role as P40 explained: “I would report a status report of activities, what was done, what state, in which branch, which [is] the purpose of the activity”. Among the possible status updates, participants mentioned finished(30) , in progress(18) , changed(17) , added(16) , planned(11) , deployed(6) , removed(6) , delivered(2) , and reviewed(2) . P142 gave an example of what such a summary would look like: “I finished story XXX. When I was working on it I found Y problem. In order to fix it I created and scheduled story Z. In addition we had 10 min of unscheduled downtime [due] to a bad deploy”. While such summaries should contain some detail(16) , for example as expressed by P63: “Functionality changes with point form details with description and location of changes”, they should mostly be high level(15) , as this quote from P121 shows: “List of high level features and explanation of how much progress was made on any of them”. Balancing these two ends of the spectrum is one of the challenges in summarizing development activity. When deciding what information to include in a summary, priority(6) and severity(1) were
mentioned as criteria. In addition, the content of a summary depends on other communication channels that developers have already used, as this example from P32 shows: “Well, first of all, I would know medium and low priority errors on production environment of the current projects (if a high priority error occurs we call us via phone)”. Another crucial aspect when summarizing development activity is planning(53) , mostly for the time frame of a week(31) or a day(4) , and often based on priorities(10) , as indicated by P10: “What to focus on for the coming week, based on business priorities”. Long-term planning often involves new projects(2) or the project budget(1) . Status updates usually involve a time(29) aspect, as this quote from P156 shows: “If we are on time and if we need more time to finish the job”. Another example was given by P99: “I’m very OC when it comes to timelines/deadlines so I think I would say everything is right on track”. This focus on deadlines or milestones(12) was confirmed by P123: “How far the development has come (what milestones [have] been reached and/or set up)”. Time is imperative in terms of how much time has been spent(7) and in terms of how much time is required(7) , as indicated by P144: “Can we keep the deadline with the current status?”. Other themes that emerged from the analysis include updates on goals(18) , in particular as they are related to business concerns(4) . These findings are unsurprising given the ability of commercial tools such as Rally or Rational Team Concert to monitor how artifacts move through the development cycle and to send state changes to team members. After describing the expected events that developers want to see in a summary of development activity, in the next section, we focus on the unexpected events that emerged from the data we collected.
4.1.3
Unexpected
Developers need to know about unexpected(121) events that happened in their projects. For example, this is the ideal summary envisioned by P49: “Work log, what functionality [has] been implemented/tested. What were the challenges. Anything out of the ordinary”. P57’s version is similar: “What we have to do, what has been done while I was away, is everything going as expected?, something strange happened (i.e. the client complains about something or we did a big mistake), some critical decision has been chosen?, some architectural decisions had been chosen?”. Another example came from P111: “I would expect a description of any drastic changes to the codebase, what major tasks were completed, if any responsibilities were re-distributed, if any short-term goals were changed and in particular if anything that was once estimated as not-difficult turned out to be more difficult than expected”. P60 also mentioned unexpected issues: “This is what I got done, since you left. This issue came up, that we did not expect. Now it’s going to take longer/shorter” and P121 talked about unusual problems: “Description of the features they worked on and any unusual problems/antipatterns they encountered”. In this section, we explain in more detail what information about unexpected events software developers would like to see in a summary of software development activity. Many of the unexpected items that participants mentioned were unexpected changes(72) . For example, changes to the requirements(13) play an essential role, as P78 explained: “I’d expect them to start by going over any changes
to the spec, features completed, and major bug closures and openings”. Unexpected events can be related to version control(13) , in particular with regard to branches(9) , such as merging(4) or unmerging(1) , as P133 described: “I would include in my summary the latest commits as well as what I have unmerged on my working branch”. In addition, the themes of new(1) , active(1) , and closed(1) branches emerged from our analysis. Other changes that play a crucial role are changes to an API(10) , as P61 explained: “API changes are key, much more than documentation (so comments, commit messages and whatnot) in my opinion”. New dependencies(6) are another important item, as described by P144: “Is there any new 3rd party dependency that is added or removed”. Developers want to be informed about changes to the design(6) , as stated by P138: “Business level documents change logs. If [there] are tracked changes to requirements and design documents [that] would be useful”, and architecture(6) , as described by P10: “Meetings attended and the outcomes of those meetings, particularly when large architectural decisions have been made during those meetings”. Changes to the environment(6) emerged as a theme from the analysis in terms of the deployment environment(1) (such as “Version X has been deployed to server Y” as described by P10) and the development environment(2) . For example, P5 described the relationship between task status and problems in the development environment in his example summary: “We had problems in [the] development environment caused by a third party API. This made me unable to complete the task I was working on”. The criticality(6) of such changes is decisive, as shown by this example from P71: “I would give details about any critical event (bugs, major architecture changes, task updates)”, and changes to goals(5) or business priorities are among the most critical, as P53 described: “The biggest source of change and uncertainty in software development is the changing business environment. At my place of work business priorities and expected features change frequently enough to make long term technical planning challenging. I think this difficultly is widely shared in many [businesses] which conduct software development”. Related to that are conceptual changes(2) or changes to estimates(2) , as indicated by P117: “Revised estimate of time to completion for outstanding goals/projects”. Bugs(65) are by definition unexpected, and they play a crucial role when summarizing development activity, as described by P83: “I would want them to know if any (serious) bugs came up”. Bug fixing(32) is an important activity to be included in a summary, as shown in this example summary given by P70: “We’ve seen a new issue on one of our clusters: XXXX (). Turns out it was caused by YYYY. I’ve spent 2 days to diagnose and fix the issue: . Apart from this I’ve written a design document on component ZZZZ and started working on the prototype: . I’ve also fixed these three bugs: AAAA, BBBB, CCCC”. The root cause(3) and solution(15) used when fixing bugs were also mentioned by participants. In addition to bugs fixed, bugs found(16) or newly introduced(3) play an important role as shown in these two descriptions from P22 and P53, respectively: “I usually give status updates whenever I finish a major part of my end of the project. Weekly updates would include telling
him what he needs to do to use my code, any bugs that I’ve found, what my next steps are, and a way to look at it working”, “I would tell him the most significant changes we have done in development since he left. Also the problems I found and how I overcame those situations, what I’m doing in this moment and if I have any problem in this moment”. Bugs can have been reported(1) by a client, as this example summary from P95 shows: “Last week, a client reported that retrospectively adding products to the database causes a fatal server crash. After investigating the OS, server software, and database, it turned out that the source of the problem was invalid validation in the Rails WebAPI. This issue is now fixed and clients have been informed. However, this fix might impact our archiving plans as clients may now update the archive retrospectively”. Downtime(1) emerged as another theme from the analysis, also related to bugs. Problems or difficulties(32) are an essential part of a summary on development activity, as shown in this example from P76: “I’ve been working on this feature [and] bug fix and have completed this much while encountering these problems. My next steps are...”. These problems can originate from mistakes(1) , and often lessons are learned when solving a problem, as P16 described in what he would expect from a summary: “Short description about what he did (problem he solved, what he learnt)”. A common problem in collaborative software development is that one developer is blocked(21) on another one, as this hypothetical summary from P9 illustrates: “I am blocked on Nate for app-22 which requires a ORM module to be completed before I am able to work on that ticket”. The workflow(4) plays an necessary role in such a summary, as underlined by P131: “What I think is more important to do not to break the workflow: Joe must have the task x, y, z finished so I can use them or write tests”. A crucial difference between expected events (cf. previous section) and unexpected events is that unexpected events usually require some kind of justification(15) . For P22, unexpected events and their justification are the most critical part of a meeting: “We cut our developer status meetings way down, and started stand up meetings focusing on problems and new findings rather than dead boring status. Only important point is when something is not on track, going faster than expected and why”. P144’s idea of a summary is as follows: “[I] would give a list about the tasks I had [scheduled] to complete by [now] and provide details about those which are not yet resolved with the reason why they are not”. The last theme that emerged from the analysis as part of the unexpected events pertains to interesting problems(6) and interesting solutions(3) . This quote by P78 illustrates the importance of such problems and solutions: “I’d like them to then describe any odd or novel obstacles they had to overcome while coding, and whether the solutions to those obstacles could be used in a wider context in later development”.
4.1.4
Coordination
Coordination(69) plays a crucial role in collaborative software development, and it emerged as a core theme in the data analysis. Coordination is first of all about people(29) , and participants mentioned developers(12) as well as customers(11) and users(4) (which may or may not be the same group of individuals). P4’s example sum-
mary underlines the importance of customers: “I’ve implemented/stubbed these modules (a, b, c, ...) and I found these problems. [Customer] called/emailed regarding to [feature] and [problem or suggestion]”. P61 talked about users in what he expects in a summary: “Generally everything involving users (or dummy users) interacting with the product, with relative feedback”. Coordination needs communication(27) , which can come in many different forms. Again quoting P61: “I would begin by summarizing the work [done] and the status of progress in the various projects. I’d then proceed to report any important communications between me and the clients, the bosses or other colleagues”. Since communication often happens in meetings, the information on these meetings(9) is vital as well, as P41 explained: “The minutes of any development meetings and a diff file from between now and the previous week would be all I needed to get up to date”. Feedback(8) was mentioned by participants as well as requests for help(5) or offers of help(4) , as these examples from P106 and P151 show: “If they are having any problems that they need help with”, “A brief view of the issues they believe I can help to solve quickly”. Some issues should be mentioned in summaries because they require discussion(3) , as shown by P19’s quote: “For example, last week, I would have said that I have about 3 projects ready to be upgraded; I sent images (screenshots) of new ideas, and restated issues that require discussion”. One significant aspect of coordination in software development is awareness(24) , as shown by what P42 expects in a summary: “Any caveats in the design or implementation that others should be aware of ”. Developers want to be kept aware of refactorings(9) , as shown in this example summary by P145: “I have completed a major refactoring of a Wordpress plugin, and the plugin is now being tested in a sandbox prior to rollout”. Similar items that are necessary to communicate so that developers are aware of them include reusable components(2) , optimizations(2) , compatibility(2) , and workload(1) . Coordination is paramount during integration(9) , as P22 explained: “I would ask what it will take to provide me with integration points I foresee I will be needing”. Coordination is required about releases(5) , when changes are needed(4) , or when responsibilities are (re-)distributed(1) . Finally, the themes of strategy(2) and philosophy(1) emerged as being important in summaries of development activity.
4.1.5
Secondary Artifacts
Summaries do not stand on their own, but they are often supported by and related to secondary artifacts(67) . As opposed to the primary artifacts described earlier in this section, secondary artifacts do not go through a development cycle and are either fine-grained artifacts that do not change status (such as a commit) or they present a view on data available in a repository (such as a burndown chart). Artifacts related to testing(31) play a central role as secondary artifacts in summaries of development activity, in particular related to coverage(3) and outcomes(1) . Commits(21) are relevant as well, as P71 described: “Commit tree is very important when working with large teams”. However, commits might not be high-level enough to always be useful in a summary, as P20 indicated: “I’d also look at the git history for an overview of merged feature branches. I wouldn’t look through each commit, but rather view the
Table 3: Rating of summary sources mean method names 2.8767 commit messages 3.6759 issues closed 4.0759 issues opened 4.0342 issues commented 3.2966 code comments 2.9795 merges to get an idea of time/size of each feature”. Other artifacts include comments(10) , code reviews(8) , emails(7) , pull requests(4) , and meeting notes(6) . P93 thought that summaries could improve meetings: “Anything that amplifies signal/noise ratio of daily standups (1. What has been accomplished since the last meeting? 2. What will be done before the next meeting? 3. What obstacles are in the way?)”. Secondary artifacts further include data from workflow management tools(4) , working examples(3) , screenshots(1) , burndown charts(2) , wikis(2) , blogs(2) , metrics(2) , and patches(2) . P98 detailed the role of patches: “If any patches were contributed by volunteers or non-regular developers it is useful to know who worked on them”. Finally, cards(2) were mentioned, for example by P97: “I want to know the ones he did, the ones he didn’t, and I’ll check if this makes him on or out his schedule”.
4.1.6
Factors Influencing Summary Content
After detailing the content that developers expect when they are presented with a summary of development activity, in this section, we investigate what factors influence the content that should be considered. We use the answers to question 5 in the survey (cf. Table 1) as well as the followup interviews to explore this question. Table 3 shows how the survey participants rated different potential summary sources. The highest ratings on a 5-point Likert scale (1 = not important at all, 5 = very important) were given to issue titles of opened and closed issues. At the other end of the spectrum, code comments and the names of methods were rated the lowest. Several survey participants explained what their answers depended on. For example, P78 and P115 mentioned the quality of commit messages and comments as a factor: “Looking through commit logs can also be extremely useful, as long as the commit messages are actually descriptive”, “If these are good commit messages, they will provide a good overview of the progress made, most comments would be redundant, but some could be very important”. P52 pointed out that answers depend on the nature of the project: “My answers assume a UX project. If we were building an API, method names and source comments would go up in importance”. The management style of a project is influential, as indicated by P3 in the follow-up interview: “[In] theory, this sort of automatic summarization could probably be applied to almost all of the projects I’ve ever worked on, especially at the beginning of my career, many of my managers were very set in their ways and wary of new approaches”. In addition, the stage at which a project is determines what information is significant when summarizing development activity, as P52 explained in the follow-up interview: “For example, if we’re in the early/planning phases of a project, I expect developer status to mostly be ‘prototyping X technology’ or ‘ramping on Y framework’ or similar. If I heard a developer
Table 5: Summary sources and experience source experience mean method names up to 5 years 3.1053 6 or more years 2.6286 code comments up to 5 years 3.2632 6 or more years 2.6714 Table 6: Summary sources and prog. summary source prog. language code comments C no C
languages mean 3.5789 2.8898
say they were implementing a feature in that context, that would stand out and I’d want to know more. On the other end of the project, towards the end, a status of ‘ramping’ would be the stand-out requiring more investigation”. Table 4 explores this further by showing the correlations between demographic data of the survey participants and their answers regarding potential summary sources (Spearman’s rho). None of the correlations are statistically significant after adjusting the p-values using a Bonferroni correction [5].3 We explored the role of experience in more detail. Table 5 shows the mean scores assigned to the importance of method names and code comments, separately for participants with up to five years development experience and participants with at least six years development experience.4 The differences between these groups are statistically significant (Mann-Whitney-Wilcoxon test, p < 0.01). We hypothesize that these differences can be explained by the diversity of activities that are performed by more experienced developers. While junior developers might only work on well-defined tasks involving few artifacts, the diversity of the work carried out by senior developers makes it more difficult to summarize their work by simply considering method names, code comments, or issue titles. Future work will have to be conducted to explore this hypothesis. We also analyzed the differences in answers as they relate to the programming languages that participants use on GitHub for each of the nine most used programming languages among our participants (JavaScript, CSS, Shell, Java, Python, Ruby, PHP, C, C++). For each participant, we obtained the three languages that they used the most on GitHub. The only significant difference is related to the role of code comments, see Table 6. Participants using C rated the importance of code comments significantly higher than participants who did not use C. We hypothesize that this might be related to the projects that developers undertake in different languages. C might generally be used for more complex tasks which requires more meaningful code comments. Future work will have to be conducted to understand the reasons for this difference. We conclude that several factors influence how software development activity can be summarized, ranging from programming languages and development experience to the current stage of a project.
4.2
Measuring Development Activity
In this section, we explore the themes that emerged from the analysis regarding the measuring of development activ3 Correlations between summary sources and the GitHub metrics of the participants are available in our online appendix at http://tinyurl.com/DevActivityAppendix. 4 We chose six years as threshold for “experienced” since it best divides our participants into two groups of equal size.
Table 4: Correlations between demographic data and potential summary sources method names commit messages issues closed issues opened issues commented code comments projects -0.06313 -0.06657 0.08138 0.05441 0.11752 -0.11410 part of job? -0.13512 -0.05443 -0.00371 0.01061 -0.01184 -0.09682 experience -0.25037 -0.08464 0.13085 0.16214 0.14335 -0.25470 team? -0.24130 -0.07087 0.08275 -0.01094 0.00391 -0.10187 ity, namely a set of measures and the fact that many participants believed that development activity is impossible to measure. We also investigate the factors that influence how development activity can be measured.
4.2.1
Measures
Several themes emerged from the analysis for our second research question, “How would software developers design a metric to measure the input/output of a software developer?” The most prevalent theme is a number of measures(112) , that we divided into objective(85) measures and subjective(65) measures in the analysis. While the distinction is sometimes blurry, as a general rule we classified a measure as objective if we believed that tool support could automatically measure it (e.g., lines of code), and we classified a measure as subjective if we believed that different individuals would rate the same development activity differently with regard to that measure (e.g., impact on user experience). Table 11 shows the themes that emerged from the analysis for objective and subjective measures of development activity, along with the number of survey participants that mentioned each measure in the survey. Among the objective measures, simple measures that count items such as tasks, commits, or story points are prevalent, while the subjective measures are dominated by themes on code quality. In previous work, Meyer et al. [39] asked software developers to rate different measures for development activity (in their work conceptualized as productivity). A crucial difference between their work and ours is that we did not give participants a set of answer options, and therefore, the answers to our survey questions are not biased by the presence of several potential metrics. Instead, our question was openended, which led to the emergence of subjective measures as well as to many participants voicing their opinion that development activity is impossible to measure, as we will show in the next section.
4.2.2
Impossible to Measure
Considering all the previous work on productivity metrics, an important theme that emerged from our work is that development activity is impossible to measure(43) . For example, P61 explained: “A tool capable of automatically [measuring] the productivity of a developer should know the developer, what he’s working on, be aware (semantically) of the codebase and the age of every part of it, and every interaction between developers. I believe that’s pretty impossible for a fixed program”. P19 elaborated further: “For me, development is a craft. Sometimes, when I am in the zone, I can knock out 2 or three projects. Sometimes, when something is hard, it will take me much longer to resolve. So productivity cannot just be measured by a metric. It needs something more organic”. Without being prompted about this metric specifically, participants mentioned that development activity cannot be measured in lines of code(24) , as shown in this example from P10: “It’s difficult to measure output. Simple quantitative
measures like lines of code don’t convey the difficulty of a code task. Changing the architecture or doing a conceptual refactoring may have significant impact but very little evidence on the code base. Other important contributions include interfacing with users (e.g. customer support), even if those customers are just other people at our company who are using the software our team produces”. The focus on customers(7) and the value created for them was confirmed by P32: “Well in my main role as analyst/developer one important aspect [are] the customer and co-team devs relations, it’s not measurable, but sometimes it’s more important than metrics, we do systems for people in first place”. Similarly, the difficulty(6) of a task or conceptual work(1) cannot be measured in lines of code. Another theme that emerged from the analysis is that there is a wide range of development activities(13) which makes it impossible to measure what developers do with a simple measure. For example, the context(8) of the work is essential, as indicated by P41: “I don’t believe there are any simple metrics for this kind of thing. Anything objective, like lines of code written, hours logged, tags completed, bugs squashed, none of them can be judged outside of the context of the work being done and deciphering the appropriate context is something that automated systems are, not surprisingly, not very good at”. In addition, there is a wide range of different roles(3) and workflows(1) , as P61 explained: “You should probably start off by dividing the roles, and taking note of every developer’s role(s). Then you should start by tracking amount of commits per day, amount of lines per commit (related to the project, and with that hopefully capturing the role one is acting in that specific commit, assuming the codebase is well structured), amount of interaction on workflow control”. Finally, the development stage that a project is at(2) matters, as described by P133: “Measuring these metrics would change based on the stage of the project in its development cycle”. Another problem is that measures can be gamed(11) , as P22 explained in the follow-up interview: “A lot of indicators you want to measure would give a bonus to the employees when they meet the measures and then they are doing the wrong thing because they are trying to optimize their own bonus. [...] I think those kinds of bonus systems are problematic”. Similarly, P52 described: “Automatic is pretty challenging here, as developers are the most capable people on earth to game any system you create”. P120 added: “I wouldn’t use automatic measurements. They are too easy to game and don’t reflect the range of useful activities of a good developer”, and P61 commented: “It’s a method full of pitfalls though: developers are smart people, so you have to assume that, if they want, they could exploit the system pretty easily”. This applies in particular to simple measures such as number of issues(2) and number of commits(2) , as P44 described: “A poor quality developer may be able to close more tickets than anyone else but a high quality developer often closes fewer tickets but of those few, almost
Table 7: Rating of activity measures mean lines of code 2.1319 bugs fixed 3.5931 complexity 3.4552 few bugs introduced 3.6552 Table 9: Activity measures and measure experience lines of code up to 5 years 6 or more years bugs fixed up to 5 years 6 or more years complexity up to 5 years 6 or more years
experience mean 2.3243 1.9286 3.8000 3.3714 3.6933 3.2000
none get reopened or result in regressions. For these reasons, metrics should seek to track quality as much as they track quantity”. Other problems with automatic measures include different artifact sizes(2) and the difference between activity and output(1) . Interestingly, participants who talked about the difficulty of measuring development activity generally felt positive about the idea of summarizing development activity. For example, P106 stated: “It’s dangerous to measure some number & have rankings. Because that can be easily gamed. I think having summaries of what everyone did is helpful. But ranking it & assessing it is very difficult/could encourage bad habits. I think it’s better to provide the information & leave it up to the reader to interpret the level of output”. Numbers might be used to complement text, but not the other way around, as explained by P3 in the follow-up interview: “I think that’s probably the better approach: text first, and maybe add numbers. [...] I spend about 45 minutes every Friday reviewing git diffs, just to have a clearer picture in my mind of what happened over the week. [...] The automatic summary would make it harder to miss something, and easier to digest”.
4.2.3
Factors Influencing Measurement
To investigate the factors that influence how software development activity can be measured, we examined the answers to question 9 in the survey (cf. Table 1). Table 7 shows how survey participants rated different potential measures. The highest ratings on a 5-point Likert scale (1 = not well suited at all, 5 = very well suited) were given to low number of bugs introduced, number of bugs fixed, and complexity of code added or modified. Unsurprisingly, the rating for lines of code was much lower than that for the other measures. We investigated the correlations between demographic data and the answers to this question. Table 8 shows the results. None of the correlations are statistically significant after adjusting the p-values using a Bonferroni correction.5 As Table 9 shows, we investigated the role of experience further. The mean scores assigned to the suitability of three out of four of these measures differ significantly (Mann-WhitneyWilcoxon test, p < 0.01) between participants with up to five years development experience and participants with at least six years development experience. 5
Correlations between activity measures and the GitHub metrics of the participants are available in our online appendix at http://tinyurl.com/DevActivityAppendix.
Table 10: Measures and prog. languages measure prog. language mean few bugs introduced JavaScript 3.9194 no JavaScript 3.4578 few bugs introduced CSS 3.9778 no CSS 3.5100 lines of code C 2.7222 no C 2.0476 complexity C 3.8947 no C 3.3889 Table 11: Objective and subjective measures objective subjective artifact count 83 code quality 34 tasks/issues 49 documentation 8 closed 27 structure 5 opened 9 resilience 4 complexity 8 legibility 4 reopened rate 5 clarity 4 commented 4 efficiency 4 priority 4 style 3 found 3 design 3 severity 2 adaptability 2 tests 19 scalability 2 coverage 7 maintainability 1 commits 19 few bugs 10 features 17 few crashes 1 story points 11 few changes in review 5 lines of code 8 initiative 5 methods 5 discussions 2 change LOC 4 ideas 1 scrum metrics 4 volunteering 1 pull requests 3 psychological factors 4 stories 3 customer relations 4 comments 2 in company 1 releases 2 outside company 1 reviews 2 customer experience 3 plan fulfilment 22 mentoring 2 estimate/reality 11 usefulness 2 goals 8 number of problems 2 expectation/reality 4 number of solutions 1 deadlines 4 personal growth 1 time spent 20 impact on UX 1 work hours 5 demonstrable results 1 When we investigated the relationship between participants’ programming languages and their ratings of the different measures, we found four statistically significant differences, as Table 10 shows: Participants using JavaScript and CSS assigned more importance to the measure of few bugs introduced than those who did not use JavaScript or CSS, respectively. Lines of code and complexity were seen as more suitable measures for development activity by participants who used C compared to those who did not. We hypothesize that it is particularly difficult to recover from bugs in web development (JavaScript and CSS), and that more complex programs are often written in C. Future work will have to be conducted to explore these hypotheses.
5.
DISCUSSION
We briefly discuss two of the themes that emerged from our analysis: the interest of developers to learn about unex-
Table 8: Correlations between demographic data and potential activity measures lines of code bugs fixed complexity few bugs introduced projects -0.02350 -0.09885 -0.09097 0.01782 part of job? -0.16585 -0.09295 0.01085 0.02768 experience -0.18585 -0.17702 -0.17434 -0.00852 team? -0.07137 -0.13995 0.00602 -0.02931 pected events and the opinion that development activity is impossible to measure.
5.1
Unexpected Events
When we validated the theme of unexpected events in follow-up interviews with participants, we asked them specifically about how such unexpected events could be detected. Participants referred to the commit history in particular. For example, P115 elaborated: “Commits that take particularly long might be interesting. If a developer hasn’t committed anything in a while, his first commit after a long silence could be particularly interesting, for example, because it took him a long time to fix a bug. Also, important commits might have unusual commit messages, for example including smileys, lots of exclamation marks or something like that. Basically something indicating that the developer was emotional about that particular commit”. P3 added: “Changes to files that haven’t been changed in a long time or changes to a large number of files, a large number of deletions, etc.”. While there is work on automatically detecting buggy commits (e.g., [21, 33]), little work has been conducted on detecting the unusual or unexpected in a commit history. Visualization of the software process [27], the commit history [57], or specific commits [11] can help developers spot unexpected events, but they have not been designed specifically for this purpose. Based on the findings of this work, we are investigating ways for automatically detecting unusual or unexpected events in commit histories and software repositories in general. To do so, we need to establish what is “normal” in a given context, and then identify derivations from the expected. As our participants pointed out, the wide range of development activities, project stages, technologies, team compositions, and individual characteristics make it impossible to assume the same normal for all developers or projects. Approaches for the detection of unexpected events have to be aligned with the specific situations in which they will be used. We have recently published a first prototype for the detection of unusual events in commit histories [36].
5.2
Impossible to Measure?
As many of our participants indicated, development activity is impossible to measure, and it might even be dangerous to measure it since measures could lead developers to game a system rather than work towards the “goodness of the codebase”, as P10 described it. One of the challenges is the prevalence of invisible work [53] and articulation work [40] in software development that cannot be measured in terms of lines of code, number of commits, or number of issues. However, our findings suggest that summarizing software development activity is a promising approach to address some of these issues. Instead of condensing development activity into numbers which can easily be gamed, the idea is to condense development activity into textual summaries that provide a richer source of information than numbers. Our work provides empirical data on the content that such sum-
maries should contain. Expanding on the idea of qualitative dashboards [1], text can be used to complement numbers and vice versa.
6.
LIMITATIONS
We chose methods from Grounded Theory to answer our research questions due to the exploratory nature of these questions. While we achieved saturation when analyzing the survey responses and validated the core themes in follow-up interviews, we cannot claim that we recorded all possible perspectives on these questions among GitHub users. To distribute the survey, we randomly sampled GitHub users that had been active within the last year. However, all individuals who contributed to this study were self-selected volunteers within this sample. The general population on GitHub might have different characteristics and opinions. Thus, we cannot claim that our results generalize to all GitHub users or to the entire population of developers. As mentioned before, while we report the amount of evidence for each theme yielded by the data analysis, we cannot infer the strength or pervasiveness of a theme from these numbers since we did not explicitly ask all participants about each theme specifically.
7.
CONCLUSIONS AND FUTURE WORK
In this paper, we reported on an empirical study designed to investigate how software development activity can be condensed into textual summaries or numbers, in the opinions of software developers. We recruited GitHub users to participate in a survey and follow-up interviews, and we analyzed the data using methods from Grounded Theory. We found that unexpected events are as important as expected events in summaries of development activity, and that many developers do not believe in the existence of any good measure for development activity. In addition, we identified factors that influence summarization and measurement of development activity, including development experience and programming languages. In future work, we plan to design and build the tool support that the participants in our study envisioned: A development activity summarizer that reflects expected and unexpected events, supported by numbers that are intended to augment the summaries instead of pitting developers against each other.
Acknowledgements We thank the survey and interview participants for their participation, and the participants of QualiDASE 2015 for the fruitful discussions on how to best present qualitative research. This work is partially supported by the National Institute of Science and Technology for Software Engineering (INES), CNPq grants 573964/2008-4 and 552645/2011-7, CNPq Jovens Talentos grant 407455/2013-2, and CAPES/PROAP.
8.
REFERENCES
[1] O. Baysal, R. Holmes, and M. Godfrey. Developer dashboards: The need for qualitative analytics. IEEE Software, 30(4):46–52, 2013. [2] J. T. Biehl, M. Czerwinski, G. Smith, and G. G. Robertson. Fastdash: A visual dashboard for fostering awareness in software teams. In Proc. of the SIGCHI Conference on Human Factors in Computing Systems, pages 1313–1322, 2007. [3] J. D. Blackburn, G. D. Scudder, and L. N. Van Wassenhove. Improving speed and productivity of software development: A global survey of software developers. IEEE Transactions on Software Engineering, 22(12):875–885, 1996. [4] B. W. Boehm. Improving software productivity. Computer, 20(9):43–57, 1987. [5] C. E. Bonferroni. Teoria statistica delle classi e calcolo delle probabilita. Libreria internazionale Seeber, 1936. [6] R. P. Buse and T. Zimmermann. Analytics for software development. In Proc. of the FSE/SDP Workshop on Future of Software Engineering Research, pages 77–80, 2010. [7] R. P. L. Buse and T. Zimmermann. Information needs for software development analytics. In Proc. of the 34th International Conference on Software Engineering, pages 987–996, 2012. [8] M. Cataldo, J. D. Herbsleb, and K. M. Carley. Socio-technical congruence: A framework for assessing the impact of technical and work dependencies on software development productivity. In Proc. of the 2nd International Symposium on Empirical Software Engineering and Measurement, pages 2–11, 2008. [9] K. Charmaz. Constructing grounded theory. Sage Publications Inc., 2014. [10] K. Czarnecki, Z. Malik, and R. Lotufo. Modelling the hurried bug report reading process to summarize bug reports. In Proc. of the International Conference on Software Maintenance, pages 430–439, 2012. [11] M. D’Ambros, M. Lanza, and R. Robbes. Commit 2.0. In Proc. of the 1st Workshop on Web 2.0 for Software Engineering, pages 14–19, 2010. [12] C. P. Dancey and J. Reidy. Statistics Without Maths for Psychology: Using SPSS for Windows. Prentice-Hall, Inc., 2004. [13] J. R. F. de Lima. Uma abordagem de apoio a ` gerˆencia de projetos de software para an´ alise da contribui¸c˜ ao de desenvolvedores, 2014. Universidade Federal do Rio Grande do Norte. [14] C. R. B. de Souza, D. Redmiles, and P. Dourish. Breaking the code, moving between private and public work in collaborative software development. In Proc. of the International SIGGROUP Conference on Supporting Group Work, pages 105–114, 2003. [15] C. R. B. de Souza and D. F. Redmiles. The awareness network, to whom should I display my actions? And, whose actions should I monitor? IEEE Transactions on Software Engineering, 37(3):325–340, 2011. [16] T. DeMarco and T. Lister. Programmer performance and the effects of the workplace. In Proc. of the 8th International Conference on Software Engineering, pages 268–272, 1985. [17] P. Devanbu, S. Karstu, W. Melo, and W. Thomas.
[18]
[19]
[20]
[21]
[22] [23]
[24]
[25]
[26]
[27]
[28]
[29]
[30] [31]
[32]
Analytical and empirical evaluation of software reuse metrics. In Proc. of the 18th International Conference on Software Engineering, pages 189–199, 1996. P. Dourish and V. Bellotti. Awareness and coordination in shared workspaces. In Proc. of the Conference on Computer-supported Cooperative Work, pages 107–114, 1992. S. G. Eick, J. L. Steffen, and E. E. Sumner, Jr. Seesoft-a tool for visualizing line oriented software statistics. IEEE Transactions on Software Engineering, 18(11):957–968, 1992. J. B. Ellis, S. Wahid, C. Danis, and W. A. Kellogg. Task and social visualization in software development: Evaluation of a prototype. In Proc. of the SIGCHI Conference on Human Factors in Computing Systems, pages 577–586, 2007. J. Eyolfson, L. Tan, and P. Lam. Do time of day and developer experience affect commit bugginess? In Proc. of the 8th Working Conference on Mining Software Repositories, pages 153–162, 2011. A. Fink. How to Ask Survey Questions. Sage Publications Inc., 1995. T. Fritz and G. C. Murphy. Determining relevancy: How software developers determine relevant information in feeds. In Proc. of the SIGCHI Conference on Human Factors in Computing Systems, pages 1827–1830, 2011. J. Froehlich and P. Dourish. Unifying artifacts and activities in a visual tool for distributed software development teams. In Proc. of the 26th International Conference on Software Engineering, pages 387–396, 2004. C. Gutwin, R. Penner, and K. Schneider. Group awareness in distributed software development. In Proc. of the Conference on Computer Supported Cooperative Work, pages 72–81, 2004. S. Haiduc, J. Aponte, L. Moreno, and A. Marcus. On the use of automated text summarization techniques for summarizing source code. In Proc. of the 17th Working Conference on Reverse Engineering, pages 35–44, 2010. A. Hindle, M. W. Godfrey, and R. C. Holt. Software process recovery using recovered unified process views. In Proc. of the International Conference on Software Maintenance, pages 1–10, 2010. H. Hulkko and P. Abrahamsson. A multiple case study on the impact of pair programming on product quality. In Proc. of the 27th International Conference on Software Engineering, pages 495–504, 2005. M. R. Jakobsen, R. Fernandez, M. Czerwinski, K. Inkpen, O. Kulyk, and G. G. Robertson. WIPDash: Work item and people dashboard for software development teams. In Proc. of the 12th International Conference on Human-Computer Interaction: Part II, pages 791–804, 2009. C. Jones. Software metrics: Good, bad and missing. Computer, 27(9):98–100, 1994. M. Kersten and G. C. Murphy. Using task context to improve programmer productivity. In Proc. of the 14th International Symposium on Foundations of Software Engineering, pages 1–11, 2006. R. B. Kieburtz, L. McKinney, J. M. Bell, J. Hook,
[33]
[34]
[35]
[36]
[37]
[38]
[39]
[40]
[41]
[42]
[43]
[44]
[45]
[46]
A. Kotov, J. Lewis, D. P. Oliva, T. Sheard, I. Smith, and L. Walton. A software engineering experiment in software component generation. In Proc. of the 18th International Conference on Software Engineering, pages 542–552, 1996. S. Kim, E. J. Whitehead, Jr., and Y. Zhang. Classifying software changes: Clean or buggy? IEEE Transactions on Software Engineering, 34(2):181–196, 2008. J. A. Lane and D. Zubrow. Intergrating measurement with improvement: An action-oriented approach: Experience report. In Proc. of the 19th International Conference on Software Engineering, pages 380–389, 1997. T. D. LaToza, G. Venolia, and R. DeLine. Maintaining mental models: A study of developer work habits. In Proc. of the 28th International Conference on Software Engineering, pages 492–501, 2006. L. Leite, C. Treude, and F. Figueira Filho. UEDashboard: Awareness of unusual events in commit histories. In Proc. of the 10th joint meeting on Foundations of Software Engineering, 2015. To appear. S. Mani, R. Catherine, V. S. Sinha, and A. Dubey. AUSUM: Approach for unsupervised bug report summarization. In Proc. of the 20th International Symposium on the Foundations of Software Engineering, pages 11:1–11:11, 2012. P. W. McBurney and C. McMillan. Automatic documentation generation via source code summarization of method context. In Proc. of the 22nd International Conference on Program Comprehension, pages 279–290, 2014. A. N. Meyer, T. Fritz, G. C. Murphy, and T. Zimmermann. Software developers’ perceptions of productivity. In Proc. of the 22nd International Symposium on Foundations of Software Engineering, pages 19–29, 2014. P. Mi and W. Scacchi. Modeling articulation work in software engineering processes. In Proc. of the 1st International Conference on the Software Process, pages 188–201, 1991. C. Michel, E. Lavou´e, and L. Pietrac. A dashboard to regulate project-based learning. In Proc. of the 7th European Conference on Technology Enhanced Learning, pages 250–263, 2012. A. Mockus, R. T. Fielding, and J. D. Herbsleb. Two case studies of open source software development: Apache and Mozilla. ACM Transactions on Software Engineering and Methodology, 11(3):309–346, 2002. L. Moreno, J. Aponte, G. Sridhara, A. Marcus, L. Pollock, and K. Vijay-Shanker. Automatic generation of natural language summaries for Java classes. In Proc. of the 21st International Conference on Program Comprehension, pages 23–32, 2013. V. Nguyen, L. Huang, and B. Boehm. An analysis of trends in productivity and cost drivers over years. In Proc. of the 7th International Conference on Predictive Models in Software Engineering, pages 3:1–3:10, 2011. D. E. Perry, N. Staudenmayer, and L. G. Votta. People, organizations, and process improvement. IEEE Software, 11(4):36–45, 1994. S. Rastkar, G. C. Murphy, and A. W. J. Bradley.
[47]
[48]
[49]
[50]
[51]
[52]
[53]
[54]
[55]
[56]
[57]
[58]
[59]
Generating natural language summaries for crosscutting source code concerns. In Proc. of the 27th International Conference on Software Maintenance, pages 103–112, 2011. S. Rastkar, G. C. Murphy, and G. Murray. Summarizing software artifacts: A case study of bug reports. In Proc. of the 32nd International Conference on Software Engineering - Volume 1, pages 505–514, 2010. S. Rastkar, G. C. Murphy, and G. Murray. Automatic summarization of bug reports. IEEE Transactions on Software Engineering, 40(4):366–380, 2014. A. Sarma, Z. Noroozi, and A. van der Hoek. Palant´ır: Raising awareness among configuration management workspaces. In Proc. of the 25th International Conference on Software Engineering, pages 444–454, 2003. A. Sarma and A. van der Hoek. Towards awareness in the large. In Proc. of the International Conference on Global Software Engineering, pages 127–131, 2006. G. Sridhara, E. Hill, D. Muppaneni, L. Pollock, and K. Vijay-Shanker. Towards automatically generating summary comments for Java methods. In Proc. of the International Conference on Automated Software Engineering, pages 43–52, 2010. G. Sridhara, L. Pollock, and K. Vijay-Shanker. Automatically detecting and describing high level actions within methods. In Proc. of the 33rd International Conference on Software Engineering, pages 101–110, 2011. S. L. Star and A. Strauss. Layers of silence, arenas of voice: The ecology of visible and invisible work. Computer Supported Cooperative Work, 8(1-2):9–30, 1999. I. Steinmacher, A. P. Chaves, and M. A. Gerosa. Awareness support in distributed software development: A systematic review and mapping of the literature. Computer Supported Cooperative Work, 22(2-3):113–158, 2013. H. C. Stuart, L. Dabbish, S. Kiesler, P. Kinnaird, and R. Kang. Social transparency in networked information exchange: A theoretical framework. In Proc. of the Conference on Computer Supported Cooperative Work, pages 451–460, 2012. C. Treude and M.-A. Storey. Awareness 2.0: Staying aware of projects, developers and tasks using dashboards and feeds. In Proc. of the 32nd International Conference on Software Engineering Volume 1, pages 365–374, 2010. F. Van Rysselberghe and S. Demeyer. Studying software evolution information by visualizing the change history. In Proc. of the 20th International Conference on Software Maintenance, pages 328–337, 2004. A. T. T. Ying and M. P. Robillard. Code fragment summarization. In Proc. of the 9th joint meeting on Foundations of Software Engineering, pages 655–658, 2013. M. Zhou and A. Mockus. Developer fluency: Achieving true mastery in software projects. In Proc. of the 18th International Symposium on Foundations of Software Engineering, pages 137–146, 2010.