Administration (FAA) Aviation System Performance Metrics (ASPM)-based ...... Operations,â Proceedings of the AIAA Aviation Tech-nology, Integration and ... Digital Avionics Systems Conference (DASC), Orlando, Florida, 23-29 October, 2009.
AIAA 2011-6535
AIAA Modeling and Simulation Technologies Conference 08 - 11 August 2011, Portland, Oregon
Super Density Operations Airspace Modeling for the Southern California Metroplex Sebastian D. Timar, Ph.D.1, Gaurav Nagle2, Aditya Saraf, Ph.D.3, Peter Yu4, Peter Hunt5, Andrew Trapani6 Sensis Corporation, Campbell, CA, 95008, USA Nick Johnson7 Johnson Aviation, Oak Park, CA, 91377, USA
This paper discusses the process for and results of developing a candidate airspace model that describes airport runway configurations, arrival and departure procedures and routes for airplanes arriving to and departing from the Southern California TRACON (SCT). The airspace model includes arrival and departure traffic routes for six major Southern California metroplex airports including Los Angeles International (LAX), Burbank (BUR), Ontario (ONT), Long Beach (LGB), Santa Ana (SNA), and San Diego (SAN). The model comprises a series of airspace model components including: a) the Federal Aviation Administration (FAA) Aviation System Performance Metrics (ASPM)-based characterization of the operating conditions of all six airports throughout 2009 and 2010; b) trajectory data-based modeling of arrival and departure traffic flow routes and altitude ranges and comparison against published Departure Procedures (DPs) and Standard Terminal Arrival Routes (STARs); c) route and airspace traffic volume analysis to identify the most commonly used arrival and departure procedures and to identify the fraction of total metroplex airspace traffic associated with each procedure; d) modeling and analysis of continuous descent and standard arrival procedures and departure procedures spanning the entire terminal airspace between the en-route airspace and the runway threshold of each airport; and e) trajectory generator-based evaluation of modeled procedures to ensure flyability of modeled procedures.
I. Introduction
T
he National Aeronautics and Space Administration (NASA) Aeronautics Research Mission Directorate (ARMD)’s Super Density Operations Airspace Design (SDOAD) project conducted research to support NASA’s Super Density Operations (SDO) Research Focus Area (RFA). Under the auspices of the NASA’s Airspace System Program’s Concept and Technology Development (CTD) project1, NASA’s SDO RFA is focused on the development of concepts to enable highly efficient operations at the busiest U.S. airports and terminal airspace. The SDO RFA is one of a number of multiple research thrusts that NASA is contributing toward the development of the U.S. Next Generation Air Transportation System (NextGen). As part of its NextGen research thrusts, NASA is examining a number of new operational concepts aimed at addressing current and future capacity challenges at major U.S. airports and their surrounding airspace. Models of existing real-world or researcher-designed airspace configurations, including operational procedures and routes, are required to effectively and accurately assess these NextGen concepts in increasing capacity at high volume, complex airports and surrounding airspaces. NASA plans to use the airspace definitions to conduct simulation-based evaluation of new operational concepts, including automated arrival concepts. 1
Senior Research Engineer, Seagull Technology Center, 1700 Dell Avenue, AIAA Member. Research Engineer, Seagull Technology Center, 1700 Dell Avenue, AIAA Member. 3 Research Engineer, Seagull Technology Center, 1700 Dell Avenue, AIAA Member. 4 Research Engineer, Seagull Technology Center, 1700 Dell Avenue, AIAA Member. 5 Senior Software Engineer, Seagull Technology Center, 1700 Dell Avenue, AIAA Member. 6 Research Engineer, Seagull Technology Center, 1700 Dell Avenue, AIAA Member. 7 Prioprietor, 6524 Deerbrook Road, AIAA Member. 1 American Institute of Aeronautics and Astronautics 2
Copyright © 2011 by Sensis Corporation. Published by the American Institute of Aeronautics and Astronautics, Inc., with permission.
This paper discusses the process for and results of developing a candidate airspace model that describes airport runway configurations, arrival and departure procedures and routes for airplanes arriving to and departing from a major metroplex in the United States with the highest aircraft traffic levels: Tthe Southern California TRACON (SCT). The airspace model includes arrival and departure traffic routes for six major Southern California metroplex airports including Los Angeles International (LAX), Burbank (BUR), Ontario (ONT), Long Beach (LGB), Santa Ana (SNA), and San Diego (SAN). The model comprises a series of airspace model components including: a) the Federal Aviation Administration (FAA) Aviation System Performance Metrics (ASPM)-based characterization of the operating conditions of all six airports throughout 2009 and 2010; b) trajectory data-based characterization of arrival and departure traffic flow routes and altitude ranges and comparison against published Departure Procedures (DPs) and Standard Terminal Arrival Routes (STARs); c) route and airspace traffic volume analysis to identify the most commonly used arrival and departure procedures and to identify the fraction of total metroplex airspace traffic associated with each procedure; d) modeling and analysis of continuous descent and standard arrival procedures and departure procedures spanning the entire terminal airspace between the en-route airspace and the runway threshold of each airport; and e) trajectory generator-based evaluation of modeled procedures to ensure flyability of modeled procedures. Modeling the arrival and departure procedures of each airport comprised visualizing trajectory data to identify arrival and departure traffic flows for each airport and to qualitatively estimate a lateral route for each airport traffic flow. Subsequently, quantitative analysis of the estimated lateral routes and trajectory data were used to estimate the altitude range of each traffic flow at each route waypoint. Qualitative estimation of lateral routes was facilitated by the use of Terminal Area Route Generation, Evaluation and Trajectory Simulation (TARGETS)2,3 airspace design tool to visualize flight trajectory data and to compare each traffic flow to the FAA National Flight Data Center (NFDC)4 airspace data, including airport locations, runways, current STARs, DPs, waypoints, navigational aids and special use airspace. In addition to modeling the lateral routes of all traffic flows, qualitative estimation revealed traffic flow level of conformance to published STARs and DPs, identified which runways were utilized for certain routes, and verified estimated waypoint restrictions. Qualitative analysis revealed unused STARs and DPs and also revealed high density traffic flows not following published routes, which we termed undocumented routes.
II. Background The Super Density Operations (SDO) RFA explores utilizing sequencing, spacing, merging, and de-confliction for the terminal airspace with nearby airports and runway balancing1. The SDO RFA has developed a concept of operations for high density air traffic operations in terminal air-space encompassing the “transition” and “terminal” airspaces5. The concept comprises five main components including Extended Terminal Area Routing, Precision Scheduling Along Routes, Merging and Spacing, Tactical Separation, and Off-Nominal Recovery. The concept addresses capabilities in the near-term, mid-term, and far-term time frames. Extended terminal area routing defines arrival and departure routes from the runway threshold to beyond top-of-descent/-climb, enabling precision scheduling by clearly identifying key runway thresholds, route merge points and metering fixes as scheduling points and minimizing flight intent uncertainty. Precision scheduling along routes plans the sequence and schedule of flights to each point, and assigns, to each flight, Scheduled Times of Arrival (STAs) to those points. Merging and spacing maintains necessary inter-flight time or distance spacing between in-trail and merging aircraft. Tactical separation detects and resolves conflicts should loss of separation be predicted due to unexpected perturbations. Offnominal recovery identifies deviations from and formulates recovery actions to return to nominal operations. The SDO RFA project plan calls for concepts and technologies supporting the aforementioned concept of operations to be assessed and iteratively refined through rapid prototyping and computer-numerical simulation1. Rapid prototyping and simulation includes both real-time Human-In-The-Loop (HITL) simulations and fast-time simulations. Ongoing evaluations such as Terminal Area Precision Scheduling and Spacing System (TAPSS)6,7 and Terminal Tactical Separation Assurance Flight Environment (T-TSAFE)8 have focused on operations at LAX and the Southern California metroplex environment. This study supported those activities by developing detailed models of the current-day arrival and departure routes for each of the six aforementioned airports including LAX, and verifying their flyability with the NASA Multi-Aicraft Control System (MACS)9,10,11 trajectory generator. In turn, the routes models are incorporated directly into NASA’s simulation environments for operational concept and technology evaluation. Curosry literature searches uncovered very little documentation of previous terminal airspace routes modeling work. Previous airspace modeling work conducted by Sensis includes modeling of Dallas-Ft. Worth Airport (DFW) arrival and departure procedures to support development of the Airspace Concept Evaluation System (ACES)Terminal Model Enhancement (TME)12 high fidelity airport surface and terminal airspace simulation capability, and 2 American Institute of Aeronautics and Astronautics
the modeling and design of Newark Liberty International Airport (EWR) arrival and departure procedures to evaluate the impact of Cruise-Efficient Short Take Off and Landing (CESTOL)13,14 aircraft on air traffic operations and airport throughput. The ACES-TME study modeled DFW arrival and departure procedures via analysis of the D10 TRACON standard operating procedures the published STARs and Standard Instrument Departures (SIDs). The lateral routes and altitude restrictions were estimated from the published STARs and SIDs in accordance with the lateral boundaries and altitude ranges of the D10 airspace sectors, as per the documented runway configurations. The CESTOL study modeled EWR arrival and departure procedures via analysis of operational documents and consultation with controllers and other FAA personnel. Operational documents indicated nomial runway configurations, and controller consultation identified the altitude ranges of different traffic streams and the standard vectors issued at discrete locations. The approach developed and employed in this study improves upon the previous ACES-TME and CESTOL efforts by establishing a standard approach applicable to any airspace based on qualitative and quantitative analysis of trajectory and operational data. The process yields high fidelity models of the terminal airspace routes as executed, reducing modeling error introduced in interpreting operational documents of varying specificity and which likely do not explicitly document standard vectors, and obviating the immediate need for facility site visits and consultation with personnel.
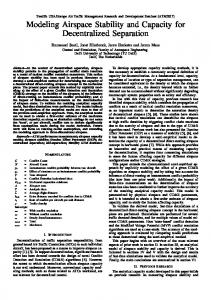
III. Airspace Modeling This section documents the approach to and gives example results of the modeled current day Southern California metroplex airspace. A. Operating Conditions Characterization This study modeled the arrival and departure traffic flows of the six metroplex airports under their nominal runway configurations and meteorological conditions. FAA ASPM data details the airport configurations and meteorological conditions for each airport in quarter-hour increments throughout the day, for each day throughout the year15,16. ASPM data was analyzed to determine the most popular runway configuration for LAX, and for BUR, ONT, LGB, SNA, and SAN when LAX is in its most common runway configuration. In addition, the meteorological conditions were analyzed for each airport. The figure below depicts, for 2009, the percentage of time LAX operated in VMC and IMC conditions, and the most common runway configurations during VMC conditions. Similar results were obtained for 2010.
Figure 1. LAX configurations. LAX 2010 Meteorological Conditions and Runway Configurations. The results indicate LAX is typically operating under VMC, and is typically in a west flow configuration with arrivals to and departures from the 24 L,R and 25 L,R parallel runways. The generic configuration indicates the inboard runways 25R and 25L, typically used for departures, provide extra capacity during periods of peak arrival demand. Likewise, outboard runways 25L and 24R, typically used for arrivals, provide extra capacity during peak departure demand periods. Similar results were obtained for the five other airports. The table below summarizes the runway configurations and meteorological conditions for the six airports indicated by analysis of the 2009 ASPM data. Analysis of 2010 ASPM data yielded similar results.
3 American Institute of Aeronautics and Astronautics
Table 1. 2010 SCT Metroplex Airports Operating Conditions. Runways indicated in bold are principal arrival and departure runways. Airport Arrival Runways Departure Runways % Use Under VMC
LAX BUR LGB ONT SAN SNA
24L, 24R, 25L, 25R 8, 15 30 26L, 26R 27 19R
24L, 24R, 25L, 25R 8, 15 30 26L, 26R 27 19R
86 95 97 83 91 94
The results indicate the most common meteorological condition for all the airports was VMC. Analysis also identified that all airports were in their most common runway configuration when LAX was in its most common configuration. Having identified the most common runway configuration and meteorological condition for each airport, the analysis next identified individual days when the airports were operating under these conditions from 06:00 to 23:00 Pacific Time. This identified candidate days for which to obtain flight tracking data to support airspace modeling. Additional selection critieria included choosing varied days of the week and times of the year to account for different traffic levels and potential directional loading changes17and observing NEXRAD reflectivity images to verify no severe weather patterns in the vicinity were impacting traffic flows18. Based on these criteria and the availability of NASA CMSim flight tracking data, the following 2010 days were selected for airspace modeling: 05 March, 08 April, 29 May, 14 July. Each airport arrival or departure traffic flow was identified and modeled through observation and analysis of trajectory data for four different days during 2010. B. Lateral Paths Modeling The lateral routes of the arrival and departure traffic flows of each Southern California metroplex airport were modeled as waypoint sequences between the runway threshold and the procedure en-route transition start or end waypoint in center airspace. The paths were modeled via analysis of the published STARs and SIDs and analysis of flight tracking data. Tracking data analysis supported lateral routes modeling in two ways: one, it served to approximate a nominal route between the runway threshold and the STAR end point or SID start point and two, it served to tailor the lateral path models, initially based on the published STARs and SIDs, to the nominal as-flown lateral paths observed in the trajectory data. Thus, the modeled lateral paths are a combination of observed operations and documented procedures. The study used the FAA National Flight Data Center (NFDC) database valid from July 29, 2010 to September 23, 2010 as its source for published operations. The database included airspace data such as airport locations, runways, current STARs, SIDs, waypoints, navigational aids and special use airspace, and was used to model nominal routes for the various, observed traffic flows. The published plates describing the STARs and SIDs were used to determine published routes, waypoint restrictions and which procedures applied to the runway configurations under study. The study used NASA CMSim data as its source for flight tracking data. CMSim data is tracking data in the form that is used by the Center-TRACON Automation System (CTAS) Communication Manager (CM) 19. The files include radar tracking data, flight plans, flight plan amendments, references to weather data files and other information. The study used the TARGETS airspace design tool for airspace and trajectory data visualization and route modeling and design. TARGETS relies upon and readily accepts NFDC data. Custom MATLAB scripts converted the CMSim file track data into a TARGETS readable format in order to import the four days of trajectory data. This helped to identify and characterize the bulk traffic flows via the densities of the trajectory data from all four days. In addition, the study used the TRAC20 airspace design tool to support the airspace design and as a source for additional relevant data, such as the SCT TRACON airspace sectors lateral boundaries and altitude ranges. Once the track data was imported into TARGETS, the published STARs and SIDs in the NFDC database were superimposed onto these tracks to estimate which STARs and SIDs, and portions there-of, were being flown by the trajectories in question. Lateral route models were tailored to observed traffic flows by introducting additional waypoints, either from those listed in the NFDC database or by creating new waypoints, to estimate the route at points where the traffic flow deviated from the STAR or SID route and to estimate a nominal route implied by the standard vectors issued by the controller, as observed in the trajectory data. The result was, for each traffic flow, a continuous lateral path model from en route airspace to the runway threshold, which comprised en route transition, common route and runway transition segments, to yield a lateral path following the nominal traffic flow. 4 American Institute of Aeronautics and Astronautics
In the course of modeling the arrival and departure traffic flows to each airport, a number of STARs or SIDs were identified to be unused under the particular runway configurations, traffic demand-levels and meteorological conditions inherent in the selected days of trajectory data. For example, SIDs ELB1 and IRV1 are not used in SNA runway configuration 19; SID ANAHM3 and its en-route transitions VTU, LHS, HEC and SLI were not used in the selected SNA operating condition. Also in the course of modeling, certain high density traffic flows for each of the airports did not appear to transit routes published in the NFDC-published STARs and SIDs. The traffic flows of these so-called undocumented routes were included in the scope of modeling. For example, procedures models GAATE1.LAX, FLYIN1.ONT, W3ARR.SNA, listed in Table 3 with Reference Procedures of “n/a” are modeled traffic flows which did not correlate with published arrival or departure procedures in the NFDC database. Figure 1 below depicts the STARs, SIDs and flight tracking data for LGB. Superposition of these data sources indicates two heavy traffic flows not following a published route. Undocumented routes could be the result of internal center or TRACON procedures consisting of a set of vectors.
Figure 1. LGB Undocumented Routes. Figure depicts LGB STARs, SIDs, and four days of flight tracking data. Red dashed ovals encircle major traffic flows not following published routes. The routes modeled, summarized in Table 3, included all major and minor traffic flows observed in the trajectory data, including those associated with documented routes and those appearing to follow undocumented routes. The purpose was to provide as highly detailed a description of the airspace as possible, to support high fidelity representations of individual and multi-airport traffic flows in simulation-based concept and technology assessments and to support any subsequent airspace design and deconfliction tasks. The resulting airspace model serves as a rich data resources to support both of these activities. C. Atltitudes Modeling The purpose of altitudes modeling was to represent the altitude corridors used by the arrival or departure traffic streams associated with each modeled route. The altitude range at each route waypoint was estimated from quantitative analyisis of the trajectory data in conjunction with the modeled lateral routes. The altitude range at each waypoint was modeled with pseudo altitude restrictions—that is, altitude restrictions derived from the altitudes of trajectories proximate to each waypoint, which reflected the nominal altitude envelopes estimated from the trajectory data, but were not actual restrictions known to be rigidly adhered to. Where possible, modeled restrictions were verified against restrictions published in the existing STARs or SIDs. Altitudes modeling comprised a three-step process: Trajectory-waypoint association, waypoint altitude statistics computation, and altitude restrictions estimation. Step 1, trajectory-waypoint association, identified flight tracks within a specified radial distance of the route-waypoints for each custom-defined route. The tolerance used in this study was 5 nmi. Step 2, waypoint altitude statistics computation, estimated for each waypoint the crossing altitude of each associated trajectory. The resulting waypoint altitude data set was then filtered of outliers. Basic statistics including mode, mean and standard deviation were computed for each waypoint altitude data set. These statistics were in turn compared relative to one another and to standard minimum vertical separation critiera of 1000 feet21 in order to estimate an altitude restriction model capturing the observed behavior. Step 3, altitude restrictions 5 American Institute of Aeronautics and Astronautics
estimation, translated the crossing altitude statistics of each waypoint into four different distribution categories which mapped to the four different types of altitude restrictions: AT, AT OR ABOVE, AT OR BELOW, or AT OR ABOVE and AT OR BELOW. The altitude-restrictions for each waypoint were specified to capture the dispersion and distribution characteristics of the altitudes at which flights cross the waypoint, to capture the extent of airspace corridors currently “occupied” by the traffic flows. The waypoint altitude statistics also helped to characterize the manner in which the waypoint is used. For example, if the distribution of the altitudes is bimodal with two similar magnitude peaks separated by more than a specified separation tolerance, then this might signify that there are two streams of traffic passing through this waypoint and each stream has an altitude restriction to keep it spatially (vertically) separated from the other stream. After completion of these three steps for each modeled waypoint, the resulting waypoints’ altitude restrictions were input to TARGETS via a compatible input file in comma-separatedvalue (.csv) format to yield complete airspace structure to support any future airspace design and analysis tasks such as LAX OPD arrival procedure design and spatial deconfliction from other traffic flows, and to support creation of flight simulator input files for model flyability verification. D. Modeling Results Each modeled procedure comprised multiple en route transitions, a common route, and a runway transition. Route lateral paths were specified as waypoint sequences. For each waypoint, a name, latitude and longitude coordinates and an altitude restriction were specified. Waypoint coordinates were specified in degrees, minutes and seconds. Altitude restrictions were specified in feet as AT restrictions (i.e., 12,000 ft. (feet)), AT OR ABOVE (i.e., +12,000 ft), AT OR BELOW (i.e., -12,000 ft) or a combination of the latter two. As an example, modeled LGB arrival procedure model TANDY is depicted in the following figure and explained henceforth. The model comprises individual enroute transitions ALIYE, FLW, DERBB, and MERMA merging into common route WP001. Common route WP001 merges to runway transition to LGB runway 30. For each route comprising the procedure, the waypoints and associated altitude restrictions are depicted. For instance, consider arrival route ALIYE. Waypoint ALIYE has an AT altitude restriction of 31,000 ft; LOBER has an AT OR BELOW restriction of 33000 ft.; WP003 has an AT OR ABOVE restriction of 9100 ft and an AT OR BELOW restriction of 10400 ft; WP013 has an AT OR ABOVE restriction of 6000 ft and an AT OR BELOW restriction of 9000 ft, and so on at successive waypoints to LGB runway 30.
6 American Institute of Aeronautics and Astronautics
Figure 2. Modeled LGB arrival procedure TANDY. Model includes en route transition, common route and runway transition segments spanning prior to top-of-descent to runway. Route segment waypoints and modeled altitude restrictions (in hundreds of feet) are depicted. The table below lists the individual route segments comprising the modeled LGB arrival procedure TANDY. The table is derived from, and presents a subset of the information captured in, the procedure output file generated by theTARGETS airspace design software. The table details the individual en route transition, common route and runway transition route segments comprising the modeled procedure. For each route segment are listed the individual waypoints, their positions and associated altitude restrictions.
7 American Institute of Aeronautics and Astronautics
Table 2. Modeled LGB arrival procedure TANDY. Procedure model comprises en route transitions ALIYE, DERBB, FLW and MERMA (dashed outline), common route WP01 (dotted outline) and runway transition RW30 (solid outline). Waypoint locations (degrees, minutes, second) and altitude restrictions (feet) are also listed. Fix ALIYE LOBER WP003 WP013 WP001 DERBB FIM SADDE MERMA PAROL WP001 FLW SADDE MERMA PAROL WP001 MERMA PAROL WP001 WP001 WP002 JILAN JILAN BECCA KLGB:RW30:AER
Route ET ALIYE ET ALIYE ET ALIYE ET ALIYE ET ALIYE ET DERBB ET DERBB ET DERBB ET DERBB ET DERBB ET DERBB ET FLW ET FLW ET FLW ET FLW ET FLW ET MERMA ET MERMA ET MERMA CR WP01 CR WP01 CR WP01 RT RW30 RT RW30 RT RW30
Latitude N35° 17' 03.75" N34° 15' 47.87" N33° 32' 06.98" N33° 30' 21.35" N33° 30' 03.49" N35° 15' 21.24" N34° 21' 24.10" N34° 02' 20.38" N33° 53' 44.91" N33° 35' 45.78" N33° 30' 03.49" N35° 05' 35.10" N34° 02' 20.38" N33° 53' 44.91" N33° 35' 45.78" N33° 30' 03.49" N33° 53' 44.91" N33° 35' 45.78" N33° 30' 03.49" N33° 30' 03.49" N33° 36' 30.70" N33° 44' 09.86" N33° 44' 09.86" N33° 45' 23.76" N33° 48' 38.64"
Longitude
Altitude
W120° 56' 17.60" W120° 05' 07.65" W118° 43' 34.09" W118° 29' 18.39" W118° 23' 32.04" W119° 38' 29.21" W118° 52' 52.65" W118° 45' 52.68" W118° 42' 44.49" W118° 36' 17.79" W118° 23' 32.04" W119° 51' 56.08" W118° 45' 52.68" W118° 42' 44.49" W118° 36' 17.79" W118° 23' 32.04" W118° 42' 44.49" W118° 36' 17.79" W118° 23' 32.04" W118° 23' 32.04" W118° 07' 54.55" W118° 03' 09.46" W118° 03' 09.46" W118° 04' 38.63" W118° 08' 34.15"
31000 ‐33000 '+9100 '+6000 '+4600 '+34900 22900 '+15800 14100 '+8500 '+4600 '+29900 '+15800 14100 '+8500 '+4600 14100 '+8500 '+4600 '+4600 3000 1700 1700 '+1600
Upper Altitude ‐10400 ‐9000 ‐7100 ‐38500 ‐17400 ‐11500 ‐7100 ‐37900 ‐17400 ‐11500 ‐7100 ‐11500 ‐7100 ‐7100
AT OR ABOVE 9100 AT OR BELOW 10400
En Route Transitions (ET)
Common Route (CR) Runway Transitions (RT)
In this manner, the models of the arrival and departure routes and procedures for the six metroplex airports were developed and specified. Traffc flows following published STARs and SIDs and those following seemingly informal, established routes were modeled. The table below summarizes the extent of the modeling work, listing by airport the names of modeled routes, their operation type and their associated published routes (if any). The modeled procedures were named after current day STARs or SIDs with the revision level incremented by one to differentiate it from the published route (e.g. the procedure modeling current day STAR LYNXX8 was named LYNXX9). Undocumented procedures capturing observed heavy traffic flows appearing not tofollow a published STAR or SID route were each given a custom name.
8 American Institute of Aeronautics and Astronautics
Table 3. Modeled arrival and departure procedures for each Soutern California metroplex airport. Reference Procedure lists the associated STAR or SID published in July-September 2010 NFDC. Those listed as “not applicable (n/a)” model traffic flows transiting routes not documented in published STARs or SIDs.
The details of each modeled route were also documented to capture the modeling approaches and, where applicable, deviations from the published procedure, for each modeled procedure. The following is an example for modeled LGB arrival procedureTANDY4: “Based on existing STAR TANDY3:LGB. Common route WP001 models common route TANDY as flown, starts at WP001 to incorporate ALIYE. En route transition ALIYE captures undocumented northwesterly traffic flow. En route transitions FIM and FLW model their TANDY3 counterparts. En route transition MERMA captures entry point MERMA, substitutes for TANDY3 which captured unused entry point SADDE.” E. Traffic level estimation Another component to the Southern Califonia metroplex airspace modeling was the estimation of relative airport and SCT TRACON traffic transiting each procedure. This helped determine the relative importance of modeling particular procedures, and to support selecting particular procedures for inclusion in simulation-based assessments to capture the majority of air traffic. Two approaches were taken to estimating procedures traffic volume: a) analysis of CMSim flight plan data and, b) estimation based on trajectory association with routes and procedures. The former is prone to inaccuracies due to undocumented changes in flight intent; the latter is prone to inaccuracies to either doubly-associated or unassociated (depending on routes geometries and flight tracking dispersion) flight tracks. Nevertheless, the two methods were in relative agreement in indicating heavily versus lightly used procedures.
9 American Institute of Aeronautics and Astronautics
Table 4. Flight plan-based traffic loading example: LAX. The analysis approach was applied to and results obtained results for arrival and departure traffic for the each of the six Southern California metroplex airports considered in this study. Flight Count Percentage STAR Airport 3052010 7142010 5292010 4082010 Total Each Cumulative LAX SADDE6 218 238 232 215 903 28.1 28.1 RIIVR2 229 163 165 221 778 24.2 52.4 SEAVU2 142 246 170 150 708 22.1 74.4 OLDEE1 57 56 64 64 241 7.5 81.9 SANN4 49 41 35 47 172 5.4 87.3 KIMMO2 34 35 21 39 129 4.0 91.3 RDEYE2 27 26 5 21 79 2.5 93.8 SBAN10 15 12 14 17 58 1.8 95.6 Table 4 indicates the majority of the LAX arrival flights captured in the four days of CMSim data analyzed in this study listed SADDE6, RIIVR2, SEAVU2 or OLDEE2 in their flight plans, that those three procedures carried approximately three quarters of the arrival traffic among the four days analyzed. The results also indicate traffic levels to be fairly consistent between the different days. Arrival procedures SANN4, RDEYE2 and SBAN10, listed in the flight plans, were not listed in the NFDC data supporting this study. Table 5. Trajectory-based traffic loading example: LAX. The analysis approach was applied to and results obtained results for arrival and departure traffic for the each of the six Southern California metroplex airports considered in this study. % of Airport % of Airport Modeled Procedure Type Reference Procedure* Traffic TRACON Traffic OLDEE2.LAX LAX OLDEE.OLDEE1 23.5 4.3 LAX Arrival RIIVR3.LAX LAX RIIVR.RIIVR2 21.6 3.9 Arrival SADDE7.LAX LAX SADDE.SADDE6 21.4 3.9 Arrival SEAVU3.LAX LAX SEAVU.SEAVU2 21.4 3.9 Arrival GAATE1.LAX n/a 19.3 3.5 Arrival SHIVE2.LAX LAX SHIVE.SHIVE1 6.1 1.1 Arrival BAYST1.LAX n/a 3.6 0.7 Arrival CYNDE1.LAX n/a 3.6 0.6 Arrival VISTA3.LAX LAX VISTA.VISTA2 3.6 0.6 Arrival VISTA4.LAX LAXVISTA.VISTA2 3.6 0.6 Arrival KIMMO3.LAX LAX DARTS.KIMMO2 1.8 0.3 Arrival GOKEY1.LAX n/a 0.6 0.1 Arrival The table indicates modeled procedures OLDEE2, RIIVR3, SADDE7, SEAVU3 and GAATE1 are associated with the majority of the four days worth of LAX arrival trajectories analyzed in the modeling process. Tailoring the modeled the arrival routes to the observed traffic flows yields a relative traffic weighting among the modeled procedures which differs from the flight plan-based procedures traffic loading estimation. In addition, for the case of the LAX airspace model, the proximities of the trajectories and the compact geometry of the modeled routes results in some double-counting of trajectories among different procedures, hence the non-sensical result of percent of airport traffic summing to greater than 100%. Nevertheless, the analysis captures the overall trends in relative traffic volume among the modeled STARS somewhat consistent with the flight-plan based approach. The table above also indicates the fraction of SCT TRACON traffic each procedure was estimated to account for. SCT TRACON traffic volume was estimated from the CMSim data to have been 5120 flights on 20100305, 5309 flights on 20100408, 4270 flights on 20100529 and 4959 flights on 20100714. These are less than the average 10 American Institute of Aeronautics and Astronautics
of 6145 operations/day inferred from the Federal Aviation Administration, Administrator’s Fact Book, November 2008, which likely accounts for Visual Flight Rules (VFR) traffic not having filed flight plans.
IV. Flyability Assessment The baseline set of procedures modeled through this process were then used to generate input files for the NASA Multi-Aircraft Control System (MACS) trajectory generator to verify compatibility with NASA real-time simulation facilities. The altitude restrictions were first verified and updated as needed to ensure compliance with nominal aircraft climb and descent rates, then simulator input files were automatically generated from the TARGETSgenerated procedures specification files. Simulation scenarios were then run for multiple aircraft weight classes, and finally the simulated trajectories were compared to the lateral routes and altitude restriction to ensure compliance. MACS is a JAVA-based simulation and analysis software for air traffic management research and training9,10,11. MACS provides emulations of current-day and futuristic terminal, en route and oceanic air traffic control displays and pilot interfaces, an environment for rapid prototyping of futuristic traffic control and cockpit tools, and the supporting simulation capability to evaluate alternative air traffic operations, tools and scenarios. The core functionality supporting its vast capabilities is a flight simulator comprising aircraft dynamics and navigation models. The flight simulator generates 4D trajectories respresenting flight response to specified route and initial conditions. A. Altitudes Verification The MACS flight simulator operates with AT altitude restrictions specified at individual waypoints. Therefore, AT altitude restrictions were estimated for each waypoint which had modeled restrictions corresponding to a range of admissible altitudes, i.e., AT OR ABOVE and/or AT OR BELOW restrictions. Each AT altitude restriction was specified as the midpoint of the range. The range was given by the AT OR ABOVE and AT OR BELOW restrictions at the waypoint, or by the lower and upper bounding altitudes implied by the restrictions at the current waypoint and its predecessor (AT OR BELOW) or the current waypoint and its successor (AT OR ABOVE). The estimated AT restrictions were verified against nominal aircraft descent and climb rates obtained from the TARGETS airspace design software in order to ensure their compatabilities with nominal aircraft performance constraints. The TARGETS-based gradients were specified on a distance basis (feet/nautical mile) at altitudes of 0, 10k, 20k, 30k, and 40k feet. These were interpolated with a cubic polynomial to specify a continuous gradient as a function of altitude. In turn, each AT altitude restriction was verified and adjusted as necessary in accordance with the estimated climb and descent gradient functions. B. Scenario Generation An assessment scenario specified the flight plan, initial conditions, aircraft type and other data for one or more simulations. An arrival aircraft flight plan consists of departure and arrival airports, an assigned landing runway, an assigned arrival route of a particular modeled procedure including enroute transition, common route, and runway transition. A departure aircraft flight plan was similar, instead including an assigned takeoff runway and departure route. Initial conditions included position, speed and heading. Additional data included climb, cruise, descent approach and landing speeds, cruise altitude, and Boolean variables concerning aircraft equipage and capabilities. All scenarios were run in zero wind conditions. Each modeled route was evaluated for four different aircraft classes: Aircraft model CRJ700 to represent a large commuter, model B737-800 to represent a large, model B747-400 to represent a heavy, and model B757-200 to represent a Boeing 757. Each scenario corresponded to a particular combination of arrival or departure route and aircraft type. The study evaluated 324 departure scenarios, corresponding to 81 distinct departure routes each evaluated for four different aircraft types. The 81 departure routes derived from 17 of the modeled departure procedures selected for evaluation. Similarly, 200 arrival scenarios were evaluated, corresponding to 50 arrival routes evaluated for four aircraft types. The 50 arrival routes derived from 15 of the modeled arrival procedures selected for evaluation. C. Flight Simulation The purpose of the flight simulations was to ensure reasonable conformance of MACS-generated track history to the waypoint positions and altitude restrictions specified in the Southern California metroplex airspace model. Flight simulations were conducted for each scenario. MACS flyability of each procedure was verified through the qualitative assessment of track history data against procedure waypoints and altitude restrictions. Track histories spanned from the aircraft initial position to the airport runway threshold. Lateral and vertical profile plots were produced for every simulated flight, and were observed against waypoints and altitude restrictions to verify for 11 American Institute of Aeronautics and Astronautics
Latitude, Degrees
Altitude, Feet
lateral and vertical conformance. Track history lateral paths were compared visually to specified waypoints to ensure the aircraft passes through waypoints or flies a reasonable lateral route agreeing with waypoints. Track history vertical profiles were compared visually to altitude restrictions specified at waypoints to ensure the aircraft met or closely agreed with each altitude restriction. If gross deviations were identified, the lateral path and/or altitude restrictions were altered to yield a flyable procedure, while maintaining the spirit of the route model. The figures below depict simulated lateral paths and vertical profiles, along with their specified waypoints and altitude restrictions, for example arrival and departure scenarios. Such figures were generated for all the generated scenarios as verification of route flyability. In this manner, the MACS flyability of each scenario was verified.
Longitude, Degrees
Time, Seconds
Figure 3. Lateral path (left) and vertical profile (right) for flight simulation of CRJ7 transiting modeled arrival procedure LYNXX9.BUR along en route transition DAG. Lateral path plot depicts waypoints and simulated flight path. Vertical profile plot depicts waypoint altitude restrictions and with simulated vertical profile.
12 American Institute of Aeronautics and Astronautics
Altitude, Feet
Latitude, Degrees
Longitude, Degrees
Time, Seconds
Figure 4. Lateral path (left) and vertical profile (right) for flight simulation of CRJ7 transiting modeled departure procedure LAX.LOOP6 along en route transition DAG. Lateral path plot depicts waypoints and simulated flight path. Vertical profile plot depicts waypoint altitude restrictions and with simulated vertical profile.
V. Conclusion In conclusion, the SDO Modeling for the Southern California Metroplex project developed a process to model a highly complex metroplex terminal airspace, which may be applied to any other airspace. The study applied the process to develop a highly detailed model of the lateral paths and altitude ranges of the major and minor arrival and departure traffic flows for six major Southern California metroplex airports. The modeled routes and procedures were of sufficient detail, accuracy and validity to support their flight simulation-based verification. The study produced a set of baseline procedures and scenarios to support a multitude of single- and multi-airport research activities. The immediate application was to support simulation-based evaluation of concepts and technologies developed for super dense operations in the terminal airspace, such as multi-airport traffic flow scheduling and coordination and conflict detection and resolution. The modeled routes and procedures were also suitable for airspace design activities. Examples include SCT airspace sector redesign, design of arrival/departure routes to implement Optimal Profile Descent and optimal profile climb profiles, design of arrival/departure routes to leverage aircraft area navigation and required navigation performance (RNP/RNAV) aircraft capabilities, and to support subsequent spatial deconfliction of arrival and departure routes with one another in the Southern California metroplex environment. Modeling the current-day airspace is the first step towards pursuing any of these activities, as it accounts for the airspace that the traffic flows tend to occupy. Proposed is an additional trajectory data analysis step to characterize the lateral ranges of the trajectories at each modeled lateral path waypoint. Coupled with the altitudes characterization, this would provide a detailed model of the current-day traffic corridors.
Acknowledgments This work was funded by NASA Ames Research Center with American Recovery and Reinvestment Act (ARRA) funds under contract NNA10DA86D. The authors thank NASA contract technical monitors Ms. Debbi Ballinger and Mr. John Robinson for their careful attention to and support of the project throughout its duration. The authors recognize the invaluable inputs from NASA researchers including Harry Swenson, Jane Thippavong, Doug Isaacson, Savvy Verma, Todd Callentine, Tom Prevot, Ev Palmer and others in shaping the approach to this work.
References 1
NASA Airspace Systems Program, “Next Generation Air Transportation System Concepts and Technology Development: FY2010 Project Plan,” Version 3.0, May 18, 2010.
13 American Institute of Aeronautics and Astronautics
2
MITRE TARGETS tool described at http://www.mitrecaasd.org/work/project_details.cfm?item_id=152 [cited 17 Jan 2011]. CSSI, Inc., Terminal Area Route Generation, Evaluation and Traffic Simulation Software Brochure, accessed at http://targets.cssiinc.com/external/downloads/documents/TARGETS-Brochure.pdf, March 9, 2011. 4 Federal Aviation Administration, National Flight Data Center, http://nfdc.faa.gov/index.jsp [cited 17 Jan 2011]. 5 Isaacson, D., Robinson III, J. E., Swenson, H., and Denery, D., “A Concept for Robust, High Density Terminal Air Traffic Operations,” Proceedings of the AIAA Aviation Tech-nology, Integration and Operations (ATIO) Conference, Fort Worth, TX, Sep. 2010. 6 Swenson, H., et. al., “Design and Evaluation of the Terminal Area Precision Scheduling and Spacing System,” Ninth USA/Europe Air Traffic Management Research and Development Seminar (ATM2011), June 14-17, 2011, Berlin, Germany. 7 Swenson, H., “Design and Evaluation of the Terminal Area Precision Scheduling and Spacing System,” Presentation delivered at the NASA Airspace Systems Technical Interchange Meeting, March 2011, San Diego, CA. 8 Tang, H., Robinson, J., Denery, D., “Tactical Conflict Detection in Terminal Airspace,” 10th AIAA Aviation Technology, Integration, and Operations (ATIO) Conference, Fort Worth, TX, 13-15 Sep. 2010. 9 Prevot, T., “Exploring the Many Perspectives of Distributed Air Traffic Management: The Multi Aircraft Control System MACS,” International Conference on Human-Computer Interaction in Aeronautics, HCI-Aero 2002, MIT, Cambridge, MA, October 23-25, 2002. 10 Prevot, T., Palmer, E. A., Smith, N., and Callantine, T.. “A Multi-Fidelity Simulation Environment for Human-in-the-Loop Studies of Distributed Air Ground Traffic Management,” American Institute of Aeronautics and Astronautics Modeling and Simulation Conference and Exhibit, Monterey, CA, August 2002. 11 Prevot, T., Mercer, J., “MACS: A Simulation Platform for Today’s and Tomorrow’s Air Traffic Operations,” AIAA 20076556, AIAA Modeling and Simulation Technologies Conference and Exhibit, 20-23 August 2007, Hilton Head, SC. 12 Couluris, G., Davis, P., Mittler, N., Saraf, A., Timar, S., “ACES Terminal Model Enhancement,” 2009 IEEE/AIAA 28th Digital Avionics Systems Conference (DASC), Orlando, Florida, 23-29 October, 2009. 13 Couluris, G., Phillips, J., “CESTOL Impact on U.S. Airport Network Operations: Preliminary Analysis,” International Powered Lift Conference, London, UK. 14 Couluris, G., Signor, D., Phillips, J., “Cruise-Efficient Short Takeoff and Landing (CESTOL): Potential Impact on Air Traffic Operations,” NASA/CR–2010-216392, October 2010. 15 FAA Aviation System Performance Metrics (ASPM) program, accessible at: http://aspm.faa.gov/aspm/entryASPM.asp [cited 17 Jan 2011]. 16 Federal Aviation Administration, “ASPM Data Overview”, http://aspmhelp.faa.gov/index.php/ASPM_System_Overview [cited 1 November 2010]. 17 Penny, S., Hoffman, R., Krozel, J., and Roy, A. “Classification of Days in the National Airspace System Using Cluster Analysis.” Air Traffic Control Quarterly, Vol. 13, No. 1, 2005, pp. 29-54. 18 NOAA Satellite and Information Service, “NEXRAD National Mosaic Reflectivity Images,” http://www4.ncdc.noaa.gov/cgi-win/wwcgi.dll?wwNexrad~GetImages [cited 1 November 2010]. 19 Paielli, R., Erzberger, H., “Improved Conflict Detection for Reducing Operational Errors in Air Traffic Control,” AIAA 2004-6392, AIAA 4th Aviation Technology, Integration and Operations (ATIO) Forum, 20 - 22 September 2004, Chicago, Illinois. 20 Callantine, T., “An Integrated Tool for NextGen Concept Design, Fast-Time Simulation, and Analysis,” Proceedings of the AIAA Modeling and Simulation Technologies Conference, Honolulu, HI, AIAA-2008-6343, 2008. 21 Nolan, Michael S., Fundamentals of Air Traffic Control, 4th Edition, Thomson Brooks/Cole, Belmont, CA, 2004. 22 http://www.airnav.com/ [cited 1 November 2010]. 3
14 American Institute of Aeronautics and Astronautics