Jun 8, 1999 - reduction due to a simplification of the rf system of the TESLA linear ... measurements on existing copper models of the TESLA Test Facility.
PHYSICAL REVIEW SPECIAL TOPICS - ACCELERATORS AND BEAMS, VOLUME 2, 062001 (1999)
Superconducting superstructure for the TESLA collider: A concept J. Sekutowicz DESY, Notkestrasse 85, Hamburg 22603, Germany
M. Ferrario INFN, Via Enrico Fermi 40, Frascati 00044, Italy
Ch. Tang Tsinghua University, Beijing 100084, China (Received 8 September 1998; published 8 June 1999) We discuss a new layout of a cavity chain (called superstructure) allowing, we hope, a significant cost reduction due to a simplification of the rf system of the TESLA linear collider. The proposed scheme increases the fill factor and thus makes an effective gradient of the accelerator higher. In this paper computations and preliminary measurements on existing copper models of the TESLA Test Facility accelerating structures are presented. A new copper model of the scheme has been ordered, made of four 7-cell standing wave cavities, which according to the results of computations and measurements seems to be the most promising version. Experiments with a beam will be necessary to prove that the proposed layout can be used for the acceleration. [S1098-4402(99)00039-7] PACS numbers: 84.90.+a, 41.20.–q, 41.75.Ht
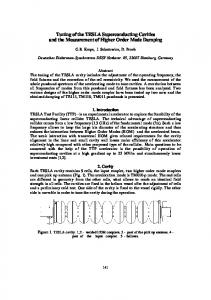
I. INTRODUCTION Recent tests have shown that two main technical specifications for the TESLA superconducting cavities— an accelerating gradient Eacc of 25 MVym and a quality factor Q0 $ 5 3 109 —are achievable for 1300 MHz bulk niobium cavities [1,2]. The R&D program at DESY started in 1992 to develop superconducting technology for the future linear collider is being continued in order to obtain specifications reproducibly and to lower the cost of the technology. The essential part of the total investment is the cost of the rf, meant here as the sum of the cost of accelerating structures with auxiliaries and the cost of the rf power distribution system. To reduce this cost more effort should be made to decrease the number of rf components, e.g., fundamental mode (FM) couplers, higher order mode (HOM) couplers, waveguides, circulators, and waveguide transformers, and to increase the effective gradient Eeff in the collider. In the present TESLA Test Facility (TTF) design there is 1 FM coupler and 2 HOM couplers per 9-cell cavity which is 1 m long. The dense positioning of FM couplers makes the rf power distribution system and cryostats more complex and thus more expensive. The effective accelerating gradient in both linacs will be 17.8 MVym only, while the cavities will be operated at 25 MVym. There are two reasons for this: a small fill factor and an unflatness of the accelerating field. The fill factor, defined as the ratio fill factor scavity active lengthdyscavity total lengthd, has a low value of 0.75. This results mainly from the 3ly2 long interconnections between cavities (see Fig. 1). This length was chosen at the beginning of the linear col1098-4402y99y2(6)y062001(7)$15.00
lider studies only to obtain good cavity separation for the accelerating mode and simplicity in the phase adjustment. The first argument will be discussed later, but 7 km of passive length appears too generous. The second argument is no longer valid since a variable coupler or a 3-stub waveguide transformer, similar to those installed in the HERA e 2 ring [3], can be applied in the rf input line of each cavity, to adjust the phase and the value of Qext , for reflection-free operation. The cell-to-cell amplitude variation of the accelerating field is often ,10%. This leads to ,5% reduction of Eeff because the achievable gradient is usually limited by the cell with maximum amplitude. For the accelerating p mode, the error of the field amplitude DAcell in an individual cell is related to the frequency error Dfcell of the cell as follows [4]: DAcell , sNd2 Dfcell ykcc ,
(1)
where N is the number of cells in the cavity and kcc is the cell-to-cell coupling. Experience shows that TTF cavities with N 9 and kcc 1.9% are at the limit. Each mechanical, chemical, or thermal treatment perturbs the 12 λ/2 9 λ/2
cavity
FIG. 1.
interconnection
The 9-cell cavity and the interconnection.
© 1999 The American Physical Society
062001-1
PRST-AB 2
J. SEKUTOWICZ, M. FERRARIO, AND CH. TANG
field profile and the specification of field unflatness of less than 5% is hard to obtain. A significant cost reduction could be gained when N increases due to the lower number of rf auxiliaries per unit length. Unfortunately, there are two fundamental limitations on N. First, the field profile, which is already a problem, becomes less stable proportional to N 2 , as can be seen from Eq. (1). Second, the probability of trapping parasitic resonances within the structure is higher. This is especially dangerous for superconducting cavities because parasitic modes can have a big beam impedance due to high quality factor.
062001 (1999)
cavity No. 1
cavity No. 2
Eacc [arb. units]
z [m]
II. SUPERSTRUCTURE To overcome limitations on N and simultaneously to make interconnections shorter one may use the layout (superstructure) shown in Fig. 2. The idea is to couple cavities by short beam tubes to enable an energy flow from cavity to cavity instead of separating them by a long interconnection. In this scheme, similar to the present design, HOM couplers are attached to interconnections and each cavity (subunit) is equipped with a tuner. This layout increases the number of cells fed by one FM coupler, avoiding the two limitations we mentioned above. Both the field flatness and the HOM damping can still be handled at the subunit level. The number of modes in the FM passband is NNs , where Ns is a number of coupled cavities. The cavity-to-cavity coupling, kss , causes each of the N modes of a single cavity to split into a group of Ns resonances. The synchronism between the ultrarelativistic beam and the accelerating field requires that the shortest possible interconnection be ly2 long. When N is an odd number, the p-0 mode (p is cell-to-cell phase advance and 0 is cavity-to-cavity phase advance) can be used for the acceleration. The accelerating field profile of this mode in two neighboring cavities is shown in Fig. 3. When the length is fixed, coupling kss depends on the diameter of the interconnecting tube and on the field profile. It varies from mode group to mode group. For the practicable diameter of the interconnection kss is smaller than kcc . Figure 4 shows an example of kss for different groups of a superstructure based on a 9-cell cavity with end beam tubes of 110 mm diameter. In this diagram, mode groups are
FM coupler
HOM couplers λ/2
FIG. 3. An example of Eacc vs z in two neighboring 7-cell cavities excited in the p-0 mode.
represented by the cell-to-cell phase advance. Although kss is small, with the help of tuners one can correct the frequency of each subunit to equalize the mean value of the field amplitude in all subunits (not in the cells within one subunit). Additionally one should note that even kss is small; perturbation of the cavities phasing resulting from the beam loading will be negligible. This is mainly due to the high value of the loaded Q s.106 d for the TESLA superconducting structures. According to Eq. (82) in [5] for a few coupled cavities, this phase shift will be less than 1±. III. SUPERSTRUCTURE BASED ON THE 7-CELL SUBUNIT The performance of the superstructure depends on the field profile stability within each subunit. There are two ways to make the accelerating field more stable: increasing kcc and reducing N in the subunit; see Eq. (1). The first proposed superstructure [6], made of four 9-cell cavities, had a more stable field due to the enlarged midiris diameter and thus 3 times stronger kcc than the TTF cavity. Unfortunately, the bigger aperture has some disadvantages as compared to the present design: higher Epeak yEacc and Hpeak yEacc , and lower impedance sRyQd. These caused the total improvement in Eeff to be rather small. Nevertheless, the large iris is better for alternative fabrication methods such as hydroforming or spinning. These
0.04
λ/2
kss [ %]
tuner
tuner
cavity 1
cavity 2
tuner ............ cavity Ns
FIG. 2. An example of Ns 7-cell cavities coupled by short interconnections (superstructure).
062001-2
00
π/9 2π/9 3π/9 4π/9 5π/9 6π/9 7π/9 8π/9 π Cell-to-cell phase advance (group)
FIG. 4. kss for different mode groups in the superstructure based on a 9-cell cavity with a 110 mm beam tube.
062001-2
PRST-AB 2
SUPERCONDUCTING SUPERSTRUCTURE FOR THE …
methods are under development, and may in the future significantly reduce the cavity cost [7,8]. In addition, much lower transversal and longitudinal loss factors make this superstructure suitable for the acceleration of bunches with high population of particles, as in the case of the muon collider. Today, the most probable future scenario for the energy upgrade of the TESLA collider, above 500 GeV, is operation at higher accelerating gradient and/or making the collider longer [9]. This brought us to an alternative version of the superstructure [10], based on the TTF shape with modified end cells and reduced N from 9 to 7 to improve field stabilization according to (1). As before, the superstructure is made of four subunits. This version keeps Epeak yEacc and Hpeak yEacc low, as in the TTF cavity, and makes operation above 25 MVym more feasible, since the maximum electric and magnetic fields on the Nb wall are further from the theoretical limitations. Table I contains a list of parameters of the superstructure and the TTF cavity. The last row of the table shows Eeff for the operation at 25 MVym. In the case of the superstructure, Eeff is computed according to the bigger fill factor given in the third row and corrected with the expected field unflatness. This is scaled from the value observed for the TTF cavities proportional to the field instability factor shown in the fourth row. The resulting Eeff value for the superstructure is higher than Eeff of the TTF cavity by 19%. A. Refilling of cells and bunch-to-bunch energy spread The most critical part of the numerical simulation is the calculation of the transient state and the bunch-to-bunch energy spread. Two codes, HOMDYN [11] and MAFIA [12,13], showed that there is enough time to refill the cell’s energy in the superstructure before the next bunch arrives. This result is not obvious since the coupling between subunits is very small. The computed energy gain for the proposed superstructure, when it is operated at 25 MVym, is shown in Fig. 5(a). The energy spread
TABLE I. cavity.
Parameters of the superstructure and the TTF
Parameter
Superstructure
TTF cavity
Radius of mid/end iris (mm) NyNs Fill factor Field instability factor N 2 ykcc s103 d kcc (%) kss p group (%) sRyQd subunit/cavity sVd Epeak yEacc Hpeak yEacc fOeysMVymdg Eeff sMVymd
35/57 7/4 0.875
35/39 9/1 0.75
2.6 1.9 3.6 3 1022 732 2.0 41.8 21.2
4.3 1.9 ··· 1030 2.0 41.8 17.8
062001-3
062001 (1999)
En [MeV]
(a) 81.482
81.477 0
400 800 Bunch Index
1200
(b)
En [MeV]
81.482
81.477 0
10
t [µs]
20
30
FIG. 5. (a) Energy gain for 1130 bunches accelerated with the superstructure. (b) Energy gain vs time for the first 40 bunches.
for the whole train of 1130 bunches is ,5 3 1025 . It results from the interference of the accelerating mode with other modes from the p group and the 6py7 group. The difference in energy is bigger at the beginning of the train [Fig. 5(b)] and becomes smaller at the end of the pulse due to the decay of interfering modes. B. The HOM damping scheme For the chosen diameter of the interconnecting tubes almost all HOMs are above cutoff. According to the computation, their field strength is high enough for damping with HOM couplers attached at the middle of the interconnections. In that way, each HOM coupler can be exploited to damp modes from two neighboring cavities. Such a scheme will require fewer HOM couplers than the current one, but this must be proven experimentally. The couplers have to couple both electrically and magnetically, due to a standing wave pattern of HOMs in interconnections. One should mention that the HOM couplers used at present already have this coupling characteristic providing the required Q values in the range of 104 105 . C. Changes in the rf system In addition to the improvement in the effective accelerating gradient, the number of FM and HOM couplers 062001-3
PRST-AB 2
J. SEKUTOWICZ, M. FERRARIO, AND CH. TANG
TABLE II. Changes in the rf system.
Number of FM couplers Number of HOM couplers Number of tuners and vessels Power/FM coupler (kW)
062001 (1999)
50
TTF design
Superstructure
19 230 38 460 19 230 208
6181 24 724 24 724 640
π−0
P [dB] 8π/9-group
will be significantly reduced, if the proposed scheme can be used for the acceleration. Table II shows the total amount of couplers, helium vessels, and tuners needed in the TESLA collider in two cases: when the layout of linacs is based on the current TTF cavity design and, alternatively, when it is based on the superstructure. The number of FM couplers is reduced by a factor of 3. This has major consequences for the cost of the whole rf system. The layout based on the proposed superstructure needs an additional 22% more tuners and liquid helium vessels due to 7 instead of 9 cells in a subunit. Nevertheless, the simplification in the rf system and the cryostat construction will dominate and a total cost reduction can be expected. The power transferred by the FM coupler feeding the superstructure is 640 kW. The new version of the FM coupler developed at DESY has been tested up to 1.6 MW for the whole TESLA pulse length [14]. The limitation was due to the rf power source. Since this version already exceeds the power needed for operation of the superstructure at 25 MVym we do not expect fundamental difficulties here. IV. PRELIMINARY MEASUREMENTS Four existing copper models of 9-cell TTF cavities have been used for preliminary rf measurements on the superstructure. The length of beam tubes, the diameter of which is only 78 mm, was adjusted to get a kss value for the p group equal to the value from Table I. A. Tuning of the FM field profile Each of the four cavities has been tuned individually for a field flatness of better than 98% and the chosen frequency of the p-0 mode. The operating cavities’ boundary conditions are imposed by the nearby cavities or the beam pipe. We reproduced the operating boundary conditions for the tuning procedure by means of metallic plates ly4 apart from the last iris, for inner cavities’ tuning, and a beam tube connected to the external iris for the outer cavities’ tuning. After they had been connected in one superstructure, the field measured with an exciting antenna placed in the first cell and a pickup antenna in the last cell, as in the standard bead pull measurement, showed unflatness of 20%. This was mainly due to the overlapping of neighboring modes with the p-0 mode (see Fig. 6) and some mechanical deformation of 062001-4
π-group
20 f [MHz]
1298
1301
FIG. 6. Modes from the 8py9 group and the p group when Q0 2.5 3 104 .
end cells during the assembly. The influence of the overlapping has been simulated with the help of a lumped element circuits code. The computation has been done for 36 LCR resonators, coupled in four groups. The group-to-group coupling and the coupling within each group were equal to the values of kss and kcc from Table I. Both couplings had capacitive character as it is common for cavities of this shape. The results are shown in Fig. 7. The whole chain has been tuned for the unloaded superconducting case, Q0 3 3 1010 . The achieved field flatness for all 36 amplitudes was better than 99%. In the next computation, resistors in the whole chain were changed to simulate superconducting cells loaded with the beam sQ 3.4 3 106 d. The computed field profile stayed unchanged. Further, the resistors were modified a second time to simulate the copper model of the superstructure with Q0 2.5 3 104 . This time the field profile was perturbed significantly and it was very similar to one that we have measured with the bead-pull technique for these antenna positions. To suppress both nearest modes the antennae were placed at the midcells in which these modes have a small field amplitude. The measured field profile of p-0 mode for these antenna positions is shown in Fig. 8. The unflatness ,4% of the field was obtained after small frequency correction of the
1 |A| [arb. units]
0 0
9
18 Cell Index
27
36
FIG. 7. Computed amplitudes in an LCR replacement circuit of four 9-cell TTF cavities: sjd Q0 2.5 3 104 , srd Q0 3 3 1010 and Q 3.4 3 106 .
062001-4
PRST-AB 2
SUPERCONDUCTING SUPERSTRUCTURE FOR THE …
1
062001 (1999)
1 (a)
| Eacc | [arb. units]
V9 [arb. units]
0 cavity 1
cavity 2
cavity 3
cavity 4
0
FIG. 8. The measured field profile in the preprototype of the superstructure.
0
t [µs]
40
1
end cells. Unfortunately, in Nb cavities no openings are available in the inner cells for antenna attachment. This makes the control of the field profile at room temperature more complicated and allows no mechanical perturbation of well pretuned subunits during the assembly of the superstructure. The stability of the FM field pattern was tested for an inner and an outer subunit. In both cases, measurement began with the tuned field profile shown above. For a detuning of a few kHz the perturbation DAyA of the mean field amplitude of a subunit was proportional to the subunit frequency perturbation Df, DAyA 20.01ykHz Df . The measurement has proven that the sensitivity of the field pattern is not critical. The tuners and the frequency control system applied in the TTF linac already allow adjustment of the frequency of an individual cavity with an accuracy of 0.8 Hz. On the other hand, when necessary during the linac operation by a proper detuning one can lower the accelerating field of a subunit showing degradation in performance, while simultaneously keeping the field of other subunits at the former level. B. Transient state of the fundamental mode The transient state of each cell from the chain has been computed with the help of the HOMDYN code [15]. For cells No. 9 and No. 36 the computed curves are compared with the measured curves in Figs. 9(a) and 9(b). The agreement between the computed and measured results is good. Small differences come mainly from a variation of the cell-to-cell coupling in the copper models. The variation of kcc causes some additional effect for other modes from the FM passband. This is discussed in the following subsection. C. Other modes from the FM passband Due to manufacturing errors in the iris region, kcc varies from cell to cell and from subunit to subunit. As a result when the p mode frequency of all subunits is equal, the frequencies of other modes from the FM 062001-5
(b)
V36 [arb. units]
0 t [µs]
0
40
FIG. 9. (a) Transient in cell No. 9: computed (bold line), measured (standard line). (b) Transient in cell No. 36: computed ( bold line), measured (standard line).
passband differ from each other. As an example, the deviation from mean values of the four lowest modes for existing copper models is shown in Fig. 10. When identical subunits are assembled in the superstructure these modes form groups with small kss coupling (see Fig. 4). In a real case, the uncorrected difference in frequency causes the subunits to stay uncoupled for these groups and behave like separate cavities. The sRyQd values of these resonances are small since a cancellation of impedance takes place within each subunit, as it does for the uncoupled TTF cavities. The computed sRyQd values for the 28 passband modes of superstructure are
0.5
∆f [MHz] 0
-0.5
π/ 9
2π/ 9
3π/ 9
4π/ 9
Phase advance (mode)
FIG. 10. Frequency deviation from the mean values for Cu models of a 9-cell TTF cavity: cavity No. 1 sdd, cavity No. 2 sjd, cavity No. 3 ssd, and cavity No. 4 smd.
062001-5
PRST-AB 2
J. SEKUTOWICZ, M. FERRARIO, AND CH. TANG
10000 1000 100 (R/Q) 10 1 [Ω] 0.1 0.01 0.001 0.0001
81.6
2928 a En [MeV] b
0
4
8
12
16
20
24
28
80.6
Mode Index
0
FIG. 11. sRyQd’s for modes from the FM passband: srd accelerating mode, sed other modes.
shown in Fig. 11. An interaction between the beam and these resonances has been estimated with the help of the HOMDYN code. For the computation, the frequency of a mode with the highest sRyQd in each group has been shifted to the frequency of the nearest harmonic to simulate the worst case, i.e., a synchronous excitation of the mode. The Q values were chosen in the following way: for 16 modes from the py7, 2py7, 3py7, and 4py7 groups (small kss ), Q was set to 109 with an assumption of no coupling to the input via the FM coupler (no damping). For the other 11 modes from the 5py7, 6py7, and the p groups, Q was scaled from the loaded Q of the accelerating mode, according to their field pattern in the superstructure. These Q values are shown in Fig. 12. The computed energy spread is of the order of 6 3 1023 (Fig. 13, upper curve). It exceeds the specification but can be significantly reduced, to the level of 1023 , when the injection time is properly chosen in order to balance the beam induced voltage by the rising generator voltage (Fig. 13, lower curve). Four modes, No. 9, No. 16, No. 17, and No. 24, give a 95% contribution to the computed energy spread. The original frequencies of these modes were shifted for the computation by 0.61, 0.52, 0.32, and 20.88 MHz, respectively. Since the energy spread for the original spectrum was smaller than 5 3 1025 , the most effective
10
0.0008
FIG. 13. The computed energy gain when frequencies of the highest sRyQd modes from the FM passband are set to the nearest harmonics: (a) without compensation, ( b) with the injection time compensation.
remedy is to keep the frequencies of these modes between harmonics. This requires an accuracy in the fabrication of irises of better than 60.2 mm. Further simulations, for the higher Q values, gave almost the same result due to the short beam time, 800 ms. As an example, the beam induced voltage vs Q for a mode with sRyQd 1 V and a beam current of 8 mA is shown in Fig. 14. It can be seen that the voltage rather weakly depends on Q for values higher than 107 . V. FINAL REMARKS The proposed superstructure is not yet proven experimentally. In the near future copper models of the superstructure and HOM coupler will be ready. The rf measurements on those models should help us to verify the computation we have done up to now for the superstructure made of four 7-cell cavities. We will be able to check on the copper models tuning and field profile adjustment, transient state in individual cells, HOM damping scheme, coupling to FM coupler, and influence of machining errors. To check the numerical simulation of the bunch-tobunch energy spread a Nb prototype must be built and tested with the beam.
V [MV]
6
17
21
25
29
Mode Index
FIG. 12. The computed quality factors for modes from the 5py7, 6py7, and p groups: srd accelerating mode, sed other modes.
062001-6
t [s]
0.03
8
Q 107
10
062001 (1999)
0 10
5
Q
9
10
FIG. 14. The induced voltage vs Q, for sRyQd 1 V, a beam current of 8 mA, and a beam on time of 800 ms.
062001-6
PRST-AB 2
SUPERCONDUCTING SUPERSTRUCTURE FOR THE … ACKNOWLEDGMENTS
We would like to express our gratitude to R. Brinkmann, D. Proch, P. Schmüser, N. Walker, J. Weisend, and the TESLA Collaboration group for many helpful discussions.
[1] D. Edwards, TESLA Report No. 95-01, 1995. [2] B. Aune and D. Trines, in Proceedings of the Particle Accelerator Conference, Vancouver, Canada, 1997 (IEEE, Piscataway, NJ, 1998). [3] B. Dwersteg and Q. Yufang, DESY Report No. M-89-08, 1989. [4] D. Nagel, E. Knapp, and B. Knapp, Rev. Sci. Instrum. 38, 1583 (1967). [5] G. A. Loew and R. B. Neal, in Linear Accelerators, edited by P. M. Lapostolle and A. L. Septier (North-Holland, Amsterdam, 1969). [6] J. Sekutowicz, TTF Meeting, IPN internal report, Orsay, France, 1997.
062001-7
062001 (1999)
[7] H. Kaiser (private communication). [8] V. Palmieri et al., in Proceedings of the 7th Workshop on SRF, Gif-sur-Yvette, 1995 (Institut National de Physique Nucléaire at de Physique des Particules, Gif-sur-Yvette, 1996). [9] R. Brinkmann, in Proceedings of the Particle Accelerator Conference, Dallas, 1995 (IEEE, Piscataway, NJ, 1995), Vol. 1. [10] J. Sekutowicz, M. Ferrario, and C. Tang, in Proceedings of LC’97, Zvenigorod, 1997 (Institute of Nuclear Physics, Portvino, 1997). [11] M. Ferrario, A. Mosnier, L. Serafini, F. Tazzioli, and J. M. Tessier, Part. Accel. 52, 1– 30 (1996). [12] R. Klatt et al., in Proceedings of the 1986 Linear Accelerator Conference, Stanford, California (SLAC, Stanford, CA, 1996). [13] M. Dohlus (private communication). [14] D. Proch (private communication). [15] J. Sekutowicz, M. Ferrario, and C. Tang, in Proceedings of the TTF Meeting, DESY, 1998 (DESY, Hamburg, 1998) (TESLA Report No. 98-05).
062001-7