Aug 24, 2011 - arXiv:1108.4801v1 [cs.SI] 24 Aug 2011. Supervised Rank Aggregation for Predicting Influence in Networks. Karthik Subbian and Prem Melville.
Supervised Rank Aggregation for Predicting Influence in Networks Karthik Subbian and Prem Melville IBM T.J. Watson Research Center, Yorktown Heights, NY 10598 Email: {ksubbian,pmelvil}@us.ibm.com
arXiv:1108.4801v1 [cs.SI] 24 Aug 2011
August 25, 2011 Abstract—Much work in Social Network Analysis has focused on the identification of the most important actors in a social network. This has resulted in several measures of influence and authority. While most of such sociometrics (e.g., PageRank) are driven by intuitions based on an actors location in a network, asking for the “most influential” actors in itself is an ill-posed question, unless it is put in context with a specific measurable task. Constructing a predictive task of interest in a given domain provides a mechanism to quantitatively compare different measures of influence. Furthermore, when we know what type of actionable insight to gather, we need not rely on a single network centrality measure. A combination of measures is more likely to capture various aspects of the social network that are predictive and beneficial for the task. Towards this end, we propose an approach to supervised rank aggregation, driven by techniques from Social Choice Theory. We illustrate the effectiveness of this method through experiments on Twitter and citation networks.
I. Introduction The rise of Social Media, with its focus on user-generated content and social networks, has brought the study of authority and influence in networks to the forefront. For companies and other public entities, identifying and engaging with influential authors in social media is critical, since any opinions they express could rapidly spread far and wide. For users, when presented with a vast amount of content relevant to a topic of interest, ordering content by the source’s authority or influence assists in information triage, thus overcoming the ever-increasing information overload. Following this need, there has been a spate of recent work studying influence and the diffusion of information in social networks [1], [2], [3]. While these works are important in furthering our understanding of the dynamics of communication in networks, they do not directly give us measures of influence and authority in social media. On the other hand, there has been much work in the field of Social Network Analysis, from the 1930’s [4] onwards, that has focused explicitly on sociometry, including quantitative measures of influence, authority, centrality or prestige. These measures are heuristics usually based on intuitive notions such as access and control over resources, or brokerage of information [5]; and has yielded measures such as
Degree Centrality, Eigenvector Centrality and Betweeness Centrality [6]. In this paper, we address the problem of identifying influence by posing it as a predictive task. In particular, we compare different measures of influence on their ability to accurately predict which users in Twitter will be virally rebroadcast (retweeted) in the near future. Formulating a concrete predictive task, such as this, allows us to quantitatively compare the efficacy of different measures of influence. In addition to evaluating individual measures of influence, such as Degree Centrality and PageRank, we propose combining them to produce a more accurate measure of influence. Given that each measure produces an ordering of elements, we can leverage rank aggregation techniques from Social Choice Theory, such as Borda [7] and Kemeny optimal rank aggregation [8]. These classical techniques were designed to combine rankings to ensure fairness amongst voters and not to maximize performance on a predictive task; and as such are unsupervised. In this paper, we introduce Supervised Kemeny Ranking in order to aggregate individual rankings for the task of predicting influence in networks. We demonstrate the effectiveness of our approach in a case study of 40 million Twitter accounts; and we further corroborate these results in a study of publication citation networks. In this paper, we make the following key contributions: (1) We propose a predictive, rather than a heuristic, perspective of influence, by formulating measurable predictive tasks. (2) We combine ideas from Sociometry and Social Choice Theory in novel ways. (3) We present a new approach to supervised rank aggregation. (4) We show the effectiveness of our approach on real-world network data. (5) We demonstrate that our approach is significantly better than current practice and other baselines that we devised. II. Data Set and Task Definition Our primary study was based on the Twitter discussion around Pepsi. What piqued our interest in Twitter and the role of influencers was the infamous sexist iPhone app called “AMP UP B4 U SCORE”. An avalanche of Twitter
users slammed the app ultimately leading to an apology from Pepsi. In this study, we found that the influence of twitter users heavily depends upon the number of rebroadcasts of his/her messages to millions of other users. In the context of Twitter, this suggests that a useful task would be to predict which twitterers will be significantly rebroadcast via retweets. One obvious indicator of influence could be the number of followers a user has (in-degree of the Follower Graph). However, many users follow 100K or more users and therefore this may not be sufficient indication of influence. For this reason, we consider two alternatives, the Retweet Graph and the Mention Graph, where edges correspond to retweets and mentions of users in the past. We generate two versions of both the Retweet and the Mention Graph, one collapsing all repeat connections from the same user i to the user k into just one edge. The second version uses the number of retweets/mentions as edge weights. For our influence measures (rankings) we use in-degree, outdegree and PageRanks (with a damping factor of 0.85). In addition to degree and eigenvector centralities, there are other important socio-metrics based on the paths between vertices like, Closeness and Betweeness Centrality. We exclude them, as they come at the prohibitive computational cost of calculating all-pairs shortest paths in a graph (O(V 3 )).1 We extracted the data2 to generate these graphs over a two week period from 11/11/09 to 11/26/09. This gives a Follower Graph with 40 million nodes (users) and 1.1 billion edges. We used the socio-metrics computed from these graphs to predict which users will have viral outbursts of retweets in the following week. We compare these predictions with the actual amount of retweets in the following week. For the purposes of testing, we monitored all retweets of a set of 9,625 users. This is the set we use for the train-test splits in our experiments. We construct our prediction task from our data by dividing users in our test period into two classes – people who have been retweeted more than a threshold and below. In our data set, we selected 10% of the maximum number of retweets within a week as the threshold (100 retweets). We treat this as a binary classification problem, where the ranking produced by each measure is used to predict the potential for viral retweeting in the test time period. Since we are primarily concerned with how well these measures perform at ranking users, we compare the area under the ROC curve (AUC) based on using each measure [9]. For some applications it is more important to correctly rank relevant elements at the top of list, which we also measure by Average Precision (AP) for the top k users [10]. 1 In related work, we have been working on a scalable algorithm for computing Betweeness Centrality, exploiting hierarchical parallelization. 2 We will make all our data publicly available.
Measure Followers Friends Follower Pagerank Distinct Past Retweets People Retweeted Retweet Pagerank Past Retweets Retweets Made Distinct Mentions Received People Mentioned Mention Pagerank Mentions Received Mentions Made
Definition Follower Graph Indegree Follower Graph Outdegree Follower Graph Pagerank Retweet Graph Indegree Retweet Graph Outdegree Retweet Graph Pagerank Wtd. Retweet Indegree Wtd. Retweet Outdegree Mention Graph Indegree Mention Graph Outdegree Mention Graph Pagerank Wtd. Mention Indegree Wtd. Mention Outdegree
AUC 88.18 76.03 85.77 90.17 87.04 88.38 90.18 86.80 60.71 86.11 70.43 60.53 84.69
AP 0.4366 0.2821 0.4397 0.7246 0.3976 0.5135 0.7406 0.4707 0.5690 0.5923 0.3631 0.2737 0.2895
TABLE I C OMPARING RANKING MEASURES FOR IDENTIFYING VIRAL POTENTIAL , IN TERMS OF AUC(%) AND AVERAGE P RECISION @100.
We compared all measures of influence averaged over 20 trials of random stratified samples of 80% of the users (see Table I). We find that 9 of the 13 individual measures by themselves are quite effective at ranking the top potentially viral twitterers with an AUC > 80%. Not surprisingly, the number of times that someone has been retweeted in the recent past produces very good rankings – based on AUC and Average Precision. The number of followers and the number of people mentioned also produce reasonably good rankings in terms of AUC and Average Precision respectively.3 However the Spearman rank correlation between recent past retweets and followers is not very high (0.43), suggesting that there are multiple forces at work here. This underscores the fact that each aspect (network of followers, diffusion of past retweets, and interactions through replies and mentions) contributes to ones potential to reach a large audience. By focusing on selecting a single centrality measure to capture influence we would miss out on the opportunity to more precisely detect potential viral users. III. Rank Aggregation As each socio-metric captures only some aspect of the user’s influence in the network, it is beneficial to combine them in order to more accurately identify influencers. One straightforward approach to combining individual measures is to use them as inputs to a classifier, such as logistic regression, which can be trained to predict the target variable (e.g., future retweets) on historical or held-out data. However, given that the individual influence measures produce an ordering of elements and not just a point-wise score, we can, instead leverage approaches to aggregating rankings for better results. The problem of rank aggregation or preference aggregation has been extensively studied in 3 Despite
measures.
its popularity, PageRank does not perform as well as other
Social Choice Theory, where there is no ground truth ranking, and as such are unsupervised. In this section, we explain the necessary background for appreciating our proposed method Supervised Kemeny Ranking, which is a supervised order-based aggregation technique, that can be trained based on the ground-truth ordering of a subset of elements. The Rank Aggregation Task: Let us begin by formally defining the task of rank aggregation. Given a set of entities S, let V be a subset of S; and assume that there is a total ordering among entities in V . We are given r individual rankers τ1 , ..., τr who specify their order preferences of the m candidates, where m is size of V , i.e., τi = [d1 , ..., dm ], i = 1, ..., r, ifd1 > ... > dm , dj ∈ V, j = 1, ..., m. If di is preferred over dj we denote that by di > dj . Rank aggregation function ψ takes input orderings from r rankers and gives τ , which is an aggregated ranking order. If V equals S, then τ is called a full list (total ordering), otherwise it is called a partial list (partial ordering). All commonly-used rank aggregation methods, satisfy one or more of the following desirable goodness properties: Unanimity, Non-dictatorial Criterion, Neutrality, Consistency, Condorcet Criterion and Extended Condorcet Criterion (ECC) [11]. We will primarily focus on ECC, defined below: D EFINITION 3.1. The Extended Condorcet Criterion [12] requires that if there is any partition {C, R} of S, such that for any di ∈ C and dj ∈ R a majority of rankers prefer di to dj , then the aggregate ranking τ should prefer di to dj . The ECC property is highly preferred in our domains, as it eliminates the possibility of inferior candidates being introduced strategically in order to manipulate the choice between superior candidates. In other words, it offers the property of Independence of Irrelevant Alternatives. Additionally, ECC is a relaxed form of Kemeny optimal aggregation (defined below), where the partition C and R are arranged in the “true” order, but not necessarily the elements within partitions C and R. In addition to the desirable theoretical properties, ECC proves to be very valuable in ranking in practice, as we will demonstrate in our experiments. We will focus on two classical rank aggregation techniques in this paper: Borda and Kemeny, describe below. Borda Aggregation: In Borda aggregation [7] each candidate is assigned a score by each ranker; where the score for a candidate is the number of candidates below him in each ranker’s preferences. The Borda aggregation is the descending order arrangement of the average Borda score for each candidate averaged across all ranker preferences. Though Borda aggregation satisfies neutrality, monotonicity, and consistency, it does not satisfy the Condorcet
Criterion [13] and ECC. In fact, it has been shown that no method that assigns weights to each position and then sorts the results by applying a function to the weights associated with each candidate satisfies the Extended Condorcet Criterion [14]. This includes point-wise classifiers like logistic regression. This motivates us to consider orderbased methods for rank aggregation that do satisfy ECC. Kemeny Aggregation: A Kemeny optimal aggregation [8] is an aggregation that has the minimum number of pairwise disagreements with all rankers, i.e., a choice of τ r P k(τ, τi ); where the that minimizes K(τ, τ1 , ..., τr ) = 1r i=1
function k(σ, τ ) is the Kendall tau distance measured as |{(i, j)|i < j, σ(i) > σ(j), but τ (i) c in τ . Let (d, c) be a closest such pair in τ . Consider the immediate successor of d ∈ τ , and call it e. If e = c then c is adjacent to d ∈ τ and transposing this adjacent pair of elements produces a τ + such that K(τ + , τ1 , ..., τr ) < K(τ, τ1 , ..., τr ), contradicting Lemma 4.1 that τ is a locally Kemeny optimal aggregation of the τ1 , τ2 , ..., τr . If e does not equal c, then either e is in T , in which case the pair (d, e) is a closer pair in τ than (d, c) and also violates the Extended Condorcet Criterion, or e is in U , in which case (e, c) is a closer pair than (d, c) that violates the Extended Condorcet Criterion. Both cases
Algorithm 1 Supervised Kemeny Ranking (SKR) Input: τi = [τi1 , ..., τim ], ∀i = 1, ..., r, ordered arrangement of m candidates for r rankers. w = [w1 , ..., wr ] – where wi is the weight of ranker i µ = [µ1 , ..., µm ] – initial ordered arrangement of m candidates k – the number candidates to consider in each ranker’s preference list (k ≤ m) Output: τ – rank aggregated arrangement of candidates in decreasing order of importance 1) Initialize majority table Mi,j ⇐ 0, ∀i, j = 1, ..., m 2) For each ranker p = 1 to r 3) For each candidate i = 1 to k-1 4) For each candidate j = i + 1 to k 5) Mτpi ,τpj ⇐ Mτpi ,τpj + wp 6) Quick sort µ, using Mµi ,µj . If Mµi ,µj − Mµj ,µi > 0 then µi is greater than µj . If Mµi ,µj − Mµj ,µi = 0 then µi is equal to µj . If Mµi ,µj − Mµj ,µi < 0 then µi is less than µj . 7) Return τ
contradict the choice of (d, c). � The pseudo-code for Supervised Kemeny Ranking is presented in Algo. 1. In order to accommodate supervision, we extend Approximate Kemeny aggregation to incorporate weights associated with each input ranking. The weights correspond to the relative utility of each ranker, which may depend on the task at hand. For the task of influence prediction in Twitter, we weigh each ranker based on its (normalized) AUC computed on a training set of candidates, for which we know the target variable i.e., the true retweet rates. When evaluating on Average Precision, we use weights based on Average Precision instead. For Supervised Kemeny Ranking we incorporate weights directly in sorting the elements through Quick Sort. Instead of comparing candidates based on the preference of the simple majority of individual rankers, we use a weighted majority. This can be achieved simply by using weighted votes during the creation of the majority table M – which represents the sum of weights of the rankers who prefer the row candidate to the column candidate for each pairwise comparison. Instead of using total orderings provided by each ranker, we can also use partial orderings (for a subset of candidates). Since identifying relevant candidates at the top of the list is usually more important, we use the partial orderings corresponding to the top k candidates for each ranker. In our experiments, unless otherwise specified, we use the top-ranked 15% of candidates for each ranker. V. Empirical Evaluation We compared Supervised Kemeny Ranking to using individual rankings, logistic regression using all input rank scores as features, Local Kemenization [14], Borda aggregation, and a supervised version of Borda aggregation. We also compared to SVMRank [17], which is a supervised approach that tries to optimize performance on AUC.
For Supervised Borda, we incorporate performancebased (AUC/AP) weights in Borda aggregation. This is relatively straightforward, where instead of simple averages, we take weighted averages of Borda scores. A similar approach to supervised Borda was used in [18], where weights were based on average precision of each ranker for a meta-search task. While, supervised versions of Borda appear in prior work, to our knowledge, we present the first supervised version of Kemeny aggregation.4 In order to verify the effectiveness of each component of Supervised Kemeny Ranking, we performed several ablation studies. In particular, we compared Supervised Kemeny Ranking to the following variations of Algo. 1: • Unsupervised, Total Orderings: Using uniform weights (wi = 1, ∀i), and k = |S|, which reduces to the unsupervised approximation to Kemeny aggregation on total orderings. • Supervised, Total Orderings: k = |S|, i.e., Supervised Kemeny Ranking on total orderings. • Unsupervised, Partial Orderings: Using uniform weights (wi = 1, ∀i). • Supervised, Bubble Sort: Using Bubble Sort instead of Quick Sort in Step 6. This can be viewed as a supervised version of Local Kemenization [14]. A. Twitter Network Study: We compared our approach, Supervised Kemeny Ranking, to the different supervised and unsupervised techniques described above on the task of predicting viral potential, as in Sec. II. As inputs to each aggregation method we use the 13 different measures listed in Table I. Each measure is used to produce a total ordering of preferences over the 9,625 candidates (twitter users), where ties are broken randomly. We compared the 10 aggregation methods (see Table II) to individual rankers, but in the interest of space we only list the best individual measure (Past Retweets) in the table. We averaged performance, measured by AUC and Average Precision@100, over 10 runs of random stratified train-test splits for different amounts of data used for training. These results are summarized in Tables II and III. We note that, in terms of AUC, in general, aggregation techniques perform better than using Past Retweets, which is the best individual ranker. However, apart from Supervised Kemeny Ranking, this is not always the case for Average Precision. So one must use rank aggregation with caution, depending on the desired performance metric. The results also show that our version of Supervised Borda performs better than traditional Borda aggregation. However, Local Kemenization, outperforms Supervised Borda, showing the benefit of Kemeny-based aggregation versus Borda’s score-based aggregation. Our approach, of Supervised Ke4A
very preliminary version of our work appears in [19]
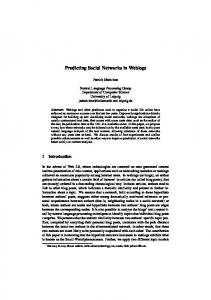
meny Ranking, further improves on this result, with the best performance at all points in terms of Average Precision, and 3 of 4 points in terms of AUC. Logistic Regression is a little better than Supervised Kemeny Ranking at one point in terms of AUC. However, overall logistic regression is less effective than the other aggregation methods, occasionally performing worse than the best individual ranker. Supervised Kemeny Ranking, also outperforms SVMRank, consistently on all training sample sizes, in both AUC and AP.5 Our ablations studies show that every component of Supervised Kemeny Ranking does contribute to its superior performance. In particular, we see that supervised variants of Algo. 1 perform better than unsupervised variants. Also, focusing on the top k elements from each individual ranker (partial orderings) is more effective that using total orderings. Finally, using the Quick Sort approximation to Kemeny aggregation makes a notable difference over using Bubble Sort. As mentioned earlier, the Bubble Sort variation, as used by Dwork et al. [14] comes with no approximation guarantees, which makes a perceptible difference in practice. In addition to using AUC-based weights for Supervised Kemeny Ranking, we also experimented with alternative weighting schemes in Algo. 1, such as, (AU C − 0.5) and (log(AU C/(1 − AU C))). However, in experiments (not presented) the simple AUC based weights outperformed other weighting schemes by a margin of 2 − 5%. Learning curves comparing our approach to existing baselines are presented in Fig. 1. We observe that, while logistic regression performs well with ground truth on a large number of candidates, its performance drops significantly with lower levels of supervision. In contrast, the rank aggregation methods are fairly stable, consistently beating the best individual ranking and performing better than logistic regression in the more realistic setting of moderatelysized training sets. The consistently good performance of Supervised Kemeny Ranking confirms the advantages of supervised locally optimal order-based ranking compared to score-based aggregation, such as Borda, and unsupervised methods. While Fig. 1 shows the performance in terms of area under the ROC curve for different sample sizes, in Fig. 2 we present the ROC curves for a single point (1,920 training samples). We contrast Supervised Kemeny Ranking, with the methods most commonly used in practice, namely, number of followers and follower PageRank (e.g., as done by Twitaholic.com and Tunrank.com). Note that, all other baselines in this paper are devised by us, and are much better than these approaches. We observe that Supervised 5 Note that, while some absolute differences may appear small, a relative improvement of 1% is considered to be substantial in ranking domains such as web search (see Fig. 1 of [20]).
90
AUC %
85
80
Borda Logistic Regression Past Retweets Local Kemninization Supervised Kemeny Ranking
75
70 200
400
600
800
1000 1200 1400 Training Sample Size
1600
1800
Training Samples 960
Ranking Method
320
480
Supervised Kemeny Ranking Past Retweets logistic regression Borda Supervised Borda Local Keminization SVM Rank
92.97 89.47 46.87 91.02 91.50 92.03 87.98
92.52 88.86 70.92 90.78 91.09 91.68 89.33
93.28 89.73 87.02 90.95 91.22 91.78 92.15
93.00 90.20 93.26 91.14 91.62 92.11 92.79
Unsupervised, Total Orderings Supervised, Total Orderings Unsupervised, Partial Orderings Supervised, Bubble Sort
88.49 88.89 92.73 92.23
88.29 88.36 92.42 91.88
89.91 89.92 92.72 92.03
89.35 89.51 92.58 92.27
Kemeny Ranking performs 5 to 8% better in terms of AUC and 54 to 55% better in terms of AP compared to current practice. 1 0.9
True positive rate
0.8 0.7 0.6 0.5 0.4 0.3 Supervised Kemeny Ranking Follower PageRank Followers
0 0
0.2
0.4
0.6
0.8
1
False positive rate
Fig. 2. ROC curves comparing Supervised Kemeny Ranking to popular measures in practice.
B. Citation Network Study: In addition to Twitter data, we also performed a case study on publication citation networks. For this we used a collection of papers with their citations that was used in the KDD Cup contest held in 2003.6 This data consists of 1,716 papers in the field of High Energy Physics Theory (hep-th), published on arXiv.org during a 6 month period. The data set also contains the number of times each paper was downloaded during the 60 day period after it was published on arXiv.org. This download information gives us an extrinsic proxy 6 http://www.cs.cornell.edu/projects/kddcup/
480
Supervised Kemeny Ranking Past Retweets logistic regression Borda Supervised Borda Local Keminization SVM Rank
0.7242 0.7210 0.3255 0.2600 0.3000 0.5240 0.1732
0.6837 0.6610 0.4862 0.2600 0.2733 0.4938 0.3180
0.6991 0.6766 0.6662 0.2333 0.2366 0.4768 0.3990
1920 0.6783 0.6668 0.6219 0.2133 0.2334 0.4891 0.3996
Unsupervised, Total Orderings Supervised, Total Orderings Unsupervised, Partial Orderings Supervised, Bubble Sort
0.6982 0.6994 0.7018 0.5273
0.5998 0.6024 0.6622 0.4963
0.6706 0.6826 0.6745 0.4772
0.6357 0.6521 0.6619 0.4930
TABLE III R ANK AGGREGATION PERFORMANCE MEASURED IN AVERAGE P RECISION @100 FOR VARIOUS TRAINING SET SIZES .
1920
TABLE II R ANK AGGREGATION PERFORMANCE MEASURED IN AUC(%) FOR VARIOUS TRAINING SET SIZES .
0.1
320
2000
Fig. 1. AUC performance of rank aggregation techniques with increasing training data.
0.2
Training Samples 960
Ranking Method
for the influence of a paper. As such, we define the task of predicting highly influential papers, as measured by downloads, based on the citation data of the papers. If a paper received 600 or more downloads, we consider it as a high-influence paper (77 papers); else we consider it to have little or no influence. First, we constructed a citation graph based on all publications in hep-th, which was also provided as part of KDD Cup 2003. In this citation graph, each node represents a paper and each edge represents a citation. As of May 1, 2003, there were 29,014 papers and 342,427 citations in total in the hep-th data. Next, for each of the 1,716 papers with download information, we used this citation graph to compute 5 influence measures - Indegree, Outdegree, Pagerank, Hub and Authority score [21]. We ran experiments as before, using 20% of the data (343 papers) for training the supervised methods, and setting k to 1,200 in Algo. 1. The results in terms of AUC and Average Precision for each method are presented in Table IV. As expected, the number of papers citing a given paper (in-degree) is a good indicator of how often the paper will be downloaded. Furthermore, having more citations from highly-cited papers, as captured by PageRank is a better indicator of influence in this data. Note that, this was not the case in predicting viral potential in Twitter. The number of papers a paper is citing (out-degree) and Hub-score have some, though weaker, ability to predict influence. This is probably because some survey papers do become influential if they refer to many good papers in that area. In this study we find that not all aggregation techniques are better than using individual rankers. In particular, high in-degree is very correlated with high download rates, as reflected by Average Precision. So depending on the data and the evaluation metrics, one should always consider using the best individual ranker along with alternative aggregation methods. Nevertheless, in terms of AUC, Supervised Kemeny Ranking still produces the best ranking, outperforming individual rankers and other aggregation techniques. The results on the ablation studies are similar
Measure
AUC %
AP
PageRank Indegree Authority Outdegree Hub
81.09 80.42 80.39 64.33 61.07
0.4470 0.5376 0.5324 0.2820 0.2867
Supervised Kemeny Ranking logistic regression Borda Supervised Borda Local Keminization SVMRank
81.70 76.02 77.47 78.27 76.62 77.59
0.4950 0.5330 0.2363 0.2787 0.3668 0.4625
Unsupervised, Total Orderings Supervised, Total Orderings Unsupervised, Partial Orderings Supervised, Bubble Sort
80.12 80.30 80.23 79.17
0.3518 0.4902 0.4928 0.4798
TABLE IV C OMPARING RANKING METHODS FOR IDENTIFYING INFLUENTIAL PAPERS , BASED ON AUC AND AVERAGE P RECISION @60.
to before, further corroborating the contribution of each component of the Supervised Kemeny Ranking algorithm. VI. Related work An associated growing area of research attempts to explain content and link structures in social media, together with their temporal evolution, based on tensor factorizations and higher order extensions of techniques such as Singular Value Decomposition (SVD) [22], [23]. Recently, Weng et al. [24] propose TwitterRank, a variant of PageRank that also takes topical similarity between users into account. Another interesting approach to quantitatively evaluating the ranking of blogs is through the task of cascade detection - selecting a set of blogs to read which link to most of the stories that propagate over the blogosphere. Current solutions [25], [26] to this task do not attempt to address the task of assigning an influence score to individual bloggers, since they are focused on optimal set selection. However, there is a lot of potential for using such approaches to identify influencers. In related work on rank aggregation, Liu et al. [27] present an alternative supervised approach for the task of web-search – where they build on a Markov Chain (MC) based approach to rank aggregation. However, it has been shown that Local Kemenization improves on MC-based approaches [14], which in turn, we show is outperformed by Supervised Kemeny Ranking. In concurrent work on the analysis of Twitter, Cha et al. [28] also conclude that number of followers alone reveals little about a user’s influence. We go further in our work, by comparing many more socio-metrics on different tasks, and providing approaches to improve influence prediction through rank aggregation. In recent work, Suh et al. [29] analyze factors that correlate with retweeting. While they consider in- and out-degrees of the follower graph, they do not look at other graphs, such as the retweet graph, or other socio-metrics, such as PageRank. Furthermore, since their study only uses randomly sampled tweets, they
are limited to a very small subset of retweets. In contrast, we collect all retweets for all users in our study. In addition to SVMRank, there have been several recent advances in learning to rank [30], [31], driven largely by the application to web search. All of these approaches produce a ranked list as an output. In their seminal work, Dwork et al. [14], showed how rank aggregation can be used to improve on meta-search, by combining individual search rankings. Since, we demonstrate that Supervised Kemeny Ranking performs better than their Local Kemenization approach, we are hopeful that it can be used to aggregate the rankings from different learning to rank methods, to improve results on web search and other applications. In recent work, Ghosh and Lerman [32] evaluate various influence models based on geodesic-path based distance measures and topological ranking measures. They propose a Normalized α-centrality algorithm and evaluate its effectiveness on measuring influential users in Digg.com. Their work aims to find the best individual socio-metric and does not intend to improve the predictive accuracy by combining various influence models. However, as we have shown in this paper, often individual socio-metrics fail to capture all critical factors that are relevant for predicting influence in networks. Presumably, one could use the Normalized α-centrality algorithm as another input ranker to Supervised Kemeny Ranking, to further improve predictive performance. The work by Agarwal et al. [33] does a empirical study on identifying influential people in blog networks. They propose 4 main features that produce influence in the bloggers network, based on recognition, activity, novelty, and eloquence. They weigh these four features to produce a combined score for each blogger. In [34], Sayyadi and Getoor predict the popularity of a paper using its expected future citations. They propose F utureRank, which combines the PageRank score of a paper in the citation network, the authority score in the authorship network, and the recency of the publication. Both [33] and [34] propose a score-based model, where they combine the scores from a set of features defined on the underlying network data. Note that, neither of the methods are supervised and they require further enhancements to accommodate such supervision. In addition, their methods are score-based aggregations, and not order-based. Both Dwork et al. [14] and this paper shows clearly the inefficiency of weighted combination of score-based algorithms compared to order-based. VII. Conclusion and Future Work Understanding influence within blog and micro-blog networks has become a crucial technical problem with increasing relevance to marketing and information retrieval. We address the problem of assessing influence by casting
it in the form of a predictive task; which allows us to objectively compare different measures of influence in light of standard classification and ranking metrics. Furthermore, we propose a novel supervised rank aggregation method, which combines aspects of different influence measures to produce a composite ranking mechanism that is most effective for the desired task. We have applied this approach to a case study involving 40 million twitter accounts, and have examined the task of predicting the potential for viral out-breaks. We further corroborated these results on the task of identifying influential papers based on citation networks. Empirical results show that our proposed approach, Supervised Kemeny Ranking, performs better than several existing rank aggregation techniques, as well as other supervised learning benchmarks. The problem of choosing the optimal Kemeny order can be formulated as a mixed-integer programming problem as discussed in [35]. However, the problem of finding the optimal weights for Supervised Kemeny Ranking is much more difficult, as it involves a quadratic objective function, with two sets of variables; one for selecting the optimal weights and one for the optimal order. An efficient algorithm to solve this optimization could significantly improve results, and is a promising direction for future work. Acknowledgements We would like to thank Estepan Meliksetian for the help in gathering the Twitter data set. We are also grateful to Claudia Perlich, Richard Lawrence and Andrew Davenport for their suggestions and comments on this work. References [1] E. Bakshy, B. Karrer, and L. Adamic, “Social influence and the diffusion of user-created content,” in ACM EC, 2009. [2] M. Goetz, J. Leskovec, M. Mcglohon, and C. Faloutsos, “Modeling Blog Dynamics,” in ICWSM, 2009. [3] G. Kossinets, J. Kleinberg, and D. Watts, “The structure of information pathways in a social communication network,” in KDD, 2008. [4] J. Moreno, Who Shall Survive? Foundations of Sociometry, Group Psychotherapy and Sociodrama. Nervous and Mental Disease Publishing Co., 1934. [5] D. Knoke and R. Burt, Applied Network Analysis. Newbury Park, CA: Sage, 1983, ch. Prominence. [6] S. Wasserman and K. Faust, Social Network Analysis: Methods & Applications. Cambridge, UK: Cambridge University Press, 1994. [7] J. Borda, “Memoire sur les elections au scrutin,” in Histoire de l’Academie Royale des Sciences, 1781. [8] J. Kemeny, “Mathematics without numbers,” in Daedalus, vol. 88, 1959, pp. 571–591. [9] T. Fawcett, “An introduction to roc analysis,” in Pattern Recognition Letters, vol. 27, 2006, pp. 861–874. [10] R. Baeza-Yates and B. Ribeiro-Neto, “Modern information retrieval.” Addison Wesley Co, 1999.
[11] K. Arrow, “Social choice and individual values.” New Haven: Cowles Foundation, 2nd Edition 1963. [12] M. Truchon, “An extension of the condorcet criterion and kemeny orders,” in J. Eco. Lit., 1998. [13] H. Young and A. Levenglick, “A consistent extension of condorcet’s election principle,” in SIAM J. on App. Math, vol. 35(2), 1978. [14] C. Dwork, R. Kumar, R. Naor, and D. Sivakumar, “Rank aggregation methods for the web,” in WWW, 2001. [15] F. Schalekamp and A. van Zuylen, “Rank aggregation: Together we’re strong,” in ALENEX, 2009, pp. 38–51. [16] N. Ailon, M. Charikar, and A. Newman, “Aggregating inconsistent information: Ranking and clustering,” J. ACM, vol. 55, no. 5, 2008. [17] T. Joachims, “Training linear svms in linear time,” in KDD, 2006. [18] J. A. Aslam and M. Montague, “Models for metasearch,” in SIGIR, 2001. [19] P. Melville, K. Subbian, C. Perlich, R. Lawrence, and E. Meliksetian, “A predictive perspective on measures of influence in networks,” in Proceedings of the Workshop on Information in Networks, 2010. [20] Z. Zheng, H. Zha, T. Zhang, O. Chapelle, K. Chen, and G. Sun, “A general boosting method and its application to learning ranking functions for web search,” in NIPS, 2007. [21] J. Kleinberg, “Authoritative sources in a hyperlinked environment,” in J. ACM, 1999. [22] T. Kolda and B. Bader, “The TOPHITS model for higherorder web link analysis,” in SDM Workshop on Link Analysis, Counterterrorism and Security, 2006. [23] Y. Chi, S. Zhu, X. Song, J. Tatemura, and B. Tseng, “Structural and temporal analysis of the blogosphere through community factorization,” in KDD, 2007. [24] J. Weng, E.-P. Lim, J. Jiang, and Q. He, “TwitterRank: Finding topic-sensitive influential Twitterers,” in WSDM, 2010. [25] J. Leskovec, A. Krause, C. Guestrin, C. Faloutsos, J. Vanbriesen, and N. Glance, “A Cost-effective outbreak detection in networks,” KDD, 2007. [26] D. Kempe, J. Kleinberg, and E. Tardos, “Maximizing the spread of influence through a social network,” in KDD, 2003. [27] Y.-T. Liu, T.-Y. Liu, T. Qin, and H. Li, “Supervised rank aggregation,” in WWW, 2007. [28] M. Cha, H. Haddadi, F. Benevenuto, and K. Gummadi, “Measuring user influence in twitter: The million follower fallacy,” in ICWSM, 2010. [29] B. Suh, L. Hong, P. Pirolli, and E. H. Chi, “Want to be retweeted? large scale analytics on factors impacting retweet in twitter network,” in SocialCom, 2010. [30] Y. Freund, R. Iyer, R. Schapire, and Y. Singer, “An efficient boosting algorithm for combining preferences,” in JMLR, 2003. [31] C. J. C. Burges, K. M. Svore, P. N. Bennett, A. Pastusiak, and Q. Wu, “Learning to rank using an ensemble of lambdagradient models,” in JMLR, 2011, pp. 253–35. [32] R. Ghosh and K. Lerman, “Predicting influential users in online social networks,” in SNA-KDD, 2010. [33] N. Agarwal, H. Liu, L. Tang, and P. S. Yu, “Identifying the influential bloggers in a community,” in WSDM, 2008. [34] H. Sayyadi and L. Getoor, “Futurerank: Ranking scientific articles by predicting their future pagerank,” in SDM, 2009. [35] V. Conitzer, A. J. Davenport, and J. Kalagnanam, “Improved bounds for computing kemeny rankings,” in AAAI, 2006.