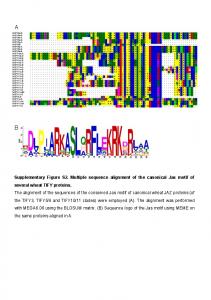
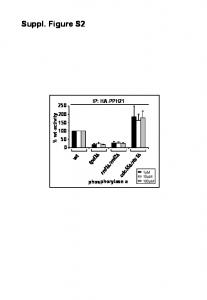
Supplementary Figure S2. Multiple sequence alignment of the canonical Jas motif of several wheat TIFY proteins. The alignment of the sequences of the ...
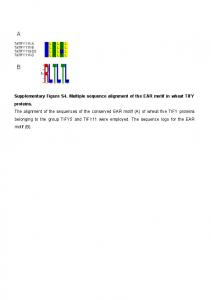
Supplementary Figure S4. Multiple sequence alignment of the EAR motif in wheat TIFY proteins. The alignment of the sequences of the conserved EAR motif (A) ...
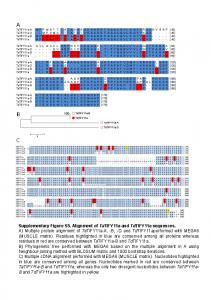
Supplementary Figure S5. Alignment of TaTIFY11a and TdTIFY11a sequences. A) Multiple protein alignment of TaTIFY11a-A, -B, -D and TdTIFY11aperformed ...
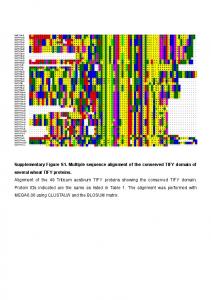
Supplementary Figure S1. Multiple sequence alignment of the conserved TIFY domain of several wheat TIFY proteins. Alignment of the 49 Triticum aestivum ...
Call & Utpal Banerjee. Supplementary figures and text: Supplementary Figure 1. Full schematic depicting the G-TRACE analysis system. Supplementary Figure ...
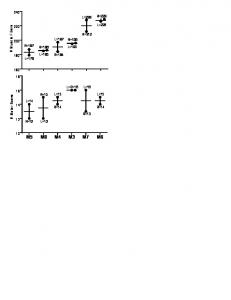
R=184. L=195. R=196. L=228. R=212. L=226. R=229. #. M u s c le. F ib e rs. 10. 12. 14. 16. 18. L=14. R=12. L=12. R=15. L=15. R=14. L=R=16 L=16. R=13.
Page 1. Relative level of WASP mRNA expression. Primary (n=37). P
NAc/dose effect of CHX. % Ch an g e fro. m b aselin e (= salin e ) sal. CHX12.5. CHX 25. CHX 50. 0. 50. 100. 150. A. C. *. *. NAc. % Ch an g e fro. m b aselin.
Tumor 05 A. Chr. Position. PB5 f chr11. 41573884. 23.2% intergenic chr18. 16209166. 17.4% intergenic chr1. 87855454. 9.1% Dgkd chr8. 38677940.
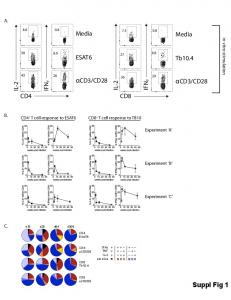
d28 d84 d308. IL-2. TNF. IFNγ pie slice. Suppl Fig 1. C. A. Experiment 'A'. Experiment 'B'. Experiment 'C'. CD4+ T cell response to ESAT6. CD8+ T cell response ...
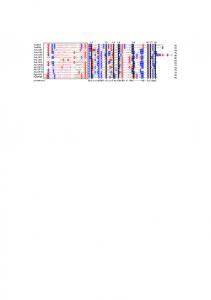
Supplementary Figure S3. Multiple sequence alignment of the CCT motif and GATA domain of several wheat TIFY proteins. The alignment of the sequences of ...
A
B
C
D
Supplementary Figure S3. Multiple sequence alignment of the CCT motif and GATA domain of several wheat TIFY proteins. The alignment of the sequences of the conserved CCT motif (A) and GATA domain (C) of wheat TIFY proteins belonging to the group TIFY1/2 were employed. The sequence logo for the CCT motif (B) and GATA domain (D) were generated with MEME.