Supplemental Materials to: Algorithmic requirements for swarm intelligence in differently coupled collective systems J¨ urgen Stradnera , Ronald Theniusa , Payam Zahadata , Heiko Hamanna , Karl Crailsheima , Thomas Schmickla Artificial Life Laboratory at the Department of Zoology Karl-Franzens University Graz, Universit¨ atsplatz 2, A-8010 Graz, Austria a
Email address:
[email protected] (Thomas Schmickl) Preprint submitted to Chaos, Solitons & Fractals
December 2, 2012
1. Supplemental Materials A In Sec. 3.1 of the paper an algorithm called artificial homeostatic hormone system (AHHS) is described. It is implemented on robotic systems with static couplings. Experiments are described in which this algorithm performs on different topologies of the robot organism. Whereas Fig. 4 of the paper presents exemplary graphs of the resulting dynamics, here Fig. 1 to Fig. 8 present all runs with 30 random initialized AHHSs for all four shapes with all four input situations. In contrast to Fig. 4 of the paper, here only every 8th point of the time line is drawn. A second aspect to improve the clearness of the presentation of multiple runs only 15 random initialized AHHSs are plotted in each figure. Thus, two figures for each topology are needed to present all 30 runs. These two figures are shown on two consecutive pages for each topology, respectively.
2
shape
mod0
mod6
mod0
mod6
mod0
mod0
mod6
mod6
mod0, S0 value
1
mod0, H0 conc.
0 1
mod6, H0 conc.
0 1
mod6, A0 value
0 1
−1 0
time 3000
0
0
time 3000
time 3000
0
time 3000
Figure 1: I-shape (1): Dynamics of the sensor value (first row), hormone concentrations of the hormone 0 in module 0 and module 6 (second and third row, respectively) and the actuator value (last row) over 3000 time steps (every eigth step is plotted). 60 runs for an I-shaped organism with the first 15 randomly initialized AHHSs for each input type are shown. Modules 0 and 6 are marked red in the schematic shape to stress the positions of sensor input (module 0) and actuator’s readout position (module 6).
3
shape
mod0
mod6
mod0
mod6
mod0
mod0
mod6
mod6
mod0, S0 value
1
mod0, H0 conc.
0 1
mod6, H0 conc.
0 1
mod6, A0 value
0 1
−1 0
time 3000
0
0
time 3000
time 3000
0
time 3000
Figure 2: I-shape (2): Dynamics of the sensor value (first row), hormone concentrations of the hormone 0 in module 0 and module 6 (second and third row, respectively) and the actuator value (last row) over 3000 time steps (every 8th step is plotted). 60 runs for an I-shaped organism with the second 15 randomly initialized AHHSs for each input type are shown. Modules 0 and 6 are marked red in the schematic shape to stress the positions of sensor input (module 0) and actuator’s readout position (module 6).
4
shape
mod0
mod0
mod6
mod0
mod6
mod0
mod6
mod6
mod0, S0 value
1
mod0, H0 conc.
0 1
mod6, H0 conc.
0 1
mod6, A0 value
0 1
−1 0
time 3000
0
time 3000
0
time 3000
0
time 3000
Figure 3: T-shape (1): Dynamics of the sensor value (first row), hormone concentrations of the hormone 0 in module 0 and module 6 (second and third row, respectively) and the actuator value (last row) over 3000 time steps (every 8th step is plotted). 60 runs for an T-shaped organism with the first 15 randomly initialized AHHSs for each input type are shown. Modules 0 and 6 are marked red in the schematic shape to stress the positions of sensor input (module 0) and actuator’s readout position (module 6).
5
shape
mod0
mod0
mod6
mod0
mod6
mod0
mod6
mod6
mod0, S0 value
1
mod0, H0 conc.
0 1
mod6, H0 conc.
0 1
mod6, A0 value
0 1
−1 0
time 3000
0
time 3000
0
time 3000
0
time 3000
Figure 4: T-shape (2): Dynamics of the sensor value (first row), hormone concentrations of the hormone 0 in module 0 and module 6 (second and third row, respectively) and the actuator value (last row) over 3000 time steps (every 8th step is plotted). 60 runs for an T-shaped organism with the second 15 randomly initialized AHHSs for each input type are shown. Modules 0 and 6 are marked red in the schematic shape to stress the positions of sensor input (module 0) and actuator’s readout position (module 6).
6
shape
mod0
mod0
mod6
mod6
mod0
mod6
mod0
mod6
mod0, S0 value
1
mod0, H0 conc.
0 1
mod6, H0 conc.
0 1
mod6, A0 value
0 1
−1 0
time 3000
0
time 3000
0
time 3000
0
time 3000
Figure 5: X-shape (1): Dynamics of the sensor value (first row), hormone concentrations of the hormone 0 in module 0 and module 6 (second and third row, respectively) and the actuator value (last row) over 3000 time steps (every 8th step is plotted). 60 runs for an X-shaped organism with first 15 randomly initialized AHHSs for each input type are shown. Modules 0 and 6 are marked red in the schematic shape to stress the positions of sensor input (module 0) and actuator’s readout position (module 6).
7
shape
mod0
mod0
mod6
mod6
mod0
mod6
mod0
mod6
mod0, S0 value
1
mod0, H0 conc.
0 1
mod6, H0 conc.
0 1
mod6, A0 value
0 1
−1 0
time 3000
0
time 3000
0
time 3000
0
time 3000
Figure 6: X-shape (2): Dynamics of the sensor value (first row), hormone concentrations of the hormone 0 in module 0 and module 6 (second and third row, respectively) and the actuator value (last row) over 3000 time steps (every 8th step is plotted). 60 runs for an X-shaped organism with the second 15 randomly initialized AHHSs for each input type are shown. Modules 0 and 6 are marked red in the schematic shape to stress the positions of sensor input (module 0) and actuator’s readout position (module 6).
8
mod0
shape
mod0
mod0 mod6
mod6
mod0 mod6
mod6
mod0, S0 value
1
mod0, H0 conc.
0 1
mod6, H0 conc.
0 1
mod6, A0 value
0 1
−1 0
time 3000
0
0
time 3000
time 3000
0
time 3000
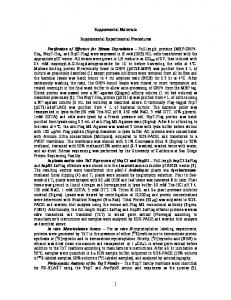
Figure 7: H-shape (1): Dynamics of the sensor value (first row), hormone concentrations of the hormone 0 in module 0 and module 6 (second and third row, respectively) and the actuator value (last row) over 3000 time steps (every 8th step is plotted). 60 runs for an H-shaped organism with first 15 randomly initialized AHHSs for each input type are shown. Modules 0 and 6 are marked red in the schematic shape to stress the positions of sensor input (module 0) and actuator’s readout position (module 6).
9
mod0
shape
mod0
mod0 mod6
mod6
mod0 mod6
mod6
mod0, S0 value
1
mod0, H0 conc.
0 1
mod6, H0 conc.
0 1
mod6, A0 value
0 1
−1 0
time 3000
0
time 3000
0
time 3000
0
time 3000
Figure 8: H-shape (2): Dynamics of the sensor value (first row), hormone concentrations of the hormone 0 in module 0 and module 6 (second and third row, respectively) and the actuator value (last row) over 3000 time steps (every 8th step is plotted). 60 runs for an H-shaped organism with the second 15 randomly initialized AHHSs for each input type are shown. Modules 0 and 6 are marked red in the schematic shape to stress the positions of sensor input (module 0) and actuator’s readout position (module 6).
10