Supplementary Information Image-based computational quantification and visualization of genetic alterations and tumour heterogeneity Qing Zhong1#, Jan H Rüschoff1#, Tiannan Guo2, Maria Gabrani3, Peter J Schüffler4, Markus Rechsteiner1, Yansheng Liu2, Thomas J Fuchs5, Niels J Rupp1, Christian Fankhauser1, Joachim M Buhmann2, Sven Perner6, Cédric Poyet7, Miriam Blattner8, Davide Soldini1, Holger Moch1, Mark A Rubin8, Aurelia Noske1, Josef Rüschoff9, Michael C Haffner10, Wolfram Jochum11, Peter J Wild1* 1Institute of Surgical Pathology, University Hospital Zurich, Zurich, Switzerland. 2Institute of Molecular Systems Biology, ETH, Zurich, Switzerland.
3Zurich Labouratory, IBM Research-Zurich, Rueschlikon, Switzerland. 4Department of Computer Science, ETH, Zurich, Switzerland.
5Memorial Sloan Kettering Cancer Center, New York, NY, USA. 6Department of Prostate Cancer Research, Institute of Pathology, University Hospital
of Bonn, Bonn, Germany. 7 Department of Urology, University Hospital Zurich, Zurich, Switzerland. 8Institute for Precision Medicine and Department of Pathology and Laboratory Medicine, Weill Medical College of Cornell University and New York-Presbyterian Hospital, New York, NY, USA. 9Targos Molecular Pathology, Pathology Nordhessen, Kassel, Germany. 10Sidney Kimmel Comprehensive Cancer Center, Johns Hopkins University, Baltimore, Maryland, USA. 11Institute of Pathology, Cantonal Hospital St. Gallen, St. Gallen, Switzerland. *To whom correspondence should be addressed:
[email protected]. #
These authors contributed equally to this work.
Table of Contents Supplementary Methods
Page 1 – 2
Supplementary Figures 1 – 13
Page 3 – 15
Supplementary Tables 1 – 3
Page 16 – 18
1
Supplementary Methods For the circular Hough transform, the signal radius were defined empirically from 1 to 7 pixels according to domain knowledge and the edge gradient threshold was set to Matlab default (Otsu’s method). The detection sensitivity was set to Matlab default (0.85) for tissues scanned by the Zeiss scanner and was set to 0.95 for tissues digitized by the Hamamatsu scanner, because the Zeiss scanner has a higher scanning resolution and a more advanced image sensor. The SVM model was trained and validated (5-fold cross validation and grid search that iterates overall all pairs of C and γ) on an independent image set from a single tissue spot with two sets of expert annotations (one for the HER2 and the other for the remaining genes), consisting of 1000 image patches of size 13 × 13 pixels with PTEN, CEP10, PTEN +CEP10, white (background noise) and blue (cell stains) signals in the center of the patch (fig. S6). The feature vector was constructed by concatenating (13 × 13 = 169) RGB values. For reduction of misclassified signals, only gene and corresponding CEP signals were used for subsequent calculation. Signals classified as white or blue were discarded. The maximum of the global ratio was set to three to circumvent false positive gene signals due to unspecific staining (any roundish black signals) for cases with gene deletion. For prostate and ovarian cancers, each whole slide image was tiled into sub-images, in which we used the same parameter settings as the TMA for the circular Hough transform and the SVM model to detect and classify gene and CEP signals. A signal colormap was then drawn for each sub-image. By merging signal colormaps of all sub-images, the complete signal colormap of the whole slide was generated. A three-dimensional bar graph was plotted for visualizing intra-tumor heterogeneity, where each bar represents a sub-image. The same workflow of the ISHProfiler was also applied to a whole slide of a gastric cancer tissue stained with DISH probes for HER2 /CEP17. To re-calibrate the molecular signal intensities of HER2 /CEP17, we used a different expert annotation of the same training data for SVM training and cross-validation.
2
Algorithm: An image-based computational workflow: ISHProfiler input : A digital image: I (tissue core or whole slide), Radius range: radiusRange, Detection sensitivity: sensitivity, Neighborhood distance: radius, K random points: P := {pk }K k=1 , A trained and validated SVM. output: The global ratio, randomized local ratio (RLR), randomized local density (RLD), and a signal colormap. 1
Detect GENE and CEP signals by circular Hough transform: imfindcircles(I,radiusRange,sensitivity). Get positions of the detected signals.
2
Using the SVM to classify the detected signals into five classes and retain only three L M classes, GENE: G := {gn }N n=1 , CEP: C := {cm }m=1 and GENE+CEP: Z := {zl }l=1 , where gn denotes a single occurrence of the gene. N X
3
Return the global ratio =
n=1 M X m=1
gn + cm +
L X l=1 L X
zl . zl
l=1
4
Set the maximum global ratio for filtering false positive cases (optional).
5
Plot a signal colormap according to signal positions and colors in G, C and M .
6
11
foreach Random points pk do find the closest CEP point to pk : c∗k = arg minc ||c − pk ||, where || · || denotes the Euclidean distance. find all GENE and CEP signals Sk = {Gk ∨ Ck ∨ Zk } in the neighborhood, such that ||Sk − c∗k || < radius. k |+|Zk | Calculate the ratio of GENE to CEP: rk = |G in the neighborhood, where | · | |Ck |+|Zk | denotes the cardinality of a set. Calculate the total number of GENE and CEP: dk = |Gk | + |Ck | + |Zk | in the neighborhood. end
12
Save all rk , dk , k = 1, 2..., K.
7
8
9
10
13
Return the RLR :=
{rk }K k=1
and RLD :=
{dk }K k=1
as distributions,
1 K
K X
rk and
k=1 1 K
K X
dk as means, respectively.
k=1 14
Return a feature vector x = (x1 , x2 , ..., x6 ) ∈ R6 with six dimensions, representing the image I. The features x1 , x2 , x3 are the mean, median and the s.e.m. of the RLR, and x4 , x5 , x6 are the mean, median and the s.e.m. of the RLD.
3
Supplementary Figures Clinicopathological characteristics Gleason score
BMI
Age at diagnosis
pT P = 0.03
P = 0.315
P = 0.226
P = 0.015
8-10
pT4
7
pT3a-b
5-6
pT2a-c
> 25
≥ 64
≤ 25
< 64
0%
0%
20% 40% 60% 80% 100%
pN
0%
20% 40% 60% 80% 100%
Margin P = 0.58
P = 0.136
≥ 10
pN0
neg
< 10
20% 40% 60% 80% 100%
0%
20% 40% 60% 80% 100%
> 25
< 64
≤ 25
20% 40% 60% 80% 100%
7
pT3a-b
pT2a-c
0%
20% 40% 60% 80% 100%
P = 0.143
20% 40% 60% 80% 100%
0%
P = 0.134
P = 0.576
pos
≥ 10
pN0
neg
< 10
0%
ratio
20% 40% 60% 80% 100%
20% 40% 60% 80% 100%
Immunohistochemical data
Other characteristics
Cytoplasmic PTEN
Nuclear ERG 3+
2+
2+
1+
1+
neg
neg 20% 40% 60% 80% 100%
Cytoplasmic PTEN
P < 0.0001
3+
20% 40% 60% 80% 100%
Nuclear ERG
P = 0.003
P = 0.085
< 5%
pos
ERG F+
≥ 5%
neg
ERG F-
0%
20% 40% 60% 80% 100%
MIB1%
0%
20% 40% 60% 80% 100%
SPOP mutations
P=1
0%
20% 40% 60% 80% 100%
ERG b/a FISH
P=1
P = 0.121
3+
2+
< 5%
pos
ERG F+
≥ 5%
neg
ERG F-
2+
1+
1+
neg
neg 20% 40% 60% 80% 100%
0%
20% 40% 60% 80% 100%
0%
20% 40% 60% 80% 100%
0%
20% 40% 60% 80% 100%
0%
20% 40% 60% 80% 100%
ratio
0%
0%
ERG b/a FISH P=1
P = 0.626
% aberrant nuclei
3+
SPOP mutations
MIB1% P = 0.026
P < 0.0001
0%
20% 40% 60% 80% 100%
PSA at diagnosis
pN1
0%
P = 0.085 pT4
Margin
20% 40% 60% 80% 100%
pT P = 0.002
8-10
5-6
0%
pN
0%
20% 40% 60% 80% 100%
Gleason score P = 0.111
≥ 64
0%
0%
BMI P = 0.089
20% 40% 60% 80% 100%
% aberrant nuclei
pos
Age at diagnosis
0%
P = 0.313
pN1
0%
20% 40% 60% 80% 100%
PSA at diagnosis
% aberrant nuclei < 60% or ratio > 60% % aberrant nuclei ≥ 60% or ratio ≤ 60%
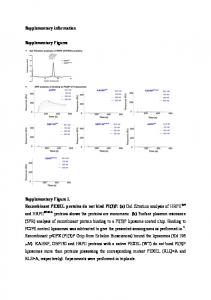
Supplementary Figure S1. Comparison between PTEN FISH percent aberrant nuclei and ratio for various features. Two-sided Fisher’s exact test or Pearson’s chi-squared test were used. P < 0.05 are marked in bold.
4
a
b 1.0
N= 236
0.2
0.2
N= 62
50
c
100 months
0.0
0.0
% abberant nuclei < 60% % abberant nuclei ≥ 60% P = 0.017 (41 missing observations)
0
150
PTEN FISH ratio
Overall survival 0.4 0.6 0.8
Overall survival 0.4 0.6 0.8
1.0
PTEN FISH % aberrant nuclei
N= 229 N= 69
ratio > 60% ratio ≤ 60% P = 0.003 (41 missing observations)
0
200
d
N= 62
e
100 months
150
Recurrence−free survival 0.2 0.4 0.6 0.8 1.0
100 months
150
200
N= 181 N= 40
ratio > 60% ratio ≤ 60% P = 0.387 (118 missing observations)
0.0
0.0
% abberant nuclei < 60% % abberant nuclei ≥ 60% P = 0.209 (118 missing observations)
150
50
PTEN FISH ratio
N= 37
100 months
ratio > 60% ratio ≤ 60% P = 0.005 (41 missing observations)
f
N= 184
50
200
N= 69
0
200
PTEN FISH % aberrant nuclei
0
150
N= 229
0.0
0.0
% abberant nuclei < 60% % abberant nuclei ≥ 60% P = 0.009 (41 missing observations)
Disease−specific survival 0.2 0.4 0.6 0.8 1.0
N= 236
50
100 months
PTEN FISH ratio
Recurrence−free survival 0.2 0.4 0.6 0.8 1.0
Disease−specific survival 0.2 0.4 0.6 0.8 1.0
PTEN FISH % aberrant nuclei
0
50
200
0
50
100 months
150
200
Supplementary Figure S2. Identification of patient outcome by PTEN FISH percentage aberrant nuclei and ratio. (a) Kaplan-Meier curves with simultaneous 95% confidence bands of patient overall survival over time after diagnosis when patients were dichotomized into two groups by the percentage aberrant nuclei. Vertical lines illustrate censored patients. Log-rank tests were performed to test for equality in the survival expectation in each group. N values represent the number of patients in each group under risk. P < 0.05 are marked in bold. (b) Overall survival by the ratio. (c) Disease-specific survival by the percentage aberrant nuclei. (d) Disease-specific survival by the ratio. (e) Recurrence-free survival by the percentage aberrant nuclei (f ) Recurrence-free survival by the ratio.
5
Variable
Characteristics
Overall survival (hazard ratio [95% confidence interval])
P value
UNIVARIATE COX REGRESSION Age at diagnosis BMI Gleason score pT pN Margin status PSA at diagnosis PTEN FISH ratio SPOP mutation ERG b/a FISH PTEN IHC
< 64 y, ≥ 64 y ≤ 25, > 25 (kg/m2) 5-6, 7, 8-10 pT2a-c, pT3a-b, pT4 pN0, pN1 no tumor, positive surgical margin 60%), deletion (≤ 60%) wide type, mutation no/with rearrangement negative, score 1, 2, 3
1.29 [ 0.73, 2.30 ] 1.02 [ 0.53, 1.95 ] 2.38 [ 1.48, 3.85 ] 2.06 [ 1.33, 3.20 ] 1.90 [ 0.75, 4.80 ] 1.96 [ 1.11, 3.46 ] 0.91 [ 0.50, 1.66 ] 2.31 [ 1.31, 4.09 ] 0.56 [ 0.07, 4.14 ] 0.93 [ 0.50, 1.74 ] 0.74 [ 0.52 ,1.07 ]
= 0.380 = 0.961 < 0.001 = 0.001 = 0.176 = 0.020 = 0.753 = 0.004 = 0.568 = 0.825 = 0.115
2.02 [ 1.17 , 3.47 ] 1.30 [ 0.76 , 2.22 ] 1.49 [ 0.78 , 2.82 ] 1.96 [ 1.09 , 3.54 ]
= 0.0113 = 0.3472 = 0.2239 = 0.0246
2.17 [ 1.29 , 3.65 ] 1.69 [ 0.95 , 3.02 ] 2.00 [ 1.11 , 3.60 ]
= 0.0035 = 0.0765 = 0.0208
MULTIVARIATE COX REGRESSION Global model Gleason score pT Margin status PTEN FISH ratio
5-6, 7, 8-10 pT2a-c, pT3a-b, pT4 no tumor, positive surgical margin no deletion (> 60%), deletion (≤ 60%)
Model with stepwise reverse selection Gleason score Margin status PTEN FISH ratio
5-6, 7, 8-10 no tumor, positive surgical margin no deletion (> 60%), deletion (≤ 60%) 0.25
1.00 4.00 Hazard Ratio
16.00
Supplementary Figure S3. Estimation of overall survival hazard ratios by Cox regression. The dashed vertical line was drawn at the no effect point (hazard ratio of 1.0). Horizontal lines represent a 95% confidence interval. The mid-point of the box represents the mean effect estimate and the area of the box represents the weight for each subgroup. P < 0.05 are marked in bold. Limit for the stepwise reverse selection procedure was P = 0.1.
6
a
b
c
d
e
f
Supplementary Figure S4. Sample tissue cores with IHC and ALU. (a-d) Examples of representative tissue cores (diameter 0.6 mm) with negative (score 0) and strongly positive (score 3+) immunoreactivity for antibodies against PTEN and ERG. (e,f ) Examples of representative tissue cores with weak and strongly positive ALU SISH as marker for DNA viability. If ALU staining is weak or negative, the DNA is not viable (no target for staining). A total of 13 cores (out of 84) were excluded from further analyses because of unviable DNA, lack of target tissue, or weak CEPs.
7
a
b Deletion No deletion
1
PTEN FISH ratio
0.9 0.8 0.7
No deletion Deletion
0.6
One false positive case Three false negative cases
0.5
Manual DISH: Deletion
0.4
Manual DISH: No deletion 0
0.5
1 1.5 2 PTEN DISH ratio
c
FISH: no deletion, DISH: deletion
2.5
d
FISH: no deletion, DISH: deletion
e
FISH: deletion, DISH: no deletion
Supplementary Figure S5. FISH and DISH comparison. (a) Scatterplot of DISH ratio against FISH ratio, color-coded by DISH manual assessment. Dashed circles highlight the single false negative case (FISH: deletion; DISH: no deletion) and the three false positive cases, where the orange circle represents Fig. 1A. (b) Example of interphase FISH of prostate cancer with heterozygous PTEN deletion. Red, PTEN signals; green, CEP10 signals. Scale bar, 10 µm. (c,d) The core (diameter 0.6 mm) shows deletion by DISH, but no deletion by FISH. These two cases correspond to the two orange points circled by the blue dashed line in a. Scale bar, 10 µm. (e) DISH shows no deletion, but deletion by FISH. This case is highlighted as the single blue point circled by the orange dashed line in a. Scale bar, 10 µm.
8
Supplementary Figure S6. An independent training set. A training set of 1, 000 image patches from an independent prostate cancer tissue core for expert annotation, SVM training, and validation. Each image patch is centered with a roundish DISH signal of either PTEN (black boxes), CEP10 (red boxes), PTEN +CEP10 (green boxes), background noise (white boxes) or cell stain (blue boxes).
9 1 optimal operating point threshold = 0.84 (global ratio)
True positive rate
0.8 0.6 0.4 0.2
AUC: 0.99 [0.96 -1] 0
0
0.2 0.4 0.6 0.8 False positive rate
1
Supplementary Figure S7. Receiver operating characteristic (ROC) analysis. ROC analysis of global ratio using DISH manual annotation as ground truth. The optimal operating point determines the final threshold: 0.84, which were applied to (Supplementary Table S3). AUC stands for area under the curve.
10
Supplementary Figure S8. Randomized neighborhood. The right images are the zoomed version of the left (diameter 0.6 mm), superimposed with detected points (drawn as squares, color-coded as in Fig. 1g) and random neighborhoods. A neighborhood is represented as a circle with a predefined radius. The center of such a circle is the CEP10 point that lies closest to a random point (in blue).
11
a
b
c
b
c
d
e
f
e
f
Supplementary Figure S9. PTEN DISH whole slide image analysis.(a) PTEN DISH whole slide (108, 000 × 138, 000 pixels), scale bar 1mm. (b,c) Zoomed versions of sub areas of a, scale bar 10 µm. Homozygous PTEN deletion in b and no deletion in c. (d) A serial section that was immunohistochemically stained by anti-PTEN antibody, scale bar 1 mm. (e,f ) Zoomed versions of sub areas of d, scale bar 10 µm. Loss of PTEN protein expression in e and cytoplasmic PTEN protein expression in f.
12
3 2
ratio
3
1
2
0
1 0 0 5
10 15 20 25 sub-images 30 35 40 45 50
60 50 40 30 20
sub-images
10
Supplementary Figure S10. Three-dimensional bar graph visualizing ratio distribution. The height and the color of the 3D bar graph encode the global ratio of PTEN to CEP10 in respective sub-images. Each sub-image has the dimension of 2000 × 2000 pixels.
13
a
b
c
d
Supplementary Figure S11. Application of ISHProfiler to other genes. (a) Tissue core showing amplification of 19q12 including CCNE1 and URI in ovarian cancer. (b) Amplification of 19q12 could be detected by the global ratio for the threshold at 2.0, matching the manual assessment of the ovarian cancer tissue core by a trained pathologist. Black signals, 19q12 gene locus; red signals, CEP19; green signals, 19q12+CEP19. (c) Tissue core showing amplification of 19q12 including CCNE1 and URI in endometrial cancer. (d) Amplification of 19q12 could be detected by the ISHProfiler workflow, although the digitization was performed with a different scanner from Hamamatsu. Amplification of 19q12 could be detected by the global ratio for the threshold at 2.0, matching the manual assessment. Signals are color coded as in b.
14
ratio
sub-images
sub-images
Supplementary Figure S12. Whole slide image analysis for 19q12 DISH. Amplification of 19q12 including CCNE1 and URI in ovarian cancer could be detected on a whole slide image at the top panel, color-coded as in (Supplementary Fig. S11b). The height and the color of the 3D bar graph encode the global ratio of 19q12 to CEP19 in respective sub-images. Each sub-image has the dimension of 2000×2000 pixels.
15
1.11.1
Hazard Ratio
Power
0.90.9
0.70.7
0.50.5
0.30.3 0 0
1.7000 1.8000 1.9000 2.0000 2.1000
100100
200200
300300
400400
500500
600
Sample size (Total N)
Supplementary Figure S13. Post hoc power analysis estimating power versus N for different hazard ratios. For instance, a two-sided log-rank test with an overall sample size of 100 subjects achieves 60.1% power at a 0.05 significance level to detect a hazard ratio of 1.70 (red dots) when the control group has a hazard ratio of 1.0. All subjects begin the study together (no accrual periods). The proportion dropping out of the both groups is 0.05.
16
Supplementary Tables Clinicopathological, immunohistochemical and molecular features of prostate cancer patients with RPE No. of patients No. of patients with follow-up (%) Median follow-up (months) Range (months) Variable n Clinicopathological characteristics Age at diagnosis (median 64 years, range 46-82) < 64 years 145 64 years 184 unknown 10 Body mass index (kg/m 2 ) 25 91 > 25 151 unknown 97 Gleason score 5 7 6 46 7 198 8 24 9 59 10 3 unknown 2 Tumor stage (pT) pT2a 37 pT2b 4 pT2c 170 pT3a 56 pT3b 56 pT4 13 unknown 3 Nodal status (pN) pN0 266 pN1 17 unknown 56 Surgical margins negative 217 positive 115 unknown 7 PSA at diagnosis (ng/µl) < 10 131 10 165 unknown 43
339 298 95 0-167 % 42.8 54.3 2.9 26.8 44.5 28.6 2.1 13.6 58.4 7.1 17.4 0.9 0.6 10.5 1.2 50.1 16.5 16.5 3.8 0.9 78.5 5.0 16.5 64.0 33.9 2.1 38.6 48.7 12.7
Variable n Immunohistochemical data Cytoplasmic PTEN immunoreactivity (intensity) negative 119 score 1+ 95 score 2+ 96 score 3+ 6 unknown 23 Nuclear ERG immunoreactivity (intensity) negative 156 score 1+ 73 score 2+ 58 score 3+ 36 unknown 16 Ki-67 (MIB1) immunoreactivity (%) < 5% 310 5% 27 unknown 2
91.4 8.0 0.6
Sequencing data SPOP mutation wild-type mutation unknown
151 13 175
44.5 3.8 51.6
124 50 89 4 72
36.6 14.7 26.3 1.2 20.9
261 78 0
77.0 23.0 0.0
265 32 42 0
78.2 9.4 12.4 0.0
Fluorescence in situ hybridization ERG FISH (break apart assay) normal translocation translocation through deletion mixture (normal/translocation) unknown PTEN FISH (ratio) no deletion (ratio > 0.6) deletion (ratio 0.6) unknown PTEN FISH (% aberrant nuclei) no deletion (% < 0.6) hemizygous deletion (% 0.6) homozygous deletion (% 0.6) unknown
% 35.1 28.0 28.3 1.8 6.8 46.0 21.5 17.1 10.6 4.7
Supplementary Table S1. Clinicopathological and immunohistochemical features of patients with prostate cancer receiving RPE.
21
PTEN FISH ratio (dichotomous 60%) PTEN Deletion
No Deletion
Total
PTEN DISH ratio
PTEN Deletion
12
3
15
(dichotomous 60%)
No Deletion
1
55
56
13
58
71
Sensitivity: 92.3%
Specificity: 94.8%
Total Accuracy: 94.4
Supplementary Table 2. Sensitivity and specificity for PTEN DISH and FISH.
Supplementary Table S2. Sensitivity and specificity for PTEN FISH and DISH.
PTEN global ratio (optimal threshold 84%) PTEN Deletion
No Deletion
Total
PTEN DISH ratio
PTEN Deletion
14
1
15
(dichotomous 60%)
No Deletion
1
55
56
15
56
71
Sensitivity: 93.3%
Specificity: 98.2%
Total Accuracy: 97.2
Supplementary Table 3. Sensitivity and specificity for the PTEN DISH ratio and the global ratio using the optimal threshold of 0.84, determined by the ROC analysis in Supplementary Figure 10.
17
18
PTEN global ratio (optimal threshold 84%) PTEN Deletion
No Deletion
Total
PTEN DISH ratio
PTEN Deletion
14
1
15
(dichotomous 60%)
No Deletion
1
55
56
15
56
71
Sensitivity: 93.3%
Specificity: 98.2%
Total Accuracy: 97.2
Supplementary Table 3. Sensitivity and specificity for the PTEN DISH ratio and the global ratio using
Supplementary Table S3. Sensitivity and specificity for the PTEN DISH ratio and the global ratio. the optimal of 0.84, determined by the ROC analysis Supplementary Figure 10. analysis in The global ratiothreshold was dichotomized by the optimal threshold of in 0.84, determined by the ROC (Supplementary Fig. S7).