Sep 22, 2016 - 0.19. 0.19. 0.00. 0.92. 0.00. Actinobacteria. Thermomonosporaceae. 0.00. 0.19. 0.09. 0.00. 0.00. Proteobacteria. Bdellovibrionaceae. 0.09. 0.19.
1
Supplementary Information
2 3 4 5 6 7 8 9 10 11 12 13 14 15 16 17 18 19 20 21 22 23 24 25 26 27
Supplementary experimental procedures Site management Our experimental field received the incorporation of rice straw in October 2008. Chemical fertilizer (ammonium sulfate 30 kg/ha) was applied to the field on April 23, 2009. Right after the fertilizer application, the plow layer (ca. 17 cm) was mixed by rotary tiller. The field was tilled again and submerged under water on April 30. Rice seedlings were transplanted on May 12, 2009. The first herbicide containing 15% (w/w) bromobutide, 7.5% (w/w) fentrazamide, and 1.3% (w/w) bensulfuron-methyl was applied on May 20 and the second one containing 1.8% (w/w) cyhalofop-butyl on May 25. During rice cultivation, temporal drainage (June 19–30) and intermittent irrigation (July 1–August 31) with cycles of artificial drainage and irrigation were performed in summer in order to suppress CH4 emissions (1). Additional fertilizer (ammonium chloride 10 kg/ha) applications were performed on July 17 and 24. Water was completely drained on September 1, and rice plants were harvested on September 22, 2009. Measurement of denitrification and nitrification activity. Denitrification activity of the soil samples was measured with the acetylene block technique (2). The reaction mixture comprised 1 g (dry weight) fresh soil, 2 ml sterilized water, and 50 µmol NaNO3 in a 10-ml glass vial. The vial was sealed with a butyl rubber cap and the headspace gas was substituted to Ar-C2H2 (90:10 (v/v)) gas. After incubation at 20°C for 24 h, the amount of N2O produced in the headspace was measured by gas chromatography as described previously (Saito et al., 2008). Nitrification activity was assayed by measuring the amount of nitrate produced after incubating 1.5 g (dry soil basis) fresh soil at 20°C with 15 ml sterilized water and 30 µmol (NH4)2SO4 in a 100-ml glass flask for 2 weeks under aerobic conditions.
28 29 30 31 32 33 34 35 36
Optimization of number of PCR cycles for clone libraries. In order to minimize PCR bias in the clone library analysis, number of PCR cycles were optimized by qPCR with quenching fluorescence-labeled primer (Q-primer) (3). Primers Q-10F (5’-CAGTTTGATYMTGGCTCAG-3’) and Q-934R (5’-CTGCTCCCCCGCCAATTCCT-3’; 4) were labeled with fluorescence molecule at their 5’-end site (J-Bio21, Tsukuba, Japan). Primers Q-10F and 907R (5), and A364a (4) and Q-934R were used for the amplification of bacterial and archaeal 16S rRNA genes, respectively. The 20 µl reaction mixture comprised 1x Ex Taq Buffer, 2.5 mM dNTP,
1 2 3 4 5 6 7 8 9
0.1 µM Q-primer, 0.1 µM non-labeled primer, 0.5 µg/µl BSA, and Ex Taq HS polymerase (Takara Bio, Otsu, Japan). The qPCR conditions were as follows: initial denaturation at 95°C for 5 min, followed by 45 cycles of 95°C for 30 s, primer annealing (54°C and 64 °C for bacteria and archaea, respectively) for 45 s, and 72°C for 60 s for bacteria (45 s for archaea). Based on the results of the qPCR with Q-primers, optimal PCR cycle numbers were identified as being 16 and 19 for bacteria and archaea, respectively. Bacterial and archaeal partial 16S rRNA were amplified under the same PCR conditions with the optimal PCR cycle numbers.
1 2 3 4 5 6 7 8 9 10 11 12 13 14 15 16 17 18
References 1. Uoki, Y., and S. Noda. 2001. Suppression of methane emission from Strong-Gley soils paddy field by water managements. Japanease Journal Soil Science and Plant Nutrition 72:449-452 (In Japanese). 2. Tiedje, J. M. 1994. Denitrifiers, p. 245-267. In R.W. Weaver, J.S. Angle, P.J. Bottomley (ed.), Methods of soil analysis part 2. Microbiological and biochemical properties, Soil Science Society of America Inc., Wisconsin. 3. Nishizawa, T., M. Komatsuzaki, N. Kaneko, and H. Ohta. 2008. Archaeal diversity of upland rice field soils assessed by the terminal restriction fragment length polymorphism method combined with real time quantitative-PCR and a clone library analysis. Microbes Environ. 23:237-243. 4. Kemnitz, D., S. Kolb, and R. Conrad. 2007. High abundance of Crenarchaeota in a temperate acidic forest soil. FEMS Microbiol. Ecol. 60:442-448. 5. Engelbrektson, A., V. Kunin, K.C. Wrighton, N. Zvenigorodsky, F. Chen, H. Ochman, and P. Hugenholtz. 2010. Experimental factors affecting PCR-based estimates of microbial species richness and evenness. ISME J. 4:642-647.
Table S1. Close relatives of sequences of the DGGE bands excised from polyacrylamide gel showed in Figure S2.
Closest reference sequences DGGE band
Microorganisms
Phylogenetic affiliations
Accession number
Identity (%)
Alignment
A
Methylibium sp.
Betaproteobacteria/Burkholderiales
AB609313
100
196/196
B1
Anabaena sp.
Cyanobacteria/Nostocales
FJ948087
98.8
171/173
B2
Cylindrospermum sp.
Cyanobacteria/Nostocales
GU055195
98.8
171/173
C
Anabaena sp.
Cyanobacteria/Nostocales
FN691915
98.9
174/176
D
Anabaena sp.
Cyanobacteria/Nostocales
HE975017
100
164/164
E
Cylindrospermopsis raciborskii
Cyanobacteria/Nostocales
JQ707296
100
174/174
F1
Anabaena cylindrica
Cyanobacteria/Nostocales
HE975014
100
174/174
F2
Anabaena cylindrica
Cyanobacteria/Nostocales
HE975014
99.4
173/174
G
Nostoc sp.
Cyanobacteria/Nostocales
JF810617
100
174/174
1
Table S2. Taxonomic composition of the specific OTUs in the bacterial clone libraries. Number of OTUs (Number of clones)a Phylogenic group
Proteobacteria
2 3 4 5 6 7
a
OTUwBc
OTUdBd
47
30
(96, 17, 20, 94)
(10,83,92,12)
Alphaproteobacteria
6
(0,7,8,0)
4
(5,0,0,5)
Betaproteobacteria
14
(4,38,20,2)
10
(35,6,7,32)
Gammaproteobacteria
2
(0,2,2,0)
4
(9,0,4,9)
Deltaproteobacteria
25
12
(47,11,9,48)
(6,43,55,10)
Cyanobacteria
8
(3,27,38,7))
1
(1,0,0,1)
Bacteroidetes
7
(0,13,11,0)
4
(4,0,0,4)
Actinobacteria
7
(0,9,9,1)
12
(23,6,4,28)
Acidobacteria
5
(0,6,6,0)
7
(10,0,0,7)
Chloroflexi
5
(0,10,8,0)
3
(4,0,0,6)
Verrucomicrobia
2
(0,2,2,0)
2
(2,0,0,3)
Spirochaetes
1
(0,1,2,0)
0
-
Firmicutes
1
(0,2,1,0)
1
(1,0,0,1)
Gemmatimonadetes
1
(0,1,1,0)
2
(9,1,2,11)
Planctomycetes
0
-
3
(4,0,0,3)
Nitrospira
0
-
1
(3,2,2,4)
Unclassified Bacteria
11
(0,18,17,0)
12
(23,1,4,25)
Totalb
95
(13,171,188,20)
78
(180,27,32,187)
A Number represents the total number of shared OTUs in each phylogenetic group, and the numbers in parenthesis are the numbers of clones in the each OTUs originated from the four libraries (BD1R, BW1R, BW2R, and BD2R). b Total numbers of shared OTUs and sequences at phylum level. c OTUs specific to the libraries BW1R and BW2R. d OTUs specific to the libraries BD1R and BD2R.
Table S3. Taxonomic distribution of bacterial sequences at family-level resolution. Phylum
Family
BD1R
Ratio per total sequences (%) † BW1R BW2R BD2R
BW1D
Proteobacteria Chloroflexi Proteobacteria Proteobacteria Cyanobacteria
Geobacteraceae Anaerolineaceae Cystobacteraceae Burkholderiales_incertae_sedis Family I
9.45 5.52 3.65 2.43 1.03
5.86 5.67 4.16 3.31 2.93
5.29 5.19 4.72 5.29 3.12
5.13 3.94 3.02 3.48 2.29
5.61 15.82 2.00 0.20 0.00
Proteobacteria Acidobacteria Proteobacteria Gemmatimonadetes Planctomycetes
Rhodocyclaceae Holophagaceae Sinobacteraceae Gemmatimonadaceae Planctomycetaceae
1.59 0.84 0.84 2.25 2.62
2.08 1.42 1.42 1.42 1.23
1.23 0.85 1.32 2.46 0.66
1.37 0.64 0.37 2.75 2.01
1.30 0.70 0.90 2.10 1.40
Actinobacteria Proteobacteria Proteobacteria Proteobacteria Proteobacteria Proteobacteria
Acidimicrobiaceae Pseudomonadaceae Syntrophobacteraceae Acetobacteraceae Polyangiaceae Comamonadaceae
0.28 1.22 0.19 0.37 1.96 0.37
1.13 1.13 0.95 0.95 0.85 0.85
0.76 1.04 0.57 1.61 0.47 1.79
1.01 0.55 0.09 0.46 3.11 0.82
0.20 0.10 0.50 0.10 0.50 0.20
Bacteroidetes Proteobacteria Actinobacteria Proteobacteria Firmicutes
Chitinophagaceae Syntrophaceae Kineosporiaceae Syntrophorhabdaceae Bacillaceae 1
1.03 0.09 0.28 0.00 0.00
0.85 0.66 0.57 0.57 0.57
0.19 0.85 0.00 0.57 0.09
0.27 0.82 0.92 0.09 0.09
2.20 0.70 0.00 0.20 0.50
Armatimonadetes Proteobacteria Proteobacteria Proteobacteria Proteobacteria
Chthonomonadaceae Rhodospirillaceae Alcaligenaceae Desulfobulbaceae Methylocystaceae
0.75 0.65 0.75 0.19 0.37
0.57 0.47 0.47 0.38 0.38
1.04 0.57 1.04 0.76 0.19
1.01 0.73 1.56 0.09 0.09
1.10 0.10 0.10 0.40 0.00
Proteobacteria Bacteroidetes Actinobacteria Actinobacteria Actinobacteria
Oxalobacteraceae Cryomorphaceae Intrasporangiaceae Nocardioidaceae Pseudonocardiaceae
0.09 0.09 0.28 0.47 0.00
0.38 0.38 0.28 0.28 0.28
0.28 0.28 0.00 0.47 0.09
0.27 0.00 0.09 0.37 0.09
0.20 0.10 0.00 0.00 0.00
Proteobacteria Proteobacteria Nitrospira Chlorobi Actinobacteria Actinobacteria
Hyphomicrobiaceae Xanthomonadaceae Nitrospiraceae Ignavibacteriaceae Acidimicrobineae_incertae_sedis Micromonosporaceae
0.19 0.47 0.56 0.47 0.28 0.19
0.28 0.28 0.28 0.28 0.19 0.19
0.09 0.66 0.28 0.19 0.28 0.00
0.46 0.46 0.64 0.00 0.18 0.92
0.00 1.20 0.30 0.30 0.40 0.00
Actinobacteria Proteobacteria Proteobacteria Proteobacteria Proteobacteria
Thermomonosporaceae Bdellovibrionaceae Bradyrhizobiaceae Caulobacteraceae Neisseriaceae
0.00 0.09 0.28 0.19 0.00
0.19 0.19 0.19 0.19 0.19
0.09 0.09 0.09 0.09 0.09
0.00 0.27 0.27 0.18 0.09
0.00 0.10 0.30 0.00 0.00
Firmicutes Spirochaetes Spirochaetes Actinobacteria Actinobacteria
Clostridiaceae 1 Spirochaetaceae Leptospiraceae Conexibacteraceae Geodermatophilaceae
0.00 0.00 0.00 0.00 0.65
0.19 0.19 0.19 0.09 0.09
0.28 0.76 0.00 0.09 0.19
0.18 0.18 0.00 0.18 0.46
0.10 0.60 0.00 0.00 0.00
Actinobacteria Actinobacteria Proteobacteria Proteobacteria
Microbacteriaceae Mycobacteriaceae Desulfobacteraceae Phaselicystidaceae
0.00 0.00 0.19 0.00
0.09 0.09 0.09 0.09
0.00 0.00 0.28 0.19
0.00 0.18 0.09 0.09
0.00 0.00 0.00 0.00
Proteobacteria
Kofleriaceae
0.09
0.09
0.19
0.18
0.00
Proteobacteria
Desulfovibrionaceae
0.00
0.09
0.00
0.00
0.10
Continued on the following page.
Proteobacteria Proteobacteria
Rhodobiaceae Xanthobacteraceae
0.28 0.00
0.09 0.09
0.19 0.00
0.09 0.18
0.00 0.10
Proteobacteria Proteobacteria
Rhodobacteraceae Hydrogenophilaceae
0.00 0.09
0.09 0.09
0.28 0.09
0.00 0.00
0.00 0.00
Proteobacteria
Methylococcaceae
0.09
0.09
0.38
0.00
0.20
Firmicutes Firmicutes Firmicutes
Gracilibacteraceae Pasteuriaceae Veillonellaceae
0.00 0.00 0.00
0.09 0.09 0.09
0.00 0.19 0.00
0.00 0.55 0.00
0.00 0.10 0.10
Chloroflexi
Chloroflexaceae
0.09
0.09
0.19
0.18
0.00
Armatimonadetes Verrucomicrobia
Armatimonadaceae Opitutaceae
0.09 0.00
0.09 0.09
0.00 0.38
0.00 0.18
0.00 0.10
Cyanobacteria
Family XI
0.09
0.09
0.76
0.00
0.00
Cyanobacteria Bacteroidetes
Family II Sphingobacteriaceae
0.00 0.00
0.09 0.09
0.19 0.09
0.00 0.00
0.00 0.10
Bacteroidetes Spirochaetes
Cyclobacteriaceae Brevinemataceae
0.00 0.00
0.09 0.09
0.28 0.09
0.00 0.00
0.10 0.00
Deinococcus-Thermus Actinobacteria
Deinococcaceae Iamiaceae
0.00 0.37
0.09 0.00
0.00 0.00
0.00 0.09
0.00 0.00
Actinobacteria Actinobacteria
Nakamurellaceae Cryptosporangiaceae
0.19 0.00
0.00 0.00
0.09 0.09
0.18 0.00
0.00 0.00
Actinobacteria
Sporichthyaceae
0.00
0.00
0.09
0.18
0.00
Actinobacteria Actinobacteria
Micrococcaceae Propionibacteriaceae
0.00 0.00
0.00 0.00
0.09 0.00
0.09 0.27
0.20 0.00
Actinobacteria Actinobacteria
Streptomycetaceae Coriobacteriaceae
0.19 0.00
0.00 0.00
0.38 0.00
0.64 0.27
0.10 0.30
Proteobacteria Proteobacteria
Desulfuromonadaceae Nannocystaceae
0.09 0.00
0.00 0.00
0.09 0.09
0.00 0.09
0.20 0.00
Proteobacteria Proteobacteria
Bacteriovoracaceae Rhizobiales_incertae_sedis
0.09 0.00
0.00 0.00
0.28 0.09
0.00 0.00
0.00 0.00
Proteobacteria
Rhizobiaceae
0.00
0.00
0.09
0.00
0.10
Proteobacteria Proteobacteria
Beijerinckiaceae Sphingomonadaceae
0.00 0.00
0.00 0.00
0.00 0.09
0.09 0.09
0.00 0.30
Proteobacteria Proteobacteria
Burkholderiaceae Methylophilaceae
0.19 0.00
0.00 0.00
0.09 0.09
0.18 0.00
0.10 0.00
Proteobacteria
Moraxellaceae
0.00
0.00
0.00
0.00
0.10
Proteobacteria Proteobacteria
Coxiellaceae Aeromonadaceae
0.00 0.00
0.00 0.00
0.09 0.09
0.00 0.00
0.10 0.00
Proteobacteria Proteobacteria
Ectothiorhodospiraceae Thiotrichales_incertae_sedis
0.00 0.00
0.00 0.00
0.00 0.00
0.00 0.00
0.20 0.10
Firmicutes
Ruminococcaceae
0.00
0.00
0.47
0.00
0.40
Firmicutes Firmicutes
Incertae Sedis III Clostridiales_Incertae Sedis XVIII
0.00 0.00
0.00 0.00
0.00 0.00
0.09 0.00
0.00 0.10
Firmicutes Firmicutes
Paenibacillaceae 1 Thermoactinomycetaceae 1
0.00 0.00
0.00 0.00
0.09 0.00
0.09 0.09
0.00 0.00
Elusimicrobia Chloroflexi
Elusimicrobiaceae Caldilineaceae
0.09 0.00
0.00 0.00
0.19 0.00
0.00 0.00
0.20 0.10
Planctomycetes Verrucomicrobia
Phycisphaeraceae Verrucomicrobiaceae
0.19 0.09
0.00 0.00
0.00 0.09
0.09 0.00
0.10 0.10
Cyanobacteria
Family IV
0.00
0.00
0.47
0.00
0.00
Cyanobacteria Cyanobacteria
Family XIII Family IX
0.00 0.00
0.00 0.00
0.09 0.00
0.00 0.09
0.00 0.00
Cyanobacteria Bacteroidetes
Family VIII Cytophagaceae
0.00 0.00
0.00 0.00
0.00 0.00
0.09 0.09
0.00 0.00
Bacteroidetes Bacteroidetes
Porphyromonadaceae Flavobacteriaceae
0.00 0.00
0.00 0.00
0.19 0.09
0.00 0.00
0.00 0.20
Lentisphaerae
Victivallaceae
0.00
0.00
0.09
0.00
0.00
unclassified family
54.44
52.17
46.46
53.39
55.56
†
listed in order of ratio in BD1R.
Table S4. Taxonomic distribution of archaeal sequences at family-level resolution.
Phylum
Family
AD1R
Ratio per total sequences (%) † AW1R AW2R AD2R
AW1D
Euryarchaeota
Methanosaetaceae
33.68
32.40
32.70
41.03
16.62
Euryarchaeota Euryarchaeota
Methanosarcinaceae Methanomicrobiales_incertae_sedis
18.45 3.31
11.11 6.35
9.06 7.88
20.02 3.99
7.48 9.60
Euryarchaeota
Methanospirillaceae
0.00
0.37
0.27
0.00
0.18
Euryarchaeota Euryarchaeota
Methanomicrobiaceae Methanocellaceae
0.00 3.69
0.28 9.90
0.18 8.88
0.09 6.25
0.18 16.07
Euryarchaeota
Methanobacteriaceae
1.23
0.84
1.00
0.54
1.48
Euryarchaeota Crenarchaeota
Thermoplasmatales_incertae_sedis Fervidicoccaceae
0.57 0.47
0.56 0.19
0.82 0.45
0.18 0.27
1.20 0.00
unclassified family
38.60
38.00
38.77
27.63
47.18
†
listed in order of ratio in AD1R.
Fig. S1 action
fertilization and rotary tilling (23 Apr after sampling) waterlogging and rotary tilling (30 Apr before sampling)
rotary tilling (6 May) transplanting (12 May) herbicide application (20,25 May)
month
Apr. 23*, 30
May
Jun.
Jul.
BW
Aug.
4, 10*, 18*, 25 7, 14, 21, 28
water management stage
drainage (1 Sep.) harvest (22 Sep.)
temporal drainage (19-30 Jun.)
2009
sampling day
additional fertilization (17, 24 Jul.)
W
Oct.
6, 20 2, 9, 16, 23, 30
T
Sep.
I
1* 3, 17
CD
Fig. S1. Water management, rice cultivation, and sampling histories in the paddy field used in this study. Water management periods were separated to five stages: before waterlogging (stage BW; until 29 April), waterlogging (stage W; April 30–June 18), temporal drainage (stage T; June 19– 30), intermittent drainage (stage I; July 1–August 31), and after complete drainage (stage CD; after September 1). Asterisks (*) indicate the samples used for the clone library analysis.
Fig. S2 A M
B M
1
2
3
4
5
6
7
8
9
10
1
2
3
4
5
6
7
8
9
10
M
M
M
M
11
12
13
14
15
16
17
18
19
20
11
12
13
14
15
16
17
18
19
20
M
M
Fig. S2. Reproducibility of DGGE profiles of bacterial communities based on DNA (A) or RNA samples (B) extracted with three replications. Numbers of the each lane at the DGGE profiles represent soil samples, 1, 0423; 2, 0430; 3, 0507; 4, 0514; 5, 0521; 6, 0528; 7, 0604, 8, 0610; 9, 0618; 10, 0625; 11, 0702; 12, 0709; 13, 0716; 14, 0723; 15, 0730; 16, 0806; 17, 0820; 18, 0903; 19, 0917; 20, 1001. These numbers in each sample ID represent the sampling date (month + day) described in the Fig. S1, eg;. 0423 and 0723 indicate the soil sample collected on 23 April and 23 July respectively. Lane M shows the profiles of DGGE Maker II (Nippon Gene, Tokyo, Japan).
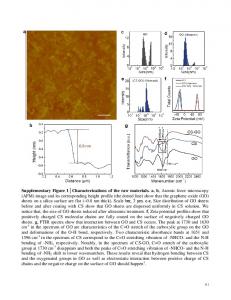
Fig. S3 A
B W
BW
T
I
CD
M 1 2 3 4 5 6 7 8 9 10 11 12 13 14 15 16 17 18 19 20 M
BW
W
T
I
CD
M 1 2 3 4 5 6 7 8 9 10 11 12 13 14 15 1617 18 1920 M
A B C D E F G
C
BW
W
T
I
CD
M 1 2 3 4 5 6 7 8 9 10 11 12 13 14 15 16 17 18 19 20 M
D
BW
W
M1 2 3 4 5 6
T
I
CD
7 8 9 10 11 12 13 14 15 16 17 18 19 20 M
Fig. S3. DGGE profiles of bacterial and archaeal communities. DGGE profiles of A) RNA-based DGGE targeting bacterial 16S rRNA; B) RNA-based DGGE targeting archaeal 16S rRNA; C) DNA-based DGGE targeting bacterial 16S rRNA gene; and D) DNA-based DGGE targeting archaeal 16S rRNA gene are shown. Numbers of the each lane at the DGGE profiles represent soil samples as described in legend of Fig. S2. Lane M shows the profiles of DGGE Maker II (Nippon Gene). DGGE bands indicated by alphabets (A to G) were excised from the gel for sequence analysis.
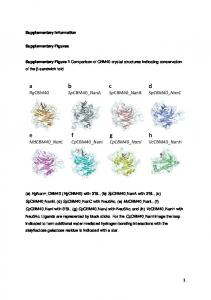
Fig. S4 DGGE band G Nostoc sp. PGU062469 DGGE band F1 Anabaena cylindrica GQ443447 DGGE band D DGGE band C Anabaena sp. AJ630437 Cylindrospermopsis raciborskii AF516741 Cyanobacteria DGGE band E Raphidiopsis curvata AY763116 DGGE band F2 Aphanizomenon sp. FM177487 Rhopalodia gibba AJ582391 Cyanothece sp. AF296873 Cylindrospermum sp. GU055195 DGGE band B2 85 DGGE band B1 89 Nostoc sp. AM711539 Oryza sativa Japonnica GU592207 Arabidopsis thaliana AP000423 99 Nitella sp. AF393604 Chara corallina AF393580 99 Bacillus subtilis NC000964
Chloroplast
0.02
Fig. S4. Phylogenetic tree constructed based on the sequences obtained from the DGGE bands (Fig. S3A) and reference cyanobacterial sequences. Bootstrap values (>70%) with 1000 replicates are shown next to the branches. The 16S rRNA sequence of Bacillus subtilis (NC_00964) was used as an outgroup.