SUPPLEMENTARY MATERIAL
Different sequence signatures in the upstream regions of plant and animal tRNA genes shape distinct modes of regulation
Gong Zhang1, Radoslaw Lukoszek1,2, Bernd Mueller-Roeber2, Zoya Ignatova1
1
Biochemistry, Institute of Biochemistry and Biology, University of Potsdam, Potsdam, Germany
2
Molecular Biology, Institute of Biochemistry and Biology, University of Potsdam, Potsdam,
Germany
Corresponding authors: Zoya Ignatova, Biochemistry, University of Potsdam, Karl-Liebknecht-Str. 24-25, 14467 Potsdam, Germany; Tel: +49 331 977 5130, Fax: +49 331 977 5128; e-mail:
[email protected] Bernd Mueller-Roeber, Molecular Biology, University of Potsdam, Karl-Liebknecht-Str. 24-25, 14467 Potsdam, Germany; Tel: +49 331 977 2810, Fax: +49 331 977 2512; e-mail:
[email protected]
1
Table S1. Animal tRNAs encoding the same amino acid share common motif in their upstream regions. tRNAs from each organism were grouped dependent on the amino acid they decode and the tRNAs with at least one conserved motif in their upstream region are marked with +. Upstream segments without any conserved motif are marked with −. Caenorhabditis Drosophila Anopheles Gallus Mus Rattus Amino elegans melanogaster gambiae gallus musculus norvegicus acid Ala + − − + + + Arg + + + − − − Asn s.a. s.a. s.a. s.a. s.a. s.a. s.a. s.a. Asp s.a. s.a. s.a. s.a. Cys s.a. s.a. s.a. s.a. s.a. s.a. Gln + − + + + + Glu + + + + + + Gly + + + + − His + s.a. s.a. + s.a. s.a. Ile + − + + + + Leu + − − − + + Lys − + + − + − Met s.a. s.a. s.a. s.a. s.a. s.a. Phe s.a. s.a. s.a. + s.a. + Pro − − − + − − Ser − + − + − + Thr − − − − − − s.a. s.a. s.a. s.a. s.a. Trp s.a. Tyr s.a. s.a. s.a. s.a. s.a. s.a. Val − − − − + + s.a. denotes that all tRNAs decoding this amino acid bear the same anticodon.
Homo sapiens
+ − + s.a. s.a. + + + s.a. + + − s.a. s.a. + − − s.a. + +
2
Table S2. Human Brf1 and Bdp1 splicing variants. Data were retrieved from the ECgene alternative splicing database [http://genome.ewha.ac.kr/ECgene/]. Gene ID mRNA length (bp) CDS length (bp) H14C11627.1 3511 579 Brf1 H14C11627.2 2874 609 H14C11627.3 913 402 H14C11627.4 496 259 H14C11627.5 967 483 H14C11627.6 1673 402 H14C11627.7 4169 1419 H14C11627.8 2861 1317 H14C11627.9 3538 2031 * H14C11627.10 3603 1950 H14C11627.11 3948 2031 * H14C11627.12 1906 450 H14C11627.13 1492 339 H14C11627.14 574 297 H14C11627.15 1452 624 H5C7152.1 740 476 Bdp1 H5C7152.2 4447 4116 H5C7152.3 7265 6762 H5C7152.4 10600 7872 H5C7152.5 5031 1392 H5C7152.6 5013 1797 * mRNA splice variants H14C11627.9 and H14C11627.11 are identical in protein sequence but differ in the non-coding flanking regions.
3
4
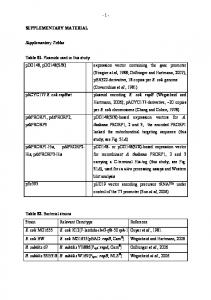
Figure S1. Best “word” frequency search within the 2000 nucleotide-long upstream regions of the mature tRNA sequences revealed no additional significant motif that could serve as a putative recognition sites for TFIIIB. The occurrence of the most frequent six-letter “word” at each position (x-axis) is plotted on the y-axis allowing a search with none (A) or one mismatch (B). Position 0 is determined by the first 5’-nucleotide of the mature tRNA. The significant peaks within the first 100 nucleotides upstream of the5’-initial nucleotide of the mature tRNA are identical to those identified in Figure 1. 5
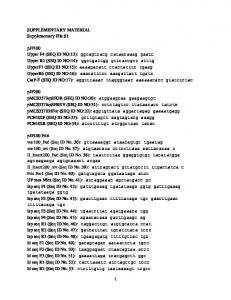
Figure S2. The best frequency “word” search in two yeast genomes, Saccharomyces cerevisiae (SacCer1, Oct. 2003) and Schizosaccharomyces pombe (build 1.1., Apr. 2007), revealed different conserved motifs. The search was performed in the near upstream region (up to -100 nucleotides) of the tRNAs genes allowing none (A) or one mismatch (B) (for details see the legend to Figure 1). Position 0 is determined by the first nucleotide of the mature tRNA. The dashed line indicates the average frequency value obtained from randomized sequences. Maximum and minimum frequency values determine the boundaries of the shadowed area and were also derived from the randomized dataset.
6
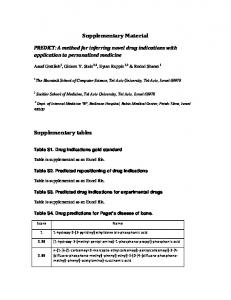
Figure S3. Motifs identified within the 100 nucleotides upstream of the 5’-start of the mature tRNAs. The top five most significant motifs for each genome are shown. TA-rich motifs are detected in every plant genome, but are completely lacking in the animal genomes. The motif search was performed using MEME version 4.4.0 (http://meme.sdsc.edu/meme4_4_0/cgi-bin/meme.cgi). 7
A
8
9
B
10
11
Figure S4. Majority of the human tRNA genes with the same anticodon bear conserved motifs in their upstream regions as identified by MEME 4.4. tRNA families are grouped based on the amino acid they bear and subdivided into amino acids encoded by more than one codon (A) and by one single codon (B). In panel A, the square brackets on the left group the tRNAs with the same anticodon. Each tRNA is specified by its anticodon, chromosome location and serial chromosome number (data were retrieved from the genomic tRNA database). The horizontal lines represent the 100-nucleotide-long region upstream of the 5’-end of the mature tRNA genes; position 0 determines the first nucleotide of the mature tRNA. The positions of the three most significant motifs are colored (cyan, blue, red) and the corresponding sequence logos are presented on the right side of each group. The combined p-value is the product of the p-values of all motifs detected within the upstream sequence; they are inversely proportional to the significance of the motifs. Motifs with p