Supplementary Material: I-ATAC tutorial 1 2 3
A standalone software platform for the interactive management and pre-processing of ATAC-seq
4 5
Zeeshan Ahmed2 and Duygu Ucar1, *
6 7
1
8
2
The Jackson Laboratory for Genomic Medicine, 10 Discovery Dr., Farmington, CT, USA University of Connecticut Health Center, 195 Farmington Ave, Farmington, CT, USA
9 10 11
Corresponding author: Duygu Ucar*
12
Email address:
[email protected]
13 14 15 16
Software Availability: I-ATAC is programmed in Java and built at both Mac-OS-X and Windows platform. •
17 18
https://github.com/UcarLab/I-ATAC •
19 20
23 24
Example dataset is available at: https://zenodo.org/record/46079#.WAe3l5MrK7Y
•
21 22
Its source code and executable are freely available at:
Supporting software and dependencies are available at: https://zenodo.org/record/162023#.WAe3dJMrK7Y
•
For additional information, please refer to the project webpage: https://www.jax.org/research-and-faculty/tools/i-atac
Supplementary Material
25
26
Table of Contents
27
1
Motivation ............................................................................................................................. 3
28
2
I-ATAC .................................................................................................................................... 4
29 30 31 32
3
Design Description ................................................................................................................. 6
33
4
34 35 36 37 38 39 40 41 42
5
43
6
44 45 46 47 48 49 50 51 52
7
53
8
Conclusions .......................................................................................................................... 32
54
9
Acknowledgments ................................................................................................................ 32
55
10 Funding: ............................................................................................................................... 32
56
11 Conflict of Interests: ............................................................................................................. 32
57
12 Additional Requirements...................................................................................................... 32
58
13 References ........................................................................................................................... 32
3.1 3.2 3.3
Operational Workflow of I-ATAC .................................................................................................6 Applications integration, data processing pipeline and project’s directory structure ...................8 Comments workflow, operating systems and physical data storage in data cluster .....................9
GUI Description .................................................................................................................... 10 Integrated Applications Details ............................................................................................ 14 5.1 5.2 5.3 5.4 5.5 5.6 5.7 5.8
FASTQC: ....................................................................................................................................14 Trimmomatic.............................................................................................................................15 BWA ..........................................................................................................................................15 SAMtools ..................................................................................................................................15 Picard ........................................................................................................................................15 BEDtools ...................................................................................................................................15 ATAC_BAM_shifter_gappedAlign.pl ..........................................................................................15 MACS2 ......................................................................................................................................16
Installation and Configuration .............................................................................................. 17 Case Studies ......................................................................................................................... 19 7.1 Example Dataset .......................................................................................................................19 7.1.1 Dataset Details ..............................................................................................................................19 7.1.2 Input ..............................................................................................................................................19 7.1.3 Output ...........................................................................................................................................22 7.2 Case Study 2: Using GM12878 – CD4 T- Cells..............................................................................25 7.2.1 Dataset Details ..............................................................................................................................25 7.2.2 Input ..............................................................................................................................................25 7.2.3 Output ...........................................................................................................................................27
59 60 2
61
1
Motivation
62 63 64 65 66
The use of high-throughput sequencing technologies has brought an enormous increase in the amount of heterogeneous genomic data production in the last decades. The importance of genomic dataset processing in the genomic community is well known; as it plays important role in analysing the dynamics and complexities of gene regulation with modelling and implementation of different statistical methods utilizing data processing pipelines.
67 68 69 70 71 72 73 74
Traditional way of next generation sequencing (NGS) data pre-processing is complex and based on running a series of command-line applications in Unix, Linux, MAC and DOS environments, which requires good knowledge of bioinformatics tools and good programming skills. There are over 200 tools available for the genome and exome sequencing data pre-processing and analysis (Pabinger et al., 2013) but most of them are non-interactive and command line based. Writing complex command line scripts and pipelines, and running non-interactive mode applications might be convenient for the scientists with good bioinformatics background but it is very hard for the biologist with no programming skills to conduct complex data analyses.
75 76 77 78 79
The focus of our research is toward the application of a novel epigenomic profiling assay for transposase-accessible chromatin with high throughput sequencing (ATAC-seq) for integrative epigenomic analysis (Buenrostro et al., 2013). ATAC-seq is a protocol to capture open chromatin sites (Buenrostro et al., 2013; Buenrostro et al., 2015a) by performing adaptor ligation and fragmentation of open chromatin regions (Tsompana and Buck, 2014).
80 81 82 83 84 85 86 87 88 89 90
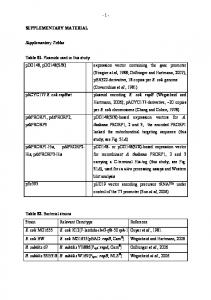
ATAC-seq has been a popular chromatin profiling technology for clinical samples and has been used for the assessment of chromatin accessibility in various cells and tissues in human and model organisms e.g. (Moskowitz et al. 2017; Miskimen et al., 2017; Bao et al. 2015; Buenrostro et al., 2015b) etc. Due to its efficiency in requirement of biological sample and in library preparation time, many scientists are generating ATAC-seq libraries to decipher the chromatin landscape in a given cell type and condition of interest. To generate ATAC-seq libraries, a hyperactive molecule, Tn5 is used to cut the open chromatin and then short reads are sequenced typically from both ends (i.e., paired end). The next step is the processing of ATAC-seq samples. A typical ATAC-seq data processing pipeline’s workflow is shown in S-Fig. 1, which starts with the quality check and adapter trimming, then alignment, shifting, removing duplicates, sorting and peak calling to find potential open chromatin sites, indicating active regulatory elements in each cell.
3
Supplementary Material
91 92
S-Fig. 1.: ATAC-seq data pre-processing pipeline’s workflow (Manuscript Fig.1).
93
2
94 95 96 97 98 99
Processing and analysis of large number of ATAC-seq samples is a challenge for non-computational scientists since usually multiple tests are required to find the optimal algorithms and parameter settings. Interfacing Assay for Transposase-Accessible Chromatin with high-throughput Sequencing (I-ATAC) is the first interactive, cross platform, user-friendly desktop application, which supports reproducible and automatic pre-processing of ATAC-seq (Buenrostro et al., 2013; Buenrostro et al., 2015) samples.
100 101 102 103 104
The targeted end users of I-ATAC are mainly the biologists, who are familiar and comfortable with interactive operating systems (e.g. Windows, Mac-OS-X) and applications (e.g. web based browsers or client based viewers), yet have limited experience with programming, shell scripting, and with the Unix environment. Moreover, I-ATAC could be a helpful tool for bioinformaticians, who are new to the field of epigenomic data analysis and are not familiar with ATAC-seq data processing steps.
105 106 107 108
The GUI of the I-ATAC (S-Fig. 2 A and B) is designed for simplicity and ease by following human computer interaction (HCI) guidelines (Ahmed et al., 2014). The concept behind designing I-ATAC GUI was to implement “One Click Operations” concept, similar to a Google search that requires users to enter one natural language based query and click a search button.
I-ATAC
4
109 110
S-Fig. 2 (A): Graphical User Interface of I-ATAC: Create and run data processing jobs.
111 112
S-Fig. 2 (B): Graphical User Interface of I-ATAC: Set parameters and user credentials.
5
Supplementary Material 113 114 115
Similarly, along with the default or customized settings (S-Fig. 2 B), I-ATAC requires only path to the sample data files (zipped or unzipped “FASTQ” files), project name and pressing button “Run ATAC-Seq” (S-Fig. 2 A) to perform following tasks:
116
•
Connect to the data cluster or local computer
117
•
Create output directory structure
118
•
Locate input data
119
•
Copy & paste or create soft links of data to process
120
•
Load modules, compilers & interpreters
121
•
Write command line instructions to integrate applications
122
•
Compose shell scripts (pipeline)
123 124
•
Create & queue jobs (Unix based Secure Shell Scripts) at cluster or execute instructions on local computer
125
•
Place output files in created directory structure
126
•
Start data processing
127
•
Disconnect to the connected data cluster
128
3
Design Description
129 130 131
I-ATAC is a platform designed by following software engineering principles for the sustainable bioinformatics software implementation (Ahmed et al., 2014). Here, we present its operational workflow, data structure and components’ orientation.
132
3.1
133 134 135 136 137
The basic work flow of I-ATAC is very simple (S-Fig. 3), as it requires only login information, project name and path to the samples files as input, however, pipeline operations can be customized (S-Fig. 4) by choosing the applications between FASTQC, Trimmomatic, BWA, Sam Sort, Mark Duplicates, Insert Size, BAM Shifter, SAM tools, SAM tools index and BED tools. To avoid exceptions, system will not let the user select any application without selecting its pre-requisites.
138 139 140
User can remotely handle sample data files for processing by either keeping them in the same parent directory and putting only pre-processed results in the main project and sub-project directories or by first copying compressed files into the project directory, unzips them and then process them.
141 142
User can configure job (Unix based Secure Shell Scripts) settings by processing one or multiple samples at a time as one job or multiple jobs (one for each sample).
Operational Workflow of I-ATAC
6
143 144
S-Fig. 3: I-ATAC: Operational workflow of I-ATAC (Manuscript Fig.3)
145 146 147
S-Fig. 4: I-ATAC: Customization of ATAC-seq data pre-processing pipeline with sequential (multiple jobs in one script) and parallel (multiple jobs in multiple scripts, one of each) processing. 7
Supplementary Material Applications integration, data processing pipeline and project’s directory structure
148
3.2
149 150 151 152
ATAC-seq data processing pipeline starts with the quality check, then paired end reads are trimmed, aligned, filtered, and sorted in a “sam” file. The “sam” file is compressed and indexed to a bam file, which is then used as input for peak calling. To manage pre-processed data, proposed directory structure is followed and automatically created in data cluster before data processing (S-Fig. 5).
153 154 155 156 157 158 159 160 161 162 163 164 165 166 167
S-Fig. 5: I-ATAC: Applications and project directory structure. (Manuscript Fig. 2) ATACseq_Projects Project_Name Sample_A_R1_Sample_A_R2 fastQC trimmomatic bwa macs2 mergedreplicated macs2
All the quality reports (“zip” and “html” files) are placed in “fastQC” sub-directory. Compressed files contain different output files including text (“txt”) and web page (“html”). Text file contains information about basic statistics, file name, file type, encoding, total sequences, sequence flagged quality, sequence length, base number, mean, median, lower, quartile, upper, quartile, 10th 8
168 169 170
percentile, 90th percentile, quality, Count, per base sequence content, per sequence GC content, per base N content, sequence length distribution, sequence duplication levels, overrepresented sequences, adapter content and Kmer content. Whereas html file visualize quantitative results.
171 172 173 174 175 176
All trimmed and filtered “FASTQ” files are placed in “trimmomatic" sub-directory, all the sorted, shifted “sam”, indexed “bam” and “bed” files are placed in “bwa” sub-directory. All the observed peak files are placed in the “macs2” sub-directory. The nested directory structure provides an organized and modular storage for multi-level ATAC-seq data analysis pipeline. Produced results in the form of sorted “sam” and “bam” files, as well as peaks can be visualized using available genome data browsers (e.g. USCS, Chipster etc.) and viewers (e.g. IGV etc.).
177
3.3
178 179 180 181 182
The components workflow (S-Fig. 6) of I-ATAC depends on the Java Run Time Environment (http://www.oracle.com/technetwork/java/javase/downloads/jre8-downloads-2133155.html), to be installed at in-use operation system, which can be Mac-OS-X, Microsoft Windows and Linux etc. The sample, sequenced data files, applications (S-Table. 3), compilers and interpreters (S-Table. 4), pre-processed data and scripts are need to be placed in data cluster.
Comments workflow, operating systems and physical data storage in data cluster
183 184 185
S-Fig. 6: I-ATAC: Components workflow, operating systems and physical data storage in data cluster. 9
Supplementary Material 186
4
GUI Description
187 188
As shown in (S-Fig. 2 A and B), the overall GUI of the I-ATAC is divided in to two modules: Process and Settings.
189 190 191 192
The Process module is to generate and run pipeline. Process provides six major features: A1: Sequence protocol and Project Name, A2: Output directory, A3: Path to FASTQ file, A4: Start locating and processing data, A5: Customize pipeline, A6: File Status, and A7: Terminal status (SFig. 7 and S-Table 1).
193 194
S-Fig. 7: GUI I-ATAC: Run ATAC-seq Pipeline (module: A).
195 Number A1
Feature Sequence protocol and
Description •
Project name
Requires user to select either “1x” or “2x” for single and paired end data.
•
Requires user to enter a Project Name, without any spaces and special characters. Reason to avoid spaces and special characters is, that, IATAC will automatically create a new directory, where data will be referenced (soft links) or copied for processing and results will be
10
placed. A2
Path to the FASTQ
•
Requires path to the directory, where data (FASTQ files) are placed.
•
Requires path to the directory, where processed data (outcome/output
files A3
Output directory
files) will be placed. A4
Start locating and
•
processing data
Starts locating sample data files, copy from source to the main destination (project) director, unzip compressed sample data files, automatically generate script, queue script(s) as job(s), perform data processing and place output in proposed directory structure.
A5
Customize Pipeline
•
Default parameters include I/O redirected, sequential combination of integrated applications and parameters. Twelve different options are integrated: 1.
FASTQC
2.
Trimmomatic
3.
BWA
4.
Sam Sort
5.
Mark Duplicates
6.
Insert Size
7.
BAM Shifter
8.
SAM tools
9.
SAM tools index
10. BED tools 11. MACS2 12. All 13. Auto Correct •
Option 12 is to select all options and perform data processing with default settings and option 13 is to correct the sequence I/O.
A6
File Status
•
Provides information about located data samples in the data cluster, using provided input path.
A7
196
Terminal Status
•
Provides information about execution of job in data cluster.
S-Table. 1: Features description of GUI-A: Run ATAC-seq Pipeline 11
Supplementary Material 197 198 199
The GUI-B module is mainly used to set the parameters of the applications and directory paths. As shown in the figure (S-Fig. 8), it provides only four features: Applications Parameters, Directory Paths, Save and load Parameters, and Reset Paths (S-Fig. 8 and S-Table 2).
200 201
S-Fig. 8: GUI I-ATAC: Set Script Parameters (module: B). Number B1
Feature Applications Parameters
Description •
Paths and calling instructions to the following integrated applications and referenced genome and adapters: 1.
Reference genome
2.
FASTQC
3.
Trimmomatic
4.
Adapters
5.
BWA
6.
SamSort
7.
Mark Duplicates
8.
Insert Size Metrics
12
9.
BAM Gap Align
10. SAM tools 11. BED tools 12. Samtools Index 13. MACS2 14. Output Directory B2
Load, set and save parameters
Five options (buttons) are provided: 1.
Save Parameters: To save the set parameters in the form of a text file, to reuse and share settings.
B3
User Login
2.
Load Parameters: To load saved settings in the form of a text file.
3.
Clear Parameters: To clear all parameter fields.
4.
Default Parameters: To load default parameters.
5.
Reset Paths: To apply modifications.
•
User requires entering name of the host (attached data cluster or name of the personal computer), user login name and password to let the IATAC successfully login into to host and access sample data files (“FASTQ”) and applications to perform data processing.
B4
Job Settings
Default job (set of instructions, written in the form of a script and executed like a program (executable software) to perform certain set of operations) related parameters. Furthermore I-ATAC provides eight different options to customize script generation and job submission: 1.
Multi Queued Job: Processes multiple samples at a time by generating and submitting parallel-multiple data processing jobs (one for each).
2.
Put in Single Queue: Processes one or multiple samples at a time b generating and submitting one data processing job (one for all.
3.
Merge Replicates: Applicable only in case of processing multiple samples at a time by submitting one data processing job for all. It enables selection of all generated “bam” files from all the preprocessed samples directories (bwa) and performs peak calling.
4.
Wall Time: Sets time to be allocated for the processing of the queued job. In case of multiple-parallel jobs, it will set provided time for all jobs.
5.
Nodes: Sets the number of nodes (connection points) requested for job.
13
Supplementary Material Default set node is 1. 6.
Processor per node (ppn): Sets the number of cores (virtual processors) per node per. Default set ppn is 1.
7.
Email: Sets to get notification (cancelled, completed) about the status of submitted job.
8.
Create & Queue Jobs: In case host is data cluster, then I-ATAC will prepare and submit jobs.
9.
Direct Processing: In case host is personal computer, then I-ATAC will prepare and submit instructions.
10. Creates soft links: Having checked this option, I-ATAC will create soft links of FASTQ files in to output directory. 11. Copy: Having checked this option, I-ATAC will create copy FASTQ files in to output directory. 12. *.gz ziiped files: Having checked this option, I-ATAC will expect input FASTQ files are zipped otherwise not.
202 203
S-Table. 2: Features description of GUI-A: Set Script Parameters.
204 205 206 207 208
The sole objective of developing I-ATAC is to help with the provision of interactive ATAC-seq data processing pipeline that is why; we have not developed features for file handling between data cluster and operating systems. There are already some interactive tools available for such purposes e.g. File Zilla (https://filezilla-project.org), WinSCP (http://winscp.net/eng/download.php), Cyberduck (https://cyberduck.io/?l=en) etc.
209
5
210 211 212 213
ATAC-seq data processing pipeline consists of different third party applications (S-Table. 4); I/O (input/output) redirected (one’s output is treated as another’s input, in terms of both data analysis and processing) and integrated method (S-Fig. 6). Additionally, it requires all needed compilers and interpreters to be downloaded and installed as well (S-Table. 4).
214
5.1
215 216 217 218 219 220 221
It is a command line based, non-interactive tool for the high throughput sequence data. It is programmed in Java and requires Java Runtime Environment and Picard BAM/SAM libraries to be installed in the data cluster. Its output is based on Basic Statistics, Per base sequence quality, Per tile sequence quality, Per sequence quality scores, Per base sequence content, Per sequence GC content, Per base N content, Sequence Length Distribution, Sequence Duplication Levels, Overrepresented sequences, Adapter Content and Kmer Content. FASTQC used version details, including input, output and download details are given in S-Table. 3, Row No.: 1.
Integrated Applications Details
FASTQC:
14
222
5.2
Trimmomatic
223 224 225 226 227 228 229
It is a command line based, non-interactive tool for the trimming of reads (Bolger et al., 2014) using paired-end and single ended data produced by the Illumina next generation sequencing technology (http://www.illumina.com/). It takes compressed or uncompressed FASTQ (phred-33 and phred-64 quality scores) file as input andmainly performs adapter filtering, sliding window trimming, base cutting (start and end of reads, as well, at specific number) and removes below quality reads. Trimmomatic’s used version details, including input, output and download details are given in STable. 3, Row No.: 2.
230
5.3
231 232 233 234 235
Burrows-Wheeler Alignment tool (BWA) is a software application for aligning short nucleotide sequences to a reference genome (Li and Durbin, 2009). It implements BWA-backtrack for reading sequence up to 100bp, and BWA-SW and BWA-MEM algorithms are for reading longer sequences between 70bp to 1Mbp. BWA’s used version details, including input, output and download details are given in S-Table. 3, Row No.: 3.
236
5.4
237 238 239 240 241
Sequence Alignment/Map (SAM) tools is a software package with various utilities, mainly used for sequence data formatting (Li, 2011; Li, et al., 2009). It helps in performing complex operations at sequence data files, including variant calling, alignment, sorting, indexing, viewing, data extraction and format conversion. SAMtools applied package’s version details, including input, output and download details are given in S-Table. 3, Row No.: 4.
242
5.5
243 244 245 246 247 248 249
It is Java based non-interactive tool, which requires Java Runtime Environment to execute. It is mainly used for the sequence data manipulation in sam and bam files. Both sam and bam files contain same data structure and format, sam is human readable, whereas, bam is machine-readable format (binary). It’s used version’s details, including input, output and download details are given in S-Table. 3. It performs sorting in order and can read information about library, platform, sample, sequence, predicted insert size etc. Picard’s used version details, including input, output and download details are given in S-Table. 3, Row No.: 5.
250
5.6
251 252 253 254 255 256 257
Browser Extensible Data (BED) tools (Quinlan and Hall, 2010) is a software application for converting “bam” to “bed” files and compare large sets of genomic features. Moreover, it can be used for converting BEDPE intervals to BAM and BAM to FASTQ, finding closest and potentially nonoverlapping interval, creating HTML pages to link UCSC locations, finding pairs that overlap other pairs and intervals in various ways, randomly redistributed and adjust size of intervals and tag bam alignment etc. BEDtools used version details, including input, output and download details are given in S-Table. 3, Row No.: 6.
258
5.7
259 260
ATAC_BAM_shifter_gappedAlign.pl is an open source Perl script, which can be used to perform read shifting based on the read quality. It takes aligned “bam” file as an input and offsets by 4bp for
BWA
SAMtools
Picard
BEDtools
ATAC_BAM_shifter_gappedAlign.pl
15
Supplementary Material 261 262 263 264 265
the positive strand (sequence containing instructions for building a protein) and –5bp for the negative strand (merely contains the complementary sequence and according to the base-pairing rules it is not normally transcribed into RNA nor translated into protein). Users can use any other tools for shifting the reads. ATAC_BAM_shifter_gappedAlign version details, including input, output and download details are given in S-Table. 3, Row No.: 7.
266
5.8
267 268 269 270 271
Model-based Analysis of ChIP-Seq (MACS) (Zhang, et al., 2008) is a tool for analyzing short reads for the spatial resolution of the predicted sites, capturing local biases in the genome and generation of peaks with detailed information about length, genome coordinates, summit, p-value, q-values, falsediscovery rate (FDR) and fold enrichment. MACS2’s used version details, including input, output and download details are given in S-Table. 3, Row No.: 8.
MACS2
272 No.
1
Applications
Versions
FASTQC
0.11.2
Download Web links
http://www.bioinformatics.b
Input File
Outputs File
Formats
Formats
FASTQ
html, zip, txt.
FASTQ
FASTQ,
abraham.ac.uk/projects/fast qc/ 2
Trimmomatic
0.32
ms/?page=trimmomatic
(Bolger et al., 2014) 3
http://www.usadellab.org/c
Burrows-Wheeler Alignment
0.7.10
tool (BWA)
http://bio-
trimU.fastq,
fastq_filtered
sam
sam
Sam. txt, pdf
sam, bam
sam, bam
bam
bed
bam
bam
bwa.sourceforge.net
(Li and Durbin, 2009) 4
Sequence
Alignment/Map
0.1.19
(SAM) tools
http://samtools.sourceforge. net
(Li, 2011; Li, et al., 2009) 5
Picard
1.95
http://broadinstitute.github.i o/picard/
6
Browser
Extensible
Data
2.22.0
(BED) tools
org/en/latest/content/overvie w.html
(Quinlan and Hall, 2010) 7
ATAC_BAM_shifter_gappe dAlign
http://bedtools.readthedocs.
1
https://github.com/acdaughe rty/scripts/blob/master/Most Used/ATAC_BAM_add1.pl
16
8
Model-based
Analysis
ChIP-Seq (MACS)
of
2.1.0.20151
http://liulab.dfci.harvard.ed
222
u/MACS/
bed
bdg,
broadPeak, gappedPeak
(Zhang, et al., 2008)
273
bed,
S-Table. 3: Integrated applications in I-ATAC data processing pipeline No.
Compiler / Interpreter
Versions
Download Web links
1
JAVA
8
https://www.java.com/en/download/
2
R
3.2.3
https://www.r-project.org
3
Perl
5.10.1
https://www.perl.org
4
Python
2.7.3
https://www.python.org
274
S-Table. 4: Needed compilers and interpreters
275
6
276 277 278
The software executable (JAR file) is open source and freely available and to execute I-ATAC, major requirement is the installation of Java Runtime Environment (http://www.oracle.com/technetwork/java/javase/downloads/jre8-downloads-2133155.html).
Installation and Configuration
279 280
S-Fig. 9A: I-ATAC, parameters and protocol settings. 17
Supplementary Material
281 282
S-Fig. 9B: I-ATAC, default setting.
283 284
S-Fig. 9C: I-ATAC, user setting, loaded from “settings-iatac-v101.iatac”.
18
285 286 287 288
After executing I-ATAC and before starting data processing, it is important to set valid applications paths and calling protocols (section: Graphical User Interface of I-ATAC). Our default parameters (S-Fig. 9A, 9B and 9C) are set according to our data cluster and installed versions of application (STable. 3), and Compilers/Interpreters (S-Table. 4).
289 290 291
Using default configuration settings; I-ATAC will consider logged-in user with a default directory of same name as of user in the data cluster (e.g. Zeehan “d:/data/Zeeshan/ATAC_PROJECTS/”). However, user can alter, reset and save default project directory settings.
292
7
293 294 295 296 297 298 299 300 301 302 303
In order to validate the performance of I-ATAC and to guide the users, we present two case studies. First involves using the example data; where we have created small size example dataset (provided in supplementary material and can be downloaded from the following web link: https://zenodo.org/record/46079#.VsJMg7S5LHM) with artificial names (to explain the process, execution steps in simpler way.). The reason for giving example study is to let the user, use the application and observe results in possible shortest time. Moreover, it will also help in figuring out and resolving trouble shooting conditions (e.g. could be due to inappropriate installation of downloaded application and compilers/interpreter or any other exceptional reason etc.). Second study is using publically available data (GM12878, CD4); where we have processed publically available data, which a trained user can download and process using I-ATAC. In both case studies, I-ATAC is run at the Mac-OS-X-Yosemite 10.10.5 platform.
304
7.1
305
7.1.1 Dataset Details
306 307 308
Raw dataset and produced results mentioned in this example case study, which can be downloaded from the provided project web link. Sequenced, paired sample data (“FASTQ” or “FASTQ.gz”) files are need to be collected and placed in the attached data cluster.
309
7.1.2 Input
310
The input to I-ATAC is the path to ATAC-seq sample data, which in our case is:
311 312 313 314 315 316 317
Case Studies
Example Dataset
“/data/zahmed/ATAC_PROJECTS/gz_fastq_files”
As shown in S-Fig. 10, there are two samples available (paired data, four “FASTQ” zipped files) in the above-mentioned directory i.e. “gz_fastq_files”, which are: Firt_SampleData_R1.fastq.gz Firt_SampleData_R2.fastq.gz Second_SampleData_R1.fastq.gz Second_SampleData_R2.fastq.gz
19
Supplementary Material
318 319
S-Fig. 10: Screen shot (Linux Terminal, using Mac-OS-X) of compressed sample data files
320 321 322
After setting parameters and input path to the I-ATAQ-seq, pressed button “Run ATAC-seq”, an information message will appear (S-Fig. 11) to verify the input sample data source location, output directory location and set job parameters.
323 324
S-Fig. 11: I-ATAC, input sample data and set parameters’ verification
20
325 326
S-Fig. 12: I-ATAC, identified sample data
327 328 329 330
At successful verification, file status window (S-Fig. 12) provides the information about located sample data files, which were copied, pasted and unzipped in the project directory (Example_with_gz_files). At second successful verification, the ATAC-seq data processing pipeline was automatically scripted (S-Fig. 13) and created job was queued to the data cluster (S-Fig. 14).
331 332
S-Fig. 13: I-ATAC automatically generated script
S-
21
Supplementary Material
333 334
S-Fig. 14: I-ATAC job queued.
335
7.1.3 Output
336 337 338
After the successful execution of the ATAC-seq data processing pipeline, the system’s generated output can be located in the mentioned output directory (S-Fig. 15). The project directory contains automatically generated and run script:
339 340
Example_with_gz_files_Example_with_gz_files.sh
copied, pasted and unzipped “FASTQ” files:
341 342 343 344 345 346 347 348 349 350 351 352
Firt_SampleData_R1.fastq Firt_SampleData_R2.fastq Second_SampleData_R1.fastq Second_SampleData_R2.fastq
and sub-directories: Example_with_gz_files_Firt_SampleData_R1_Firt_SampleData_R2, Example_with_gz_files_Second_SampleData_R1_Second_SampleData_R2, MergedSamples
The output files were placed in proposed system’s automatically created sub-directory structure (Section: Applications integration, data processing pipeline and project’s directory structure), as shown in S-Fig. 14. We also input two samples and asked system to produce merged replicates as well. So, we observed results for both samples as well as merged replicates.
353 22
354 355 356
S-Fig. 15: Screen shot (Linux Terminal, using Mac-OS-X) of produced I-ATAC output project directory and files
357 358
The produced results from First_SampleData are shown in S-Fig. 16, including quality reports in FASTQC directory, which are:
359 360 361 362 363 364 365 366 367 368 369 370 371 372 373 374 375 376 377 378 379
Firt_SampleData_R1_fastqc.html Firt_SampleData_R1_fastqc.zip Firt_SampleData_R2_fastqc.html Firt_SampleData_R2_fastqc.zip
trimmed “FASTQ” files in trimmomatic directory, which are: Firt_SampleData_R1.fastq_filtered Firt_SampleData_R1.trimU.fastq Firt_SampleData_R2.fastq_filtered Firt_SampleData_R2.trimU.fastq
all sorted, shifted and indexed “sam” and “bam”, “bed” and related files are placed in “bwa” directory, which are: Example_with_gz_files_Firt_SampleData_R1_Firt_SampleData_R2.sam Example_with_gz_files_Firt_SampleData_R1_Firt_SampleData_R2_sorted.sam Example_with_gz_files_Firt_SampleData_R1_Firt_SampleData_R2_rmdup.sam Example_with_gz_files_Firt_SampleData_R1_Firt_SampleData_R2_rmdup_shifted.bam Example_with_gz_files_Firt_SampleData_R1_Firt_SampleData_R2_rmdup_shifted_sorted.bam Example_with_gz_files_Firt_SampleData_R1_Firt_SampleData_R2_rmdup_shifted_sorted.bam.bai Example_with_gz_files_Firt_SampleData_R1_Firt_SampleData_R2_rmdup_shifted_sorted.bam_sorted.bed Example_with_gz_files_Firt_SampleData_R1_Firt_SampleData_R2_rmdup_metrics.txt Example_with_gz_files_Firt_SampleData_R1_Firt_SampleData_R2_rmdup_metrics.pdf Example_with_gz_files_Firt_SampleData_R1_Firt_SampleData_R2_rmdup_insertSize.txt
380
and all produced results at peak calling were placed in “macs2” directory, which are:
381 382 383 384 385 386 387 388 389
Example_with_gz_files_Firt_SampleData_R1_Firt_SampleData_R2_rmdup_shifted_sorted.bam_sorted_control_lambda .bdg Example_with_gz_files_Firt_SampleData_R1_Firt_SampleData_R2_rmdup_shifted_sorted.bam_sorted_peaks.broadPea k Example_with_gz_files_Firt_SampleData_R1_Firt_SampleData_R2_rmdup_shifted_sorted.bam_sorted_peaks.gappedPe ak Example_with_gz_files_Firt_SampleData_R1_Firt_SampleData_R2_rmdup_shifted_sorted.bam_sorted_peaks.xls Example_with_gz_files_Firt_SampleData_R1_Firt_SampleData_R2_rmdup_shifted_sorted.bam_sorted_treat_pileup.bd g
390
23
Supplementary Material
391 392 393
S-Fig. 16: Screen shot (Linux Terminal, using Mac-OS-X) of produced I-ATAC output files for Firt_SampleData
394
Likewise, First_SampleData, the produced results from Second_SampleData are shown in S-Fig. 17.
395 396 397
S-Fig. 17: Screen shot (Linux Terminal, using Mac-OS-X) of produced I-ATAC output files for Second_SampleData
398
The produced results from merged samples are shown in S-Fig. 18.
24
399 400 401
S-Fig. 18: Screen shot (Linux Terminal, using Mac-OS-X) of produced I-ATAC output files for Merged Samples
402
7.2
403
7.2.1 Dataset Details
404 405 406 407 408
Information about Raw dataset (GM12878 – CD4 T- Cell, Day 1, Rep1 SRR891275 and Rep2 SRR891276) is available at web link (https://catalog.coriell.org/0/Sections/Search/Sample_Detail.aspx?Ref=GM12878&product=CC and produced results, which are mentioned in this case study can be downloaded from the following project web link.
409
7.2.2 Input
410
The input to I-ATAC is the path to ATAC-seq sample data (S-Fig. 19), which in our case is:
411 412
Case Study 2: Using GM12878 – CD4 T- Cells
“/data/zahmed/ATAC_seq_data/CD4”
413 414 415
S-Fig. 19: Screen shot (Linux Terminal, using Mac-OS-X) of compressed sample data files of GM12878 – CD4 T- Cell, Day 1, Rep1 SRR891275 and Rep2 SRR891276.
416 417
Likewise, earlier discussed case study, at successful identification and verification of sample data files (S-Fig. 20), data processing job was created (S-Fig. 21) and successfully queued (S-Fig. 22).
418
25
Supplementary Material
419 420 421 422 423
S-Fig. 20: I-ATAC, input sample data, set parameters and verification /data/zahmed/ATAC_PROJECTS/CD4 GM12878_CD4_Day1
424 425
S-Fig. 21: I-ATAC generated script
26
426
7.2.3 Output
427 428
As in the earlier discussed case study, all the produced results were placed in the proposed and auto generated directory structure (S-Fig. 22, 23and 24).
429 430 431
S-Fig. 22: Screen shot (Linux Terminal, using Mac-OS-X) of produced I-ATAC output main project directory and files, and for sample CD4+_ATACseq_Day1_Rep1_SRR891275
432 433 434
S-Fig. 23: Screen shot (Linux Terminal, using Mac-OS-X) of produced I-ATAC output files for sample CD4+_ATACseq_Day1_Rep2_SRR891276
435 27
Supplementary Material
436 437 438
S-Fig. 24: Screen shot (Linux Terminal, using Mac-OS-X) of produced I-ATAC output files for Merged Samples
439 440 441 442 443 444
Quality stats produced by the FASTQC (at CD4+_ATACseq_Day1_Rep1_SRR891275) are shown in S-Fig. 26, which are: Basic Statistics (S-Fig. 25. A), Per base sequence quality (S-Fig. 25. B), Per tile sequence quality (S-Fig. 25. C), Per sequence quality scores (S-Fig. 25. D), Per base sequence content (S-Fig. 25. E), Per sequence GC content (S-Fig. 25. F), Per base N content (S-Fig. 25. G), Sequence Length Distribution (S-Fig. 25. H), Sequence Duplication Levels (S-Fig. 25. I), Adapter Content (S-Fig. 25. J) and Kmer Content (S-Fig. 25. K).
445 446
(A)
28
447 448
(B)
(C)
(D)
(E)
(F)
(G)
449 450
451 452
29
Supplementary Material
453 454
(H)
(I)
456
(J)
(K)
457 458
S-Fig. 25. Statistics and quality results produced by the FASTQC for the CD4+_ATACseq_Day1_Rep1_SRR891275.
455
30
459 460 461
S-Fig. 26. Example Visualization of “bam” files (CD4+_ATACseq_Day1_Rep1_SRR891275, CD4+_ATACseq_Day1_Rep2_SRR891276 and GM12878_CD4_Day1_mergedSample) using IGV.
462 463 464
S-Fig. 27 Example Visualization using “bdg” file (GM12878_CD4_Day1_mergedSample_sorted_control_lambda.bdg) using USCS Genome Browser. 31
Supplementary Material 465 466 467 468 469 470
The detailed output of samples a CD4+_ATACseq_Day1_Rep1_SRR891275 and CD4+_ATACseq_Day1_Rep2_SRR891276 are attached in the supplementary material. Example visualization of produced results is created by visualizing sorted „bam“ files (CD4+_ATACseq_Day1_Rep1_SRR891275, CD4+_ATACseq_Day1_Rep2_SRR891276 and GM12878_CD4_Day1_mergedSample) using IGV (S-Fig. 26) and peak file (CD4+_ATACseq_Day1_Rep1_SRR891275) using USCS Genome browser (S-Fig. 27).
471
8
472 473 474 475 476
To the best of our knowledge, I-ATAC platform is the first desktop tool that is specialized to processing and analysis of ATAC-seq data. I-ATAC provides a flexible algorithm and parameter setting GUI for non-computational scientists and a time-efficient parallel data analysis environment for computational scientists. Future work includes incorporating visualization and differential analysis modules in I-ATAC platform.
477
9
478 479 480 481
The Jackson Laboratory (JAX) supports and owns this project. Special thanks to Ucar and Banchereau labs as well as the Genome Technologies and Computational Sciences cores at JAX, who provided insight and expertise that greatly, assisted the research and development of this platform.
482
10
483
This work was supported by The Jackson Laboratory, USA.
484
11
485
The authors declare that they have no competing interests.
486
12
487 488
For additional information, please refer to the project webpage: https://www.jax.org/research-andfaculty/tools/i-atac
489 490
Source code, JAR files for MAC OS X and Windows, and complete source code package for Eclipse IDE is available at https://github.com/UcarLab/I-ATAC
491
Example dataset is available at: https://zenodo.org/record/46079#.WAe3l5MrK7Y
492 493
Supporting software and dependencies are available at: https://zenodo.org/record/162023#.WAe3dJMrK7Y
494
13
495 496
Conclusions
Acknowledgments
Funding:
Conflict of Interests:
Additional Requirements
References •
Ahmed, Z., Zeeshan, S., Dandekar, T. (2014) Developing sustainable software solutions for bioinformatics by the “Butterfly” paradigm. F1000Res., 3, 71.
32
497 498 499
•
Bao, X., et al. (2015) A novel ATAC-seq approach reveals lineage-specific reinforcement of the open chromatin landscape via cooperation between BAF and p63. Genome Biology, 16, 284
500 501
•
Buenrostro, J.D., et al. (2015a) A Method for Assaying Chromatin Accessibility GenomeWide. Curr Protoc Mol Biol., 109:21.29, 1-9.
502 503
•
Buenrostro, J.D., et al. (2015b) Single-cell chromatin accessibility reveals principles of regulatory variation. Nature, 523, 486–490.
504 505 506
•
Buenrostro, J.D., et al. (2013) Transposition of native chromatin for fast and sensitive epigenomic profiling of open chromatin, DNA-binding proteins and nucleosome position. Nat Methods., 10, 1213-1218.
507 508
•
Bolger, A.M., Lohse, M., Usadel, B. (2014) Trimmomatic: a flexible trimmer for Illumina sequence data. Bioinformatics, 30, 2114-20.
509 510
•
Li, H. and Durbin, R. (2009) Fast and accurate short read alignment with Burrows-Wheeler Transform. Bioinformatics, 25, 1754-60.
511 512
•
Li, H., et al. (2009) The Sequence alignment/map (SAM) format and SAMtools. Bioinformatics, 25, 2078-2079.
513 514 515
•
Li, H. (2011) A statistical framework for SNP calling, mutation discovery, association mapping and population genetical parameter estimation from sequencing data. Boinformatics. 27, 2987-2993.
516 517
•
Miskimen, K.L., Chan, E.R., Haines, J.L. (2017) Assay for transposase-accessible chromatin using sequencing (ATAC-seq) data analysis. Curr. Protoc. Hum. Genet. 92, 20.4.1-20.4.13.
518 519
•
Moskowitz, D. M., et al. (2017) Epigenomics of human CD8 T cell differentiation and aging. Sci. Immunol., 2, eaag0192.
520 521
•
Quinlan, A. R. and Hall, I. M. (2010) BEDTools: a flexible suite of utilities for comparing genomic features. Bioinformatics. 26, 841-842.
522 523
•
Tsompana, M and Buck, M. J. (2014) Chromatin accessibility: a window into the genome. Epigenetics & Chromatin., 7, 33.
524
•
Zhang, Y., et al. (2008) Model-based analysis of ChIP-Seq (MACS). Genome Biol., 9, R137.
33