Supplementary Material Identification and Expression Analysis of the Complete Family of Zebrafish pkd Genes Samantha J. England, Paul C. Campbell, Santanu Banerjee, Annika J. Swanson, and Katharine E. Lewis* * Correspondence: Professor K. E. Lewis. Email:
[email protected]
1
Supplementary Material 1
Supplementary Figures and Tables
1.1
Supplementary Figures
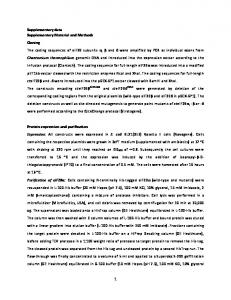
Supplementary Figure 1: Alignment of polycystin-cation-channel domain from different vertebrate PKD1-like proteins. Comparison of the amino acid sequences for the polycystin-cation-channel domains of human (Homo sapiens, hsa), mouse (Mus musculus, mmu), zebrafish (Danio rerio, dre), medaka (Oryzias latipes, ola), green spotted pufferfish (Tetraodon nigroviridis, tni), stickleback (Gasterosteus aculeatus, gac), spotted gar (Lepisosteus oculatus, loc) and elephant shark (Callorhinchus milii, cmi) PKD1-like proteins using Clustal Omega (version 1.2.3). This figure shows the region of the polycystin-cationchannel domain that is present in all of the proteins and was used to construct the phylogenetic tree in Fig. 3A. Different families of PKD1-like proteins are color-coded with the same color. This same color-coding is used in Figure 3. Numbers on either side of each sequence, indicate amino acid positions in the full-length sequences of each protein.
2
3
Supplementary Material
4
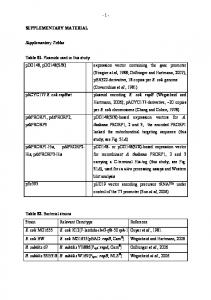
Supplementary Figure 2: Alignment of polycystin-cation-channel domain from different PKD2like proteins. Comparison of the amino acid sequences for the polycystin-cation-channel domains of human (Homo sapiens, hsa), mouse (Mus musculus, mmu), zebrafish (Danio rerio, dre), medaka (Oryzias latipes, ola), green spotted pufferfish (Tetraodon nigroviridis, tni), stickleback (Gasterosteus aculeatus, gac), spotted gar (Lepisosteus oculatus, loc), elephant shark (Callorhinchus milii, cmi) and Drosophila melanogaster (dme) PKD2-like proteins using Clustal Omega (version 1.2.3). This figure shows the region of the polycystin-cation-channel domain that is present in all of the proteins and was used to construct the phylogenetic tree in Fig. 3B. Different families of PKD2-like proteins are color-coded with the same color. This same color-coding is used in Figure 3B. Numbers on either side of each sequence, indicate amino acid positions in the full-length sequences of each protein.
5
Supplementary Material
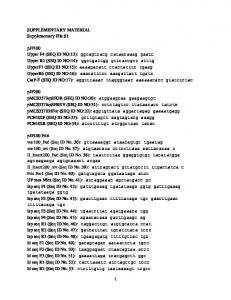
Supplementary Figure 3: Spinal cord expression of zebrafish pkd genes Lateral views of additional stages of pkd spinal cord expression not included in other figures. Rostral left, dorsal up. By 36 h, pkd1b is expressed in two ventral rows of cells in the spinal cord (A). This expression persists at 4 dpf (B). pkd1l2a and pkd2l1 are co-expressed in KA cells (C-F) and occasional weak more dorsal cells (asterisks D & E). pkd1, pkd1l1, pkd1l2b and pkd2 are not expressed in spinal cord (G-Z). Scale bar (A) = 50 µm.
6
1.2
Supplementary Tables
Primer Name
Forward Primer Sequence
Reverse Primer Sequence
Annealing Temperature (oC)
pkd1_Map_ Nested Set 1 pkd1_Map_ Nested Set 2 pkd1_Map_ Set 3 pkd1_Map_ Set 4 pkd1_Map_ Set 5 pkd1_Map_ Set 6 pkd1_Map_ Set 7 pkd1_Map_ Set 8 pkd1_Map_ Set 9 pkd1l2a_Map_ Set 1 pkd1l2a_Map_ Set 2 pkd1l2a_Map_ Set 3 pkd1l2a_Map_ Set 4 pkd1l2a_Map_ Set 5 pkd1l2a_Map_ Set 6
GTGCAGCACCAACTCTGAG
CATGAAAACACTTGGAGTTGCAC
62.0
PCR Extension Time (Seconds) 100
CACCAACTCTGAGCCCAATCAC
GAGGACGAGAAGATGACCAGC
68.0
100
AGGAGCTAGATCTGAGCAACAAC
CCTCTCTGCCATCCTTACTGATC
66.0
60
ACGTGTGTGTGTCTCTGGAC
61.0
60
ATTCAGAAAGGGCTCACACTGAC
GGATCCATTAACCCTCACTAAAGGGAAC TGTACTCTGGGTATTGTGTGC § CAGAGAATTGTGGGAGTTGTGC
69.0
60
AGAGGACAGGAAAGAGCAAGAAG
CAAACGGGACTTCATGAGGATTG
67.0
60
CAATCCTCATGAAGTCCCGTTTG
CTGACATACAATCGCCACAGAAC
68.0
60
TATTCTGGTGGGCTGTTCTGATG
GTCAGTCACTCAACAACAACCTC
66.0
60
GGTCAGTGATCAGCTAGTAGTGC
TTCTGAGGAAGCGCAAACTCTC
65.0
60
GTGCTGATCATAATGCTACGCTTC
CTAAAGAGCGGCCAGACTCAAAC
69.0
60
CTGCTATGAGTTTGTGGAGTTGC
CTGTGCTTCCATGCTGAACTTTG
68.0
60
GCTGATCATAATGCTACGCTTCAG
GATATTGAGGACTCGCACCGGAC
69.0
60
CAGCCCACAAAACCATCACTATC
CATCATCTGGTGTGTCTCGGAG
69.0
60
TCTGAATGAGGTGACGGCAG
CCCATTTGCATTGGTCGATACAG
67.0
100
TCTGAATGAGGTGACGGCAG
ATGCTTCTGATGGCTTCTCAGTC
66.0
100
Transcript Exons Mapped 1-595 bp of transcript+^ 1-595 bp of transcript+^ 527-1143 bp of transcript^ 1575-2154 bp of transcript^ 2122-2920 bp of transcript^ 13121-14065 bp of transcript^ 14102-15014 bp of transcript^ 15527-16413 bp of transcript^ 17453-18305 bp of transcript^ pkd1l2a exons 1-2* pkd1l2a exons 2-6 pkd1l2a exons 3-7 pkd1l2a exons 6-7 pkd1l2a exons 7-10 pkd1l2a exons 7-13
7
Supplementary Material pkd1l2a_Map_ Set 7 pkd1l2a_Map_ Set 8 pkd1l2a_Map_ Set 9 pkd1l2a_Map_ Set 10 pkd1l2a_Map_ Set 11 pkd1l2b_Map_ Nested Set 1 pkd1l2b_Map_ Nested Set 2 pkd1l2b_Map_ Set 3 pkd1l2b_Map_ Set 4 pkd1l2b_Map_ Set 5 pkd1l2b_Map_ Set 6 pkd1l2b_Map_ Set 7 pkd1l2b_Map_ Set 8
CAAATGAAAGAGGACAGCAGCTC
AAAGAACATCAGAGCCCAGAGAG
68.0
60
TGTAACGCTCCCTATCCTCTTTC
AATTAACCCTCACTAAAGGGAGCGCCTA CAAAACACACCAC§ GAGTACAAGAGCAAAGAAGACTGC
67.0
100
65.0
100
68.0
60
TTATGTCGGATTCCTCTGGATGC
AATTAACCCTCACTAAAGGGAGCACCTC ACTTCGATATTGGAAC§ TTTCCACTCAGAAAAGCTGACA
67.0
100
ATCCAGAATGATGAAACCCAGC
CACGGTCACAAACTCATAGCAG
68.0
100
pkd1l2a exons 13-18 pkd1l2a exons 13-23 pkd1l2a exons 22-29 pkd1l2a exons 30-34 pkd1l2a exons 33-41 pkd1l2b exon 1+
GGACTGGTGGATTGGACTTGTG
CAAAAGACTGCTGGTTCTCTGTG
68.0
100
pkd1l2b exon 1+
ATCCAGAATGATGAAACCCAGC
TGGAGCGGTTCAGAGTCCTC
66.0
60
TGAGCAAAGATGAGGTGAAGAGC
AACCCGTGATGAAGTGGAAGATC
70.0
100
TCCATATGTTACCCAGTGTCTGTG
TGAGGAGGCTCAGACTTCTTC
66.0
60
TGCTGCTCTGCTCTATGTTGAC
ACTTCTTCATCCTCGGCTTCAAC
68.0
60
CTTCACCGAGCCTGTAAAAGTTG
GGCCATGAGAAAGGACATAAAGC
69.0
60
CCGTGTACAATGCTAATGTCGATC
CACGTCAATGACCGGGATTATG
69.0
60
pkd1l2b exons 2-9 pkd1l2b exons 9-18 pkd1l2b exons 18-21 pkd1l2b exons 22-23 pkd1l2b exons 24-28 pkd1l2b exons 29-34
CTTCAGCACTGTGGTCATCAAC GTCAGAGGCCAGTGAAAAGAAAG
Supplementary Table 1. PCR Primers for mapping pkd1, pkd1l2a and pkd1l2b mRNA transcripts PCR primers and conditions used to amplify and sequence overlapping fragments of zebrafish pkd1, pkd1l2a and pkd1l2b transcripts (genes for which annotations in Ensembl are incomplete). Column 1 lists names given to each primer set. Columns 2 and 3 list PCR primers used to map transcript region indicated in column 6. Columns 4 and 5 list annealing temperatures and extension times of PCR protocols used in each case. The rest of the protocol is provided in materials and methods. *These primers were used on a circularized cDNA product following inverse PCR to generate 5’ sequence. +These primers were used in a series of nested PCR reactions. Nested Set 1 primers were used on a circularized cDNA product following inverse PCR to generate 5’ sequence. Nested Set 2 primers were used in reactions seeded with the Nested Set 1 PCR product. See materials and methods for details. § These reverse primers contain sequence for T3 RNA Polymerase 8
promoter at their 5’ end, since they were also used to generate in situ hybridization riboprobes (see Supplementary Table 3 for riboprobe primers). ^ Since some of our mapped sequence data is not present in the current Ensembl chromosome 1 genomic sequence (GRCz10), we cannot map all exon boundaries for pkd1 and so instead we show the base pair locations within the mapped mRNA transcript that were amplified and sequenced by these primers (see Figure 1 text for further information).
Gene-Specific Primer pkd1 pkd1l2a pkd1l2b
Primer Sequence CGGCACTCCTTCATGACGAG CTGTGGAGATGTTTGTGAAGGAG GTCCAAGATGCGATTGTCAGATG
Supplementary Table 2. PCR Primers for Inverse PCR Sequences of gene-specific reverse primers used in first strand cDNA synthesis during inverse PCR for pkd1, pkd1l2a and pkd1l2b transcripts (see materials and methods for further details).
9
Gene Name
Forward Primer Sequence
Reverse Primer Sequence
pkd1 – Set 1* pkd1 – Set 2 pkd1b pkd1l1 – Set 1 pkd1l1 – Set 2 pkd1l2a – Set 1 pkd1l2a – Set 2 pkd1l2b pkd2 pkd2l1
ACGTGTGTGTGTCTCTGGAC CTCCAGCTACATATCAGTGGGAC GTTCTTGGACTGTGAGCATTGTC GCGTGTCCCTCTGTCTTACATG GTGATTCTCCAGTTTGTCCTGTAC GTCAGAGGCCAGTGAAAAGGAAG CGTGACTGCGCCCAATATATC CTGTTTGGGGTTTAACTGCACTG CTTACTCTGAGGTGAAAGCTGAC CAGAGGCTGGTTCACAAAGTTTC
GGATCCATTAACCCTCACTAAAGGGAACTGTACTCTGGGTATTGTGTGC AATTAACCCTCACTAAAGGGAATCTAGAACCAGCGTCTCGTTAC AATTAACCCTCACTAAAGGGATCATGGGAGGTCAAAAGAGTCAC AATTAACCCTCACTAAAGGGAGTCCAGTTCCACCAATCATCATG AATTAACCCTCACTAAAGGGAGTTCACAACAATGCCAAGGAGTG AATTAACCCTCACTAAAGGGAGCACCTCACTTCGATATTGGAAC AATTAACCCTCACTAAAGGGAGCGCCTACAAAACACACCAC AATTAACCCTCACTAAAGGGAATTACCAGTTCCACGGTTTCCTC AATTAACCCTCACTAAAGGGAGTTTTCACAAATAAACACCCCTCAC AATTAACCCTCACTAAAGGGAGCCTGATACAGTTGAAATTCCCAG
PCR Product Size (bp) 580 1007 963 604 447 1136 501 982 878 553
Supplementary Table 3. PCR primers for creating in situ hybridization riboprobes Primer sequences used to generate riboprobes for in situ hybridization. Expected PCR product sizes (in base pairs) are indicated in column 4. * indicates primers published in Coxam et al., (2014). All other riboprobe primers were designed during this study. T3 RNA polymerase promoter sequence at 5’ end of each reverse primer is bold and underlined. pkd1 – Set 1, pkd1l1 – Set 1 and pkd1l2a – Set 1 primers generated riboprobes that gave the strongest expression in our assays and so were used exclusively in this study. See materials and methods for further information.
10
Species Zebrafish Green Spotted Pufferfish Medaka Stickleback
Percentage Amino Acid Identity to Full-Length Mouse PKD1L3 Protein aa 976-1120 (29%), 1148-1236 (37%), 1258-1316 (39%) and 1529-1601 (38%) aa 1004-1127 (34%), 1108-1208 (40%), 1209-1312 (38%) and 1539-1595 (46%) aa 976-1044 (31%), 1037-1116 (40%), 1148-1209 (55%) and 1209-1312 (30%) aa 1037-1168 (35%), 1113-1209 (33%), 1206-1257 (38%), 1255-1312 (46%) and 15291594 (43%)
Supplementary Table 4. Percentage Amino Acid Identity Between Full-Length Mouse PKD1L3 Protein and Teleost Putative pkd1l3 Orthologs Results obtained from blasting full-length mouse PKD1L3 against teleost genomes. Regions of the mouse query sequence that have identity with sequences in respective teleost genomes are indicated by amino acid (aa) numbers and percentage amino acid sequence identity is indicated in parentheses. Numbers in bold correspond to regions of the mouse PKD1L3 query sequence that contain at least part of the GPS motif (amino acids 1020-1058) or PLAT/LH2 domain (amino acids 1131-1245).
11
Supplementary Material Species
Current Ensembl Gene Name
Ensembl Gene ID
Chromosome Location
Supporting Evidence
Spotted gar
pkd1
ENSLOCG00000002998
LG13(+): 4728181-4832181
Elephant shark
pkd1 (two pkd1 genes in genome)
SINCAMG00000009812
Scaffold_312(+): 34635-113581
Shares synteny with teleost and mammalian pkd1 genes (data not shown). Phylogeny (Fig. 3A). Shares synteny with teleost and mammalian pkd1 genes (data not shown). Phylogeny (Fig. 3A).
Spotted gar
pkd1b
ENSLOCG00000010726
LG10(-): 27484014-27547534
Elephant shark
pkd1 (two pkd1 genes in genome)
SINCAMG00000001332
Scaffold_10(+): 2273648-2326286
Spotted gar
Novel
ENSLOCG00000013313
LG9(+): 50517659-50554155
Elephant shark
pkd1l1
SINCAMG00000004987
Scaffold_55(+): 2766931-2840140
Spotted gar
Novel
ENSLOCG00000003938
LG23(+): 6943671-6977736
Elephant shark
pkd1l2
SINCAMG00000003573
Scaffold_12(-): 2515744-2542623
pkd1
pkd1b Shares synteny with green spotted pufferfish and stickleback pkd1b genes (data not shown). Phylogeny (Fig. 3A). Does not share synteny with teleost pkd1b genes (data not shown). Formerly called pkd1 but phylogeny suggests that this gene is pkd1b (Fig. 3A).
pkd1l1 Shares synteny with zebrafish pkd1l1 gene (data not shown). Shares homology with amino acids 205-642, 859-908, 1303-1400 and 1495-1607 of mouse PKD1L1 protein. Phylogeny (Fig. 3A). Shares synteny with amniote PKD1L1 genes (data not shown). Phylogeny (Fig. 3A).
pkd1l2 Shares synteny with all teleost pkd1l2a genes (data not shown). Shares homology with amino acids 4525, 1239-1667 and 1804-2410 of mouse PKD1L2 protein. Phylogeny (Fig. 3A). Shares synteny with amniote PKD1L2 genes (data not shown). Phylogeny (Fig. 3A).
12
pkd1l3 Spotted gar
Novel
ENSLOCG00000004480
LG23(+): 8258413-8268971
pkdrej pkdrej
ENSLOCG00000016654 SINCAMG00000010353
LG8(+): 40852661-40859002 Scaffold_35(-): 5337490-5343965
Phylogeny (Fig. 3A). Shares synteny with mammalian PKDREJ genes (data not shown). Phylogeny (Fig. 3A).
Spotted gar
pkd2
ENSLOCG00000013447
LG4(-): 66726806-66740815
Elephant shark
polycystin 2
SINCAMG00000010189
Scaffold_21(+): 1937754-1973648
Shares synteny with green spotted pufferfish, stickleback and medaka pkd2 genes (data not shown). Phylogeny (Fig. 3B). Shares synteny with green spotted pufferfish, stickleback and medaka pkd2 genes (data not shown). Phylogeny (Fig. 3B).
Spotted gar
pkd2l1
ENSLOCG00000011334
LG5(+): 28795999-28813061
Elephant shark
pkd2l1
SINCAMG00000015409
Scaffold_3(+): 6986034-6999417
pkd2l2
ENSLOCG00000011380
LG6(-): 32405994-32414168
Elephant shark
No homology with the polycystin-cation-channel domains of zebrafish Pkd proteins or mouse PKD1L3 protein. Shares homology with amino acids 1037-1333 and 1525-1594 of mouse PKD1L3 protein (containing the GPS and PLAT/LH2 domains). Shares synteny with mammalian and teleost PKD1L3 genes (data not shown). All PKD1L3 genes examined in this study are syntenic with the DHODH gene. In the elephant shark, dhodh is present on Scaffold_12 and is also flanked by the genes znf821 and atxn11, which also surround the mammalian PKD1L3 genes. Tblastn analysis with either the polycystin-cation-channel domains of zebrafish PKD proteins or the full-length mouse PKD1L3 protein failed to detect any hits adjacent to these genes on Scaffold_12 in the elephant shark genome, although we cannot rule out the possibility that a pkd1l3 ortholog might exist elsewhere in the genome.
pkdrej Spotted gar Elephant shark
pkd2
pkd2l1 Shares synteny with all teleost pkd2l1 genes examined (data not shown). Phylogeny (Fig. 3B). Unusual synteny, as is flanked by abcg2, which is adjacent to all PKD2 genes examined in this study. However, it is also flanked by mypn1, sirt1 and dnajc12, which flank green spotted pufferfish and medaka pkd2l1 genes (data not shown). Phylogeny (Fig. 3B).
pkd2l2 Spotted gar
Doesn’t share synteny with mammalian PKD2L2 genes. Phylogeny (Fig. 3B).
13
Supplementary Material
pkd2l2 Elephant shark
polycystic kidney disease 2
SINCAMG00000005264
Scaffold_87(+): 2858280-2865700
Shares no synteny with mammalian and teleost PKD2 genes. Does share synteny with mammalian PKD2L2 genes (data not shown). Phylogeny (Fig. 3B).
Supplementary Table 5. Characterization of pkd genes in the genomes of holostei and cartilaginous fish. Column one indicates the species. Column 2 lists gene name used in current Ensembl genome assembly (see materials and methods). Column 3 lists Ensembl gene ID. Column 4 shows position in current version of appropriate genome. Column 5 lists data that support the annotations shown here (see results for more info). pkd genes were first identified by performing textual searches of the appropriate genome assembly and their synteny and phylogeny examined (data not shown, Fig. 3A-B). We then searched for additional pkd genes that are present in either mammalian or teleost genomes, but had not been identified by our previous searches, by performing Tblastn analyses with the polycystin-cation-channel domain of the zebrafish Pkd protein, or the full-length sequence of the mouse PKD protein in question.
14
2
Supplementary References
Coxam, B., Sabine, A., Bower, N. I., Smith, K. A., Pichol-Thievend, C., Skoczylas, R., et al., (2014). Pkd1 regulates lymphatic vascular morphogenesis during development. Cell Rep. 7, 623-633. doi: 10.1016/j.celrep.2014.03.063
15