Correlation table between Intelligent Business Advanced and English for
Business Level 4 (CEFR C1/C2). English for Business Level 4. This qualification
is ...
Table S3. Pearson correlation coefficients for aquarium chemistry parameters and AOA/AOB abundances for freshwater aquaria.
S2 Table. Pearson correlation coefficients between ILI cases and the number of seasonal. 1 influenza isolates in Korea. 2. Correlation coefficient. Virus. 2010/11.
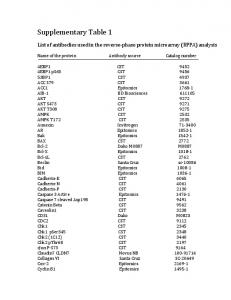
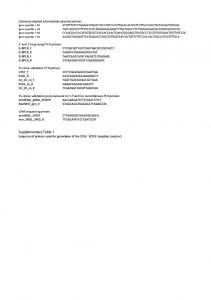
Supplementary Table 1: Primers used for qrT-PCr. Gene name. Forward primer 5â²-3â². Reverse primer 5â²-3â². ZEB1. GACAGTGTTACCAGGGAGGAGCA.
Supplementary Table 1. Pearson's correlation coefficients (r) between nonmetric multidimensional scaling ordination axes and species of Sebastes visually ...
Table S1. Parameter. Pearson correlation coefficient. Growth measurements length. - 0.5374. (AS and Ctrl). - 0.3831. (Ctrl and S). - 0.3956 tip number. - 0.5514.
Antiglycemic drugs (%). 230 (52%). 430 (63%). Patient characteristics at follow up of participants in the Danish arm of Anglo-Danish-Dutch. Study of Intensive ...
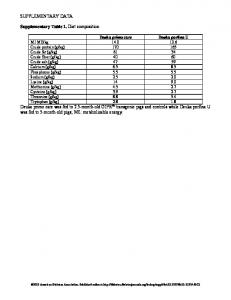
Deuka primo care was fed to 2.5-month-old GIPRdn transgenic pigs and controls while Deuka porfina U was fed to 5-month-old pigs; ME: metabolizable energy.
Elektra Papadopoulos. Food and Drug Administration. Indira Hills ... Jeremy Hobart. Plymouth Hospital. Adam Jacobs ... Gary Cutter. University of Alabama ...
Initial denaturation Cycles Denaturation. Annealing/Elongation. Temperature Time. Temperature Time Temperature Time. ABCD1. 95 °C 30 s. 50. 95 °C 5 s.
Penn Word Memory Test: Median Reaction Time for Correct Responses
Penn Word Memory Test: Total Number of Correct Responses
Variable Short Penn Line Orientation: Total Positions Off for All Trials
Variable Short Penn Line Orientation: Median Reaction Time Divided by Expected Number of Clicks for Correct
Variable Short Penn Line Orientation: Total Number Correct
Delay Discounting: Area Under the Curve for Discounting of $40,000
Delay Discounting: Area Under the Curve for Discounting of $200
NIH Toolbox Pattern Comparison Processing Speed Test
NIH Picture Vocabulary Test
NIH Oral Reading Recognition Test
0.40*
0.06
0.15* Handedness
0.11* Age (in years)
Total Household Income
0.02
0.29*
Body Mass Index
-0.13* Years of Education Completed
-0.08*
0
0.07
Mean Hematocrit Sample
0.04
0.06
0.02
-0.13*
-0.15*
Diastolic Blood Pressure
0.16*
0.32*
-0.01
0.02
-0.02
0.03
Systolic Blood Pressure
0.70*
0.20*
0.38*
-0.06
-0.02
-0.03
-0.08
Systolic-Diastolic Blood Pressure Ratio
Hemoglobin A1C
0
0.15*
-0.54*
0
0
0
-0.03
0.01
-0.11*
Pittsburgh Sleep Quality Index
0.03
0
0.1*
NIH Picture Sequence Memory Test
0
-0.03
0.02
0.02
-0.13*
0.09*
-0.08*
0.17*
-0.09*
-0.07
0.04
0.12*
NIH Dimensional Change Card Sort Test
0.21*
0
-0.01
0.06
0.03
0.03
0
0.07
-0.05
-0.07
-0.06
-0.11*
0
-0.11*
0.22*
0.13*
0.01
NIH Flanker Inhibitory Control and Attention Test
0.53*
0.14*
0
0.03
0.02
0.04
0
0.06
-0.12*
0.18*
0.13*
0
Penn Progressive Matrices: Number of Correct Responses
0.13*
-0.02
0.03
0.07
-0.04
0.12*
0.09*
-0.05
Penn Progressive Matrices: Median Reaction Time for Correct Responses
-0.68*
0.32*
-0.07*
0.09*
0.16*
-0.07*
0.13
-0.03
-0.03
Pittsburgh Sleep Quality Index NIH Picture Sequence Memory Test NIH Dimensional Change Card Sort Test NIH Flanker Inhibitory Control and Attention Test Penn Progressive Matrices: Number of Correct Responses Penn Progressive Matrices: Total Skipped Items Penn Progressive Matrices: Median Reaction Time for -0.04
Hemoglobin A1C
-0.12*
Mean Hematocrit Sample Diastolic Blood Pressure Systolic Blood Pressure SystolicDiastolic Blood Pressure Ratio
-0.13*
Body Mass Index
-0.11*
Total Household Income Years of Education Completed
0.17*
Handedness
-0.01
Powell, M. A., Garcia, J. O., Yeh, F.-C., Vettel, J. M., & Verstynen, T. (2017). Supplement for “Local connectome phenotypes predict social, health, and cognitive factors.” Network Neuroscience. 2(1): 86−105. https://doi.org/10.1162/netn_a_00031
Supplementary Table 1. Pairwise Pearson correlation matrix for 28 continuous HCP attributes. Asterisks indicate significant correlations after correcting for multiple comparisons (FDR < 0.05).
0.08*
-0.01
0.03
0
0.02
0
-0.02
0
0.03
-0.12*
-0.17*
-0.19*
-0.07
0.11*
0.11*
-0.15*
-0.17*
-0.28*
-0.03
-0.05
-0.01
0.27*
0.02
-0.26*
0.24*
-0.06
0.05
-0.01
0
0.02
-0.09*
-0.01
0.32*
0.19*
0.15*
0.34*
-0.25*
0.14*
0.33*
0.32*
0.19*
0.11*
0.10*
0.26*
-0.01
-0.27*
0.11*
-0.13*
0.14*
-0.03
0.20*
-0.04 -0.03
0.05 -0.08*
-0.09*
-0.12*
0.11*
0.10*
0.10*
0.21*
0.24*
0.07*
-0.06
0.16*
0.06
0.13*
0.23*
-0.04
0.03
-0.01
-0.13*
-0.92*
-0.19*
-0.16*
-0.14*
-0.35*
-0.39*
-0.30*
0.43*
-0.42*
-0.21*
-0.24*
-0.17*
0.02
0.13*
0.05
0.07
-0.15*
0.02
0.05
0.39*
-0.15*
0.22*
-0.16*
-0.10*
0.01
0.01
-0.02
-0.01
0.09*
-0.03
0.11*
0.02
-0.15*
-0.07
0
0.14*
-0.11*
0.06
-0.14*
-0.02
-0.01
0.11* -0.10*
0.04
0.13*
0.21*
0.09*
-0.01
0.04
-0.06
-0.03
0.14*
0.17*
0.16*
0.14*
0.31*
0.35*
0.27*
-0.31*
0.40*
0.18*
0.24*
0.17*
0
-0.05
0.06
-0.05
-0.08*
0.11*
-0.13*
0.20*
0.10*
-0.08*
-0.09*
0.70*
0.03
0.25*
0.23*
0.18*
-0.10*
0.17*
0.05
0.03
0.01
0.25*
0.22*
0.18*
-0.12*
0.21*
0.03
0
0.09*
-0.12*
-0.11* 0.03
-0.01
-0.01
-0.06
-0.05
0.01
-0.10*
0.22*
0.14*
-0.03
0.02
-0.05
0.04
-0.05
-0.08*
0.02
-0.11*
0.25*
0.14*
0.01
0.01
0.13*
0.15*
-0.07
-0.04
0.12*
0.41*
0.43*
0.18*
-0.03
-0.03
0
0
0.01
0.04
-0.06
0.13*
0.09*
-0.07
-0.13*
0.65*
0.21*
-0.29*
0.39*
0.18*
0.14*
0.13*
-0.08*
-0.09*
0.01
-0.02
-0.01
0.14*
-0.11*
0.47*
0.23*
-0.08*
0.12*
0.24*
-0.30*
0.39*
0.18*
0.22*
0.12*
-0.10*
-0.10*
0.03
-0.01
-0.02
0.05
-0.16*
0.46*
0.26*
-0.06
0.02
NIH Oral Reading Recognition Test NIH Picture Vocabulary Test NIH Toolbox Pattern Comparison Processing Speed Test Delay Discounting: Area Under the Curve for Discounting of $200 Delay Discounting: Area Under the Curve for Discounting of $40,000 Variable Short Penn Line Orientation: Total Number Correct Variable Short Penn Line Orientation: Median Reaction Time Divided by Expected Number of Clicks for Correct Variable Short Penn Line Orientation: Total Positions Off for All Trials Penn Word Memory Test: Total Number of Correct Responses Penn Word Memory Test: Median Reaction Time for Correct Responses NIH List Sorting Working Memory Test