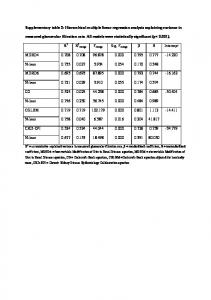
Negative binomial regression of disordered gambling symptoms predicted by absolute family wealth and region-level relative deprivation. Model 1. Model 2.
Supplementary Table 1. Pearson's correlation coefficients (r) between nonmetric multidimensional scaling ordination axes and species of Sebastes visually ...
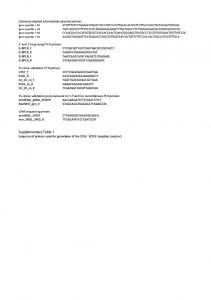
5'-ACACTCTTTCCCTACACGACGCTCTTCCGATCT-3â². P7. Multiplexing. Adapters. 5â²-P-GATCGGAAGAGCACACGTCT-3â². For each sample, we amplified ...
mm_Sf3b1_2400_R. TTGGCATATTCTGCATCCAT. Supplementary Table 1. Sequnces of primers used for generation of the Sf3b1 K700E targeting construct.
Breed groups1). 35.683. 7 0.000. 2>7, 2>8, 3>8 ... Breed groups*Sex. 9.753. 7 0.203. 7.399. 7 0.389 ... F5: Energy and restless. F6: Fear of non-social stimuli.
31.1 (8.6). 0.43. Age at symptoms onset. (mean years, SD). 29.0 (6.7) ... RRMS: relapsing remitting multiple sclerosis; SD: Standard deviation; GD: Gadolinium, ...
HuaXi, GuiY ang,. Guizhou, China. S.Y . Qin. KC555273. N/A. N/A. JN984864. Xu et al . (2012); Lombard et al . (2015). HGUP. 100004. N. tetragona Georgi leaf.
G. candidum GECA08s02727g similar to Saccharomyces cerevisiae YMR250W GAD1 Glutamate decarboxylase, converts glutamate into gamma-aminobutyric ...
Table 2: The distribution of L1 elements in mouse chromosomes and ... individual chromosome was analyzed by cross correlation coefficient test (Pearson's test). ... per chromosome, the determination coefficient (R2) test and Chi-square test.
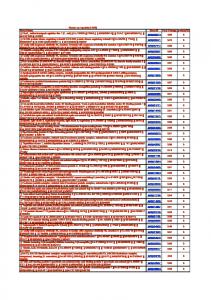
AKT inhibitor VIII. AKT1, AKT2, AKT3 ... CUDC-101. HDAC, EGFR chromain histone acetylation. 24756910. CX-5461. RNA Pol I other. 25257557. Camptothecin.
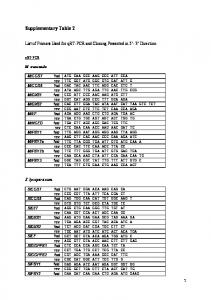
fwd GAC TAC AAC TTC AGG CAC CTC T rev ATA AGC TTG AGA TTC AAC TTG CCG. MtDXS1 fwd CCG ATT CCC AAC AAG ATG CTT rev GGT CAT AGG CCC ...
ribose 5-phosphate isomerase A. 0.79845852. Catalyzes the reversible conversion between ribose-5- .... deoxyuridine to uracil and ribose- or deoxyribose-1-.
Eukaryotic translation initiation factor 4E binding protein 1::eukaryotic ..... Solute carrier family 1 (neutral amino acid transporter), member 5::solute carrier family 1 (neutral amino acid ...... ASAM || hSQ029061 || || hHC006121 || 326765.
Supplementary Table 2. Parameters of the regression models fitted to the log-log transformed rank-abundance curves, represented by the equation log10y = a log10x + b, where a is the slope and b is the intercept. The slopes of the models differed significantly between suspended and biofilm communities (Student’s T-test, p < 0.001, n = 6); the slopes of bulk and active communities did not differ significantly.
Bulk community Biofilm community Active community
Bulk community Suspended community Active community