Memory & Cognition 2005, 33 (1), 151-170
Support for a continuous (single-process) model of recognition memory and source memory SCOTT D. SLOTNICK Boston College, Chestnut Hill, Massachusetts and CHAD S. DODSON University of Virginia, Charlottesville, Virginia Does memory retrieval occur in a continuous or an all-or-none manner? The shape of the receiver operating characteristic (ROC) has been used to answer this question, with curvilinear and linear memory ROCs indicating continuous and all-or-none retrieval processes, respectively. Signal detection models (e.g., the unequal variance model) correspond to a continuous retrieval process, whereas threshold models (including the multinomial model and the recollection component of the dual-process model) correspond to an all-or-none process. In studies of source memory, Slotnick et al. (2000) and others have observed curvilinear ROCs (supporting the unequal variance model), whereas Yonelinas (1999) observed linear ROCs (supporting the dual-process model). We resolve these seemingly inconsistent results, showing that source memory ROCs are naturally curvilinear but can appear linear when nondiagnostic source information is included in the analysis. Furthermore, the unequal variance model accounted for both recognition memory and source memory ROCs, supporting a continuous process of memory retrieval.
A fundamental question exists pertaining to memory retrieval: Does it occur in a continuous or an all-or-none manner? These two possibilities have been described using two general classes of memory models that describe the cognitive processes of recognition memory (i.e., item memory) and source memory (i.e., memory for contextual information): the continuous or signal detection models (Banks, 2000; Johnson, Hashtroudi, & Lindsay, 1993; Qin, Raye, Johnson, & Mitchell, 2001; Slotnick, Klein, Dodson, & Shimamura, 2000) and the all-or-none or high threshold models (Batchelder & Riefer, 1990; Bayen, Murnane, & Erdfelder, 1996; Riefer, Hu, & Batchelder, 1994; i.e., the recollection component of the dual-process model, see Yonelinas, 1999). One method of distinguishing between these two models of memory is to analyze the receiver operating characteristic (ROC; i.e., hit rates plotted against false alarm rates). The shape of the ROC is predicted to be different depending on whether memory retrieval occurs in a continuous or an all-or-none manner. To better understand the basis of the disparate predictions regarding ROC shape, we first consider the main signal detection and threshold models of
This work was supported, in part, by National Science Foundation Grant SBR-0196200 to Trisha Van Zandt. We thank Lauren Moo, Trisha Van Zandt, Ian Dobbins, Jason Arndt, and Andrew Heathcote for insightful comments on the manuscript. In addition, we thank Andrew Yonelinas for providing data from Experiment 2 of his 1999 article. Correspondence concerning this article should be addressed to S. D. Slotnick, Department of Psychology, Boston College, McGuinn Hall, Chestnut Hill, MA 02467 (e-mail:
[email protected]).
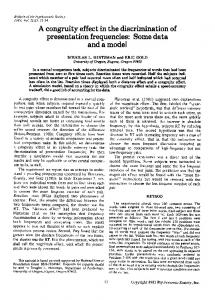
recognition memory and source memory in the context of a source memory experiment. Models of Recognition Memory and Source Memory ROC shape is assumed to depend on the characteristics of the underlying distributions in decision space (Green & Swets, 1966; Macmillan & Creelman, 1991). Figure 1 shows the decision space dictated by a twodimensional unequal variance signal detection theory model in a standard source memory paradigm. In this example, to-be-remembered words are first spoken in a male or female voice. Later, participants are presented with words previously spoken by the male (male source), words previously spoken by the female (female source), and new words (new) and make a recognition memory and source memory decision. Source memory, in this case, refers to memory for the speaker of a previously presented word. For each word at test, both recognition memory strength and source memory strength are dictated by the underlying Gaussian probability distribution in decision space, where recognition memory strength is defined as the distance (d′) between the male source and new or between the female source and new, each with a distribution standard deviation ratio (σn/σs), whereas source memory strength is defined as the distance (d′) between the male source and female source, also with a standard deviation ratio (σn/σs). This model is associated with a continuous process of memory retrieval, akin to familiarity, associated with both recognition memory and source memory (i.e., a continuous single process un-
151
Copyright 2005 Psychonomic Society, Inc.
152
SLOTNICK AND DODSON
UEV Model Decision Space
Probability
Female Source .004 .003 .002 .001 0
New Source
y or em M th ce ng ur tre So S
r mo
y
e M n itio ngth n og Stre ec
R
Figure 1. Decision space associated with a two-dimensional unequal variance (UEV) signal detection model of recognition memory and source memory. The recognition memory axis is shown to the right, where recognition memory strength systematically increases from new toward female and male sources. The source memory axis is orthogonal to the recognition memory axis. Recognition memory strength is defined as the distance (d′) between the male source and new distribution and also the distance between the female source and new distribution; source memory strength is defined as the distance between the male and female source distributions. Each distribution can have a unique standard deviation (σ), hence the name unequal variance model. Words previously spoken by a male (male source), words previously spoken by a female (female source), and new words (new) each have a probability of recognition memory strength and source memory strength dictated by their respective underlying distributions (i.e., probability density functions) in decision space.
derlies both types of memory retrieval). A classic onedimensional unequal variance signal detection model of source memory can be observed by projecting the twodimensional female source and male source distributions to one dimension. Two-dimensional recognition memory and source memory model parameters (d′ and σn/σs) are each fit independently in such a one-dimensional space (e.g., Banks, 2000; Slotnick et al., 2000). A one-dimensional unequal variance model of source memory is shown in Figure 2A. Decision space also consists of one or more decision criteria that delineate the boundary between different behavioral responses. In the present example, there are six criteria (C1–C6) that might correspond to the 7 responses in a confidence rating experiment (1 ⫽ very sure female, 2 ⫽ moderately sure female, . . . , and 7 ⫽ very sure male). For example, on a given trial, if memory strength falls between C1 and C2, a participant will respond “2.” Each criterion is associated with a hit rate p(“male” response/male source), the area under the male source distribution to the right of the crite-
rion and a false alarm rate p(“male” response/female source), the area under the female source distribution to the right of the criterion, which define a point on the ROC (Figure 2B). The z-ROC is a related means of assessing the relationship between hit rate and false alarm rate (Figure 2C) and is constructed by plotting the z-transformation (i.e., conversion into standard deviation units; see Macmillan & Creelman, 1991) of ROC hit rates and false alarm rates. The shapes of the underlying distributions in decision space dictate that the unequal variance memory ROC is always curvilinear (Figure 2B), whereas the unequal variance memory z-ROC is always linear (Figure 2C). In contrast to the unequal variance model of source memory, Figure 2D presents a two-high threshold model associated with an all-or-none process of source memory retrieval. The all-or-none property of this model occurs because of the two thresholds in decision space that specify the boundaries beyond which the two distributions no longer overlap. Above Threshold 2, for example, a participant completely recollects that an item was pre-
SUPPORT FOR A CONTINUOUS MEMORY MODEL
153
Figure 2. (A) Decision space associated with a one-dimensional unequal variance (UEV) signal detection model of source memory. The decision criteria (C1–C6) dictate how behavioral responses are assigned. (B) Curvilinear UEVmodel source memory ROC constructed by plotting the hit rate versus false alarm rate for each criterion, shown as circles. The smooth curve was constructed by sweeping a criterion across decision space and plotting the resultant hit rate versus false alarm rate. (C) Linear UEV model source memory z-ROC constructed by plotting the z-transformation of the ROC hit rates and false alarm rates. (D) Decision space associated with a one-dimensional two-high threshold (2HT) model of source memory. In addition to multiple criteria, two thresholds are shown below and above which only a single source distribution exists. (E) Linear 2HT model source memory ROC with points, shown as circles, corresponding to criteria and the line constructed by sweeping a criterion across decision space and plotting the successive hit rates versus false alarm rates. (F) Curvilinear 2HT model source memory z-ROC.
sented by the male source. By contrast, in the area where the two memory distributions overlap, a participant has no diagnostic source information for an item and can only guess at the source. In other words, in this area of overlap the distributions have a constant ratio, translating into an equivalent (linear) increase in hit rate and false alarm rate with progressively more lenient criterion placement. Because of this, the corresponding two-high threshold memory ROC is always linear (Figure 2E), whereas the two-high threshold memory z-ROC is always curvilinear (and concave; Figure 2F). Memory Model Predictions The unequal variance signal detection model (Slotnick et al., 2000) assumes that the underlying distributions in
decision space are Gaussian (Figure 1) and thus predicts that the recognition memory ROC and source memory ROC will be curvilinear, whereas the recognition memory z-ROC and source memory z-ROC will be linear. The multinomial model (Batchelder & Riefer, 1990; Riefer et al., 1994) assumes that recognition memory is a one-high threshold process (see Macmillan & Creelman, 1991), whereas source memory is a two-high threshold process. A revised version of the multinomial model assumes that both recognition memory and source memory are two-high threshold processes (Bayen et al., 1996; Yu & Bellezza, 2000). It follows that the multinomial model predicts that the recognition memory ROC and source memory ROC will be linear, whereas the recognition memory z-ROC and source memory z-ROC will be curvilinear.
154
SLOTNICK AND DODSON
The dual-process model of memory (Atkinson & Juola, 1974; see Jacoby, 1991) can be viewed as a hybrid between a signal detection model and a threshold model. In this model, both familiarity and recollection are assumed to contribute toward recognition memory. Jacoby’s dualprocess model of recognition memory has been placed in the signal detection framework, in which familiarity was modeled as a continuous process, using equal variance Gaussian memory strength distributions in decision space, and recollection was initially modeled as a one-high threshold process (Yonelinas, 1994). The dual-process model has been extended to include source memory and revised such that recollection is assumed to be a twohigh threshold process (Yonelinas, 1999). As such, the dual-process model predicts that the recognition memory ROC and the recognition memory z-ROC could be linear or curvilinear, whereas the source memory ROC will be linear and the source memory z-ROC will be curvilinear (when item familiarity is approximately equal, as is generally the case in source memory experiments). Present Status of Memory Models and Motivation A number of studies have provided evidence that recognition memory ROCs are curvilinear and recognition memory z-ROCs are linear (Heathcote, 2003; Slotnick et al., 2000; Yonelinas, 1994, 1999). These results argue against the validity of the multinomial model but are consistent with both the unequal variance model and the dual-process model. Given that both the unequal variance model and dual-process model can predict a curvilinear recognition memory ROC, it is inherently difficult to distinguish between these models by assessing the shape of the recognition memory ROC (but see Glanzer, Kim, Hilford, & Adams, 1999, and Heathcote, 2003). Because of this, many investigators have turned to the source memory ROC, which is predicted to be curvilinear by the unequal variance model but linear by the dualprocess model, and the source memory z-ROC, which is predicted to be linear by the unequal variance model but curvilinear by the dual-process model. Source memory ROC and source memory z-ROC results have been inconclusive; Yonelinas (1999) has observed linear source memory ROCs and curvilinear z-ROCs, whereas other investigators have observed curvilinear source memory ROCs and linear z-ROCs (Qin et al., 2001; Slotnick et al., 2000). One of the aims of the present study is to uncover the basis of these inconsistent source memory ROC/z-ROC results. Consider, for example, the studies conducted by Yonelinas (1999) and Slotnick et al. (2000), both of which employed a task in which participants made an old –new confidence rating and a source A/source B confidence rating. There was a key difference in these studies— Yonelinas analyzed the data by summing over all levels of old –new response ratings, yielding collapsed source
responses to generate the source memory ROC and z-ROC, whereas Slotnick et al. analyzed both collapsed source responses and the source response ratings, corresponding to the highest old –new rating to generate the source memory ROC and z-ROC. Yonelinas observed linear source memory ROCs and curvilinear source memory z-ROCs. However, Slotnick et al. observed that source memory ROCs were more curvilinear (and source memory z-ROCs were more linear) when they were derived from the highest old –new response rating (i.e., refined source memory ROCs/z-ROCs) than when they were derived from all levels of the old –new responses (i.e., collapsed source memory ROCs/z-ROCs). Why would computing source memory ROCs/z-ROCs from all levels of old –new confidence ratings produce more linear ROCs and more curvilinear z-ROCs than computing these source memory ROCs/z-ROCs from the highest old –new confidence rating? We hypothesize that collapsing over all old –new responses adds “noise” to the source memory data. In other words, participants may be more likely to guess the source of an item when they are unsure whether the item is old or new. Inclusion of guessing responses from lower old –new response ratings may tend to flatten or linearize the memory ROC and make the z-ROC more curvilinear, a possibility echoing that put forth by Ratcliff, McKoon, and Tindall (1994). Supporting this, DeCarlo (2003) showed that higher recognition memory strength was correlated with higher source memory strength and argued that collapsing over old –new responses can bias parameter estimates. Furthermore, Hilford, Glanzer, Kim, and DeCarlo (2002) have proposed a variant of the unequal variance signal detection model with a parameter that essentially eliminates forgotten items (i.e., studied items with low old – new response ratings; see the General Discussion section), and have shown that inclusion of such items distorts the source memory ROC/z-ROC. If our hypothesis is correct, participants should be less likely to guess the source when they are confident that the item is old (as shown by DeCarlo, 2003); thus high old –new confidence ratings should be associated with a refined (more curvilinear) source memory ROC and (more linear) source memory z-ROC. Although less frequently utilized than collapsed ROCs/z-ROCs, in part due to the need for a dual-judgment paradigm, conditional ROCs/z-ROCs have been constructed for nearly half a century (Clarke, Birdsall, & Tanner, 1959; Macmillan & Creelman, 1991). In short, we hypothesize that the source memory ROC is naturally curvilinear and the source memory z-ROC is naturally linear but that the ROC can appear linear and the z-ROC can appear curvilinear when including data in which participants guess the source. We examined this hypothesis in three ways. First, we reanalyzed a dataset from Yonelinas (1999, Experiment 2) in which we assessed the shape of the source memory ROC and z-ROC when derived from old –new confidence ratings that contained diagnostic source informa-
SUPPORT FOR A CONTINUOUS MEMORY MODEL tion. Second, we constructed an analytical model to determine the effect of parametric increases of noise on the shape of the source memory ROC and z-ROC. Third, we conducted two experiments to empirically determine whether source memory ROCs are more likely to be linear and source memory z-ROCs are more likely to be curvilinear under conditions of low, compared with high, memory performance (i.e., lower vs. higher diagnostic source information). All of these methods produced results that were consistent with our hypothesis that source memory ROCs are curvilinear but can appear linear under noisy conditions and source memory z-ROCs are linear but can appear curvilinear under noisy conditions. Finally, another aim of the present study was to evaluate the unequal variance model and two-high threshold models of recognition memory and source memory by comparing the shapes of recognition memory ROCs and z-ROCs and source memory ROCs and z-ROCs with those predicted by these models. REANALYSIS OF YONELINAS (1999) Method Data collection and experimental protocol. The data under investigation were collected during a source memory experiment conducted by Yonelinas (1999, Experiment 2). Twenty-four undergraduates participated in this experiment, and the stimuli consisted of words randomly selected from the Toronto word pool. During the study phase, the participants first heard 80 words presented by a male, followed by 80 words presented by a female; they had been instructed to remember each word and which voice had spoken each word. During the test phase, the participants were presented with a booklet that contained the 160 study words and 80 new words in random order. The participants made two judgments for each word: (1) confidence that the word was in the study phase (1 ⫽ sure not studied and 6 ⫽ sure studied) and (2) confidence of the word’s source (1 ⫽ sure female voice and 6 ⫽ sure male voice). Summing across the participants, this resulted in a 6 ⫻ 6 matrix for words from each of the three sources: the male source, the female source, and new. As illustrated in Table 1, the response matrices were organized such that each row corresponded to each of the 6 old –new confidence ratings (e.g., the top row referred to very sure old) and each column corresponded to each of the 6 source confidence ratings (e.g., the first column referred to very sure female). In this paradigm, words were grouped by speaker at study, such that differential source familiarity could have been used to some degree during source memory judgments. However, according to dual-process theory, the linear source ROCs observed by Yonelinas (1999) indicate that the sources in this paradigm were of similar familiarity (otherwise, source ROCs would have been curvilinear) and source judgments can be assumed to rely for all practical purposes solely on the process of recollection (i.e., a two-high threshold model). Collapsed ROC/z-ROC construction. When we plotted the collapsed source memory ROC, we summed the male source and female source response data over all of the old –new ratings, thus converting each two-dimensional response matrix into a onedimensional response matrix (bottom rows in Table 1; note that if the participants only made source ratings, without old –new confidence ratings, this would effectively be the same as collapsing over old –new ratings). Frequencies were then computed for each of the six source ratings. After this, the male source was arbitrarily designated as the target, and the source ratings were cumulated in the direction of decreasing confidence “male” (right to left), resulting in
155
a series of hit rates. Similarly, the female source frequencies were cumulated in the same direction, resulting in a series of false alarm rates. A plot of these hit rates versus false alarm rates defined the collapsed source memory ROC (for additional procedural details on ROC construction, see Macmillan & Creelman, 1991). The source memory z-ROC consisted of the z-transformation of the ROC points. The old –new recognition memory ROC and z-ROC were computed in a similar manner by first collapsing over source ratings (yielding the right columns in Table 1) and then comparing the male source and new (male vs. new) with the female source and new (female vs. new). Models were fit using the maximum likelihood procedure (Press, Teukolsky, Vetterling, & Flannery, 1996), where the best-fit two-high threshold model was determined by fitting a line to the ROC and the best-fit unequal variance model was determined by fitting a line to the z-ROC. Refined source memory ROC/z-ROC construction. Because source memory strength is dependent on old –new confidence rating, in that higher confidence “old” responses are associated with greater source memory (DeCarlo, 2003; Slotnick et al., 2000), the data used to construct the refined ROC/z-ROC was restricted to the source response matrix rows that contained diagnostic source information (see Table 1). A source memory ROC corresponding to each old –new confidence rating was constructed in the same manner as the collapsed source memory ROC. Then, the unequal variance model was fit to each of these ROCs, resulting in associated values of d′ and σn/σs (the ratio of female source standard deviation to male source standard deviation in decision space). Only old–new confidence ratings that resulted in a d′ significantly greater than zero (i.e., the top two rows of the male and female source response matrices, see the Results section), as assessed by using a two-tailed t test, were collapsed and then used to plot the refined source memory ROC and z-ROC.
Table 1 Measured and Collapsed (Summed) Confidence Ratings From Yonelinas (1999, Experiment 2) Female Male 1 2 3 4 5 6 Σ Old
New
Old
New
Old
New
6 5 4 3 2 1 Σ
79 12 2 4 4 6 107
64 77 35 34 29 16 255
Male Source 75 40 43 48 84 68 119 82 130 75 71 43 522 356
119 71 27 7 2 3 229
433 10 3 0 2 3 451
810 261 219 246 242 142 1,920
6 5 4 3 2 1 Σ
489 24 8 5 8 3 537
119 105 33 20 26 16 319
Female Source 62 40 51 40 82 54 101 86 113 78 83 30 492 328
56 45 26 8 4 5 144
84 9 1 3 1 2 100
850 274 204 223 230 139 1,920
6 5 4 3 2 1 Σ
22 15 15 3 14 9 78
20 54 38 49 37 46 244
24 48 20 8 15 13 128
12 11 2 1 4 7 37
101 200 256 345 547 471 1,920
New 14 37 124 166 296 246 883
9 35 57 118 181 150 550
156
SLOTNICK AND DODSON
Figure 3. (A) Recognition memory ROC (male vs. new), shown as circles, constructed by collapsing over source response ratings from Yonelinas (1999, Experiment 2), and best-fit unequal variance model, shown as curve, and two-high threshold model, shown as line (ROC points and best-fit models are indicated similarly in subsequent figures). (B) Recognition memory ROC constructed using female versus new response ratings. (C) Male versus new recognition memory z-ROC. (D) Female versus new recognition memory z-ROC.
Chi-square analysis. Chi-square (χ 2) analysis directly assesses the deviation between each model’s predicted ROC/z-ROC and the empirically derived ROC/z-ROC (Heathcote, 2003; Slotnick et al., 2000). Specifically, the χ 2 value is calculated by using the difference between the hit rates associated with the best-fit model and the hit rates that are measured. A large χ 2 value indicates a poor fit, whereas a small χ 2 value indicates a good fit. A fit is considered adequate if the χ 2 value is sufficiently small ( p ⬎ .05). Linearity analysis. Linearity analysis tests whether the ROC or z-ROC has a significant linear component and whether the addition of a quadratic component results in a significantly better fit. A line is fit to the ROC or z-ROC and then, separately, a line plus a quadratic component are fit (with quadratic coefficient c). Regression is conducted in the x direction and y direction, and only the fits with the lowest sum-of-squares error between the model and the data are used. If the addition of a quadratic term significantly improves the fit over the linear fit alone (at p ⬍ .05), the ROC or z-ROC is considered curvilinear; otherwise, the ROC or z-ROC is considered linear (i.e., p ⬎ .05; Hilford et al., 2002; Slotnick et al., 2000; Yoneli-
nas, 1999). It should be noted that the parabolic curvature associated with a quadratic component, defined by the exponent of 2 in the cx2 term, is not the same as the ROC curvature predicted by the unequal variance model or the z-ROC curvature predicted by the two-high threshold model. As such, linearity analysis should be considered a general test of ROC or z-ROC curvature.
Results and Discussion The recognition memory ROCs and z-ROCs (male vs. new and female vs. new) are shown in Figure 3, and the associated parameters are illustrated in Table 2. The top of Table 2 is segregated by d′ and σn/σs values, given by the best-fit unequal variance model. The χ 2 analysis results are separated into two columns (χ 2 and significance value) associated with the unequal variance model and two columns associated with the two-high threshold model. The ROC and z-ROC linearity analysis results (in the
SUPPORT FOR A CONTINUOUS MEMORY MODEL
157
Table 2 Recognition Memory and Source Memory ROC and z-ROC Parameters From Yonelinas’s (1999, Experiment 2) Data Reanalysis
MN FN MFc MFr
MN FN MFc MFr
Parameter Values d′ σn/σs 1.03⫾.037 0.71⫾.037 1.08⫾.029 0.69⫾.029 0.79⫾.089 1.02⫾.094 1.19⫾.035 1.05⫾.039 R2 lin
Flin
0.958 0.950 0.994 0.944
, 69.24 , 57.24 ,498.12 , 50.89
R2 lin
Flin
χ 2UEV 11.39 6.86 73.71 1.98
χ 2 Analysis Results pUEV χ 22HT .010 70.19 .077 74.39 .000 28.06 .577 46.69
ROC Linearity Analysis Results MSe lin p lin Fquad MSe quad 2.2⫻10⫺3 2.4⫻10⫺3 7.1⫻10⫺4 2.7⫻10⫺3
.004 .005 .000 .006
53.27 118.47 14.74 66.57
1.2⫻10⫺4 1.3⫻10⫺4 1.1⫻10⫺4 1.0⫻10⫺4
z-ROC Linearity Analysis Results MSe lin p lin Fquad MSe quad
p2HT .000 .000 .000 .000
pquad
cquad
.018 .008 .062 .015
⫺0.69 ⫺0.71 ⫺0.45 ⫺1.73
pquad
cquad
MN 0.993 ,429.20 3.8⫻10⫺3 .000 16.80 6.0⫻10⫺4 .055 ⫺0.08 FN 0.995 ,636.92 2.4⫻10⫺3 .000 32.78 2.0⫻10⫺4 .029 ⫺0.06 MFc 0.977 ,125.81 2.8⫻10⫺2 .002 84.38 8.8⫻10⫺4 .012 ⫺0.26 MFr 0.997 1,178.52 1.2⫻10⫺3 .000 8.06 3.2⫻10⫺4 .105 ⫺0.10 Note—MN, male versus new; FN, female versus new; MFc , collapsed (43% noise) male versus female; MFr , refined male versus female; UEV, unequal variance model; 2HT, two-high threshold model. Bold χ 2 analysis p values indicate adequate fit ( p ⬎ .05), and bold linearity analysis p values indicate significant component ( p ⬍ .05).
middle and bottom of Table 2) divide eight columns equally between the linear fit (R2, F, MSe, and significance) and the quadratic component (F, MSe, significance, and c). The χ 2 analysis indicated that only the female versus new recognition memory ROC was adequately fit by the unequal variance model, while neither recognition memory ROC was adequately fit by the two-high threshold model. The linearity analysis showed that both recognition memory ROCs were curvilinear (as indicated by the significant quadratic components), whereas the male versus new recognition memory z-ROC was linear and the female versus new recognition memory z-ROC was curvilinear. Figures 4A and 4D show the source memory ROC and z-ROC that were empirically derived by collapsing over all of the old –new ratings (collapsed source memory ROC/z-ROC) as well as the best-fit two-high threshold and unequal variance models. Results from the χ 2 analysis and the linearity analysis of the collapsed source memory ROC are shown in Table 2. The χ 2 analysis indicates that neither model adequately fit the collapsed source memory ROC (both ps ⬍ .001), whereas the linearity analysis indicated that the collapsed source memory ROC was linear and the collapsed source memory z-ROC was curvilinear, in support of the two-high threshold model (i.e., the addition of a quadratic component did not significantly improve the fit to the ROC [p ⫽ .062], but did significantly improve the fit to the z-ROC [p ⫽ .012] ). The fact that the χ 2 analysis results indicated that the two-high threshold model did not provide an adequate fit, whereas the linearity analysis results indicated that the ROC was linear and the z-ROC was curvi-
linear (as predicted by the two-high threshold model) would at first blush appear to be inconsistent with regard to the shape of the collapsed source memory ROC. However, as was stated previously, linearity analysis is only sensitive to quadratic deviations from linearity, whereas χ 2 analysis is sensitive to any deviation from linearity (i.e., it is a direct assessment of the ROC/z-ROC curvature predicted by either model). It follows that the collapsed source ROC indeed deviated from linearity, but in a nonquadratic manner (e.g., cubic or some other type of nonlinearity). Thus, again, neither model adequately fit the collapsed ROC. The ROCs/z-ROCs illustrated in Figures 4B and 4E were derived from highest to lowest old –new confidence ratings (Table 1) and corresponded to unequal variance model d′s of 1.45 ⫾ .057, 0.34 ⫾ .053, 0.14 ⫾ .068, ⫺0.17 ⫾ .059, ⫺0.02 ⫾ .062, and 0.01 ⫾ .087, respectively. Only the top two rows of the response matrix corresponded to a source memory d′ that was significantly different from 0 ( p ⬍ .05). That is, the bottom four rows of the response matrix contained nondiagnostic source information (i.e., noise); these four rows made up 42.84% of the total responses, taken as the percentage of noise in the collapsed source memory ROC/z-ROC. Note that this definition of noise—the percentage of responses without diagnostic source information—will be used in the remainder of the article to quantify noise level, thereby allowing us to more accurately assess the effect of noise on the shape of the ROC and z-ROC. Given that only the top two rows contained relevant source memory information, they were used to construct the refined source memory ROC and z-ROC (Figures 4C and 4F).
158
SLOTNICK AND DODSON
Figure 4. (A) Source memory ROC constructed by collapsing over old–new response ratings from Yonelinas (1999, Experiment 2). (B) Source memory ROCs constructed from the rows in the source response matrices corresponding to each old–new rating, each fit with the unequal variance model. Only the top two ratings, indicated by circles and triangles, resulted in d′ values that were significantly different from chance. (C) Refined source memory ROC constructed by collapsing over top two old–new ratings. (D–F) Corresponding source memory z-ROCs.
The refined source memory ROC was curvilinear and the z-ROC was linear (see Table 2), as indicated by the χ 2 analysis, in which the unequal variance model provided an adequate fit ( p ⫽ .58) whereas the two-high threshold model did not ( p ⬍ .001), and the linearity analysis, with a significant ROC quadratic component ( p ⬍ .05) and a nonsignificant z-ROC quadratic component. Therefore, the reanalysis of the Yonelinas (1999) data was consistent with our hypothesis that source memory ROCs are naturally curvilinear and z-ROCs are naturally linear when they contain only diagnostic source information. NOISE DISTORTION OF A CURVILINEAR ROC Method Curvilinear ROC/linear z-ROC model. To further test our hypothesis that curvilinear source memory ROCs will become more
linear and linear source memory z-ROCs will become more curvilinear with the addition of noise, we conducted a simulation. The overall strategy was to determine the effect of noise on the shape of a curvilinear ROC/linear z-ROC by first modeling the refined source memory ROC from Yonelinas’s (1999) dataset, and then parametrically increasing the level of noise. An unequal variance signal detection model, necessarily yielding a curvilinear ROC/linear z-ROC (Figures 2B and 2C) was constructed to match the refined source memory ROC parameters obtained in the reanalysis of Yonelinas (1999, Experiment 2). In the context of this simulation, we refer to the refined source memory ROC/z-ROC as the 0% noise condition. The model was constructed by first setting d′ to 1.19 and σn/σs to 1.05 (matching Yonelinas’s [1999] parameters listed in the 4th row of Table 2); these values were used to generate artificial source confidence ratings. Specifically, the total number of confidence rating responses in the model was designed to increase linearly from that used to construct Yonelinas’s (1999) refined source memory ROC (0% noise) to that used to construct Yonelinas’s (1999) collapsed source memory ROC (43% noise). In this way, the model was representative of two points on a continuum of possible noise percentages, to mirror the Yoneli-
SUPPORT FOR A CONTINUOUS MEMORY MODEL
nas (1999) reanalysis results. Criteria were iteratively selected such that the leftmost and rightmost points of the model ROC were similar to Yonelinas’s (1999) refined source memory ROC (Figure 4C); intermediate criteria in the model were equally spaced (explaining the slight deviation between Yonelinas’s (1999) refined source memory ROC parameters and the model parameters associated with 0% noise). The noise confidence ratings in the model (used when noise was greater than 0%) were resampled from the frequencies in the collapsed bottom four rows from Yonelinas’s (1999) response matrix (which contained no diagnostic source information; see Table 1). To simulate variability in the data, hit rates at the 0% noise level were randomly jittered, using unit variance Gaussian noise, weighted by the variance at each point (assuming binomial statistics). This jitter was held constant for all other noise levels, thus avoiding the potential confound between jitter and noise level. The fraction of noise responses, as a function of the total number of responses, was parametrically varied from 0%–100% in increments of 5%. At each level of noise, the model ROC and z-ROC was assessed, using both χ 2 analysis and linearity analysis. If our hypothesis is correct, the modeling results should show that systematic increases in noise are associated with increasingly linear ROCs and increasingly curvilinear (concave) z-ROCs.
Results and Discussion Table 3 and Figure 5 show the results of the parametric addition of noise to a model of Yonelinas’s (1999) refined source memory ROC and z-ROC. As expected, the unequal variance parameter d′ is similar for the model ROC at 0% noise, as compared with Yonelinas’s (1999) refined source memory ROC (1.23 vs. 1.19), and 43% noise, as compared with Yonelinas’s (1999) collapsed source memory ROC (0.82 vs. 0.79, the former value being estimated by linear interpolation). Also as expected, d′ systematically decreased to zero as percent noise increased and σn/σs was relatively constant. In support of the hypothesis under investigation, the quadratic component c in the ROC linearity analysis decreased with increasing noise, indicating a systematic flattening of the ROC. The decreasing significance of the quadratic component with increasing percent noise ultimately resulted in a failure to reach significance at 40% noise ( p ⫽ .054). At the 43% noise level, the model p value of the quadratic component was equal to .059, which is comparable to the collapsed ROC linearity analysis quadratic p value of .062 reported by Yonelinas (1999, Experiment 2). The linear fit also systematically improved with increasing noise levels, as assessed by increases in both R2 and F values. Also supporting our hypothesis is the fact that the quadratic component in the z-ROC linearity analysis initially increased with increasing noise (and was concave, as predicted by the two-high threshold model), becoming significant at 30% noise ( p ⫽ .042), whereas the linear fit R2 and F values initially decreased. The value of the z-ROC quadratic component at the 43% noise level for the model (c ⫽ 0.19) was similar to that reported by Yonelinas (c ⫽ 0.26; 1999, Experiment 2) indicating that addition of noise can produce concave curvature of the z-ROC. Chi-square analysis proved to be more sensitive than the linearity analysis, in that the addition of 25% noise or greater failed to result in an ad-
159
equate fit for the unequal variance model ( p ⬍ .01). The two-high threshold χ 2 analysis results showed a systematically better fit with increasing noise, which is also consistent with ROC flattening/z-ROC bending, ultimately resulting in an adequate fit at 90% noise. EXPERIMENTS The previous reanalysis of data from Yonelinas (1999, Experiment 2) and the simulation are consistent with our hypothesis that source memory ROCs are naturally curvilinear and source memory z-ROCs are naturally linear. The reanalysis results indicate that source memory ROCs only appear linear and source memory z-ROCs only appear curvilinear when they are derived from data that include nondiagnostic source information, such as contained in the collapsed source memory ROC/z-ROC. In addition, our simulation showed that a curvilinear ROC becomes more linear and a linear z-ROC becomes more curvilinear as noise increases. In the next section, we test our hypothesis empirically. We conducted two experiments to examine the prediction that source memory ROCs are more linear and source memory z-ROCs are more curvilinear under conditions in which participants are more likely to guess the source. Specifically, we manipulated encoding conditions such that in Experiment 1, participants were given a limited amount of time to study each item (to evoke a relatively lower level of processing), whereas in Experiment 2 participants were given as much time as they needed to study each item (to evoke a relatively higher level of processing). Because the experiments were nearly identical, a single description will follow, with differences noted accordingly. These experiments were analyzed using the methods described earlier to provide evidence pertaining to the shape of both the recognition memory ROCs/z-ROCs and source memory ROCs/z-ROCs. Method Participants and Materials. Experiment 1 was conducted at the University of Virginia, where 15 undergraduates were each paid $10.00/hour for participation. Experiment 2 was conducted at Johns Hopkins University, where 15 undergraduates were each paid $8.00/hour for participation. The stimulus set for each participant consisted of 250 words randomly selected from the Toronto word pool. This set of words was divided into three 80-word lists—one female word list, one male word list, and one new word list—and 10 noncritical buffer words. The female word list and male word list, randomly intermixed, were used to construct the study list, whereas all three lists, also randomly intermixed, were used to construct the test list. All words were presented visually during both study and test phases. In addition, female and male words in the study phase were presented auditorily in the appropriate voice. Custom presentation/data acquisition software was written in MATLAB (Mathworks, Inc., Natick, MA). Procedures. During the study phase, words were presented sequentially. To diminish primacy and recency effects, five buffer words were presented at the beginning and end of the study phase. The participants were told that they would hear a very long list of words and that they should try to use specific associations (e.g.,
160
SLOTNICK AND DODSON Table 3 Simulating the Effect of Increases in Noise on a Curvilinear Source Memory ROC/Linear z-ROC % Noise 0 5 10 15 20 25 30 35 40 45 50 55 60 65 70 75 80 85 90 95 100
0 5 10 15 20 25 30 35 40 45 50 55 60 65 70 75 80 85 90 95 100
Parameter Values d′ σn/σs 1.23⫾.034 1.03⫾.038 1.19⫾.031 1.01⫾.034 1.14⫾.028 1.00⫾.031 1.09⫾.030 0.99⫾.033 1.04⫾.039 0.98⫾.041 1.00⫾.046 0.98⫾.049 0.95⫾.053 0.97⫾.056 0.90⫾.059 0.97⫾.061 0.85⫾.065 0.96⫾.066 0.81⫾.069 0.96⫾.070 0.76⫾.074 0.95⫾.073 0.70⫾.077 0.95⫾.075 0.65⫾.080 0.95⫾.077 0.60⫾.082 0.95⫾.078 0.54⫾.083 0.95⫾.078 0.47⫾.083 0.95⫾.077 0.40⫾.081 0.95⫾.074 0.33⫾.077 0.96⫾.069 0.24⫾.068 0.96⫾.061 0.15⫾.053 0.96⫾.046 0.03⫾.031 0.96⫾.027 R2lin 0.927 0.941 0.952 0.962 0.969 0.975 0.980 0.985 0.988 0.991 0.993 0.994 0.996 0.997 0.998 0.999 0.999 0.999 1.000 1.000 1.000
Flin 37.94 47.78 60.04 75.38 94.67 119.11 150.33 190.62 243.27 313.10 407.38 537.47 721.75 991.37 1.4⫻103 2.1⫻103 3.2⫻103 5.3⫻103 9.7⫻103 2.0⫻104 3.7⫻104
χ 2UEV 0.53 0.54 1.67 4.06 7.77 12.87 19.36 27.21 36.31 46.47 57.41 68.71 79.77 89.75 97.53 101.62 100.11 90.78 71.53 42.37 13.58
χ 2 Analysis Results pUEV χ 22HT .913 68.54 .911 68.21 .643 67.25 .255 65.71 .051 63.62 .005 61.05 .000 58.04 .000 54.64 .000 50.89 .000 46.85 .000 42.57 .000 38.09 .000 33.49 .000 28.81 .000 24.13 .000 19.53 .000 15.10 .000 10.94 .000 7.20 .000 4.12 .004 2.16
ROC Linearity Analysis Results MSe lin plin Fquad MSe quad 3.6⫻10⫺3 .009 59.49 1.7⫻10⫺4 3.2⫻10⫺3 .006 52.41 1.8⫻10⫺4 2.9⫻10⫺3 .004 45.33 1.8⫻10⫺4 2.6⫻10⫺3 .003 38.70 1.9⫻10⫺4 2.3⫻10⫺3 .002 32.82 2.0⫻10⫺4 2.0⫻10⫺3 .002 27.76 2.1⫻10⫺4 1.8⫻10⫺3 .001 23.52 2.1⫻10⫺4 1.6⫻10⫺3 .001 19.98 2.1⫻10⫺4 1.3⫻10⫺3 .001 17.04 2.1⫻10⫺4 1.1⫻10⫺3 .000 14.60 2.0⫻10⫺4 9.5⫻10⫺4 .000 12.54 2.0⫻10⫺4 7.7⫻10⫺4 .000 10.79 1.8⫻10⫺4 6.3⫻10⫺4 .000 9.28 1.7⫻10⫺4 4.9⫻10⫺4 .000 7.94 1.5⫻10⫺4 3.7⫻10⫺4 .000 6.73 1.3⫻10⫺4 2.7⫻10⫺4 .000 5.59 1.1⫻10⫺4 1.8⫻10⫺4 .000 4.47 8.7⫻10⫺5 1.2⫻10⫺4 .000 3.32 6.8⫻10⫺5 7.1⫻10⫺5 .000 2.11 5.2⫻10⫺5 3.7⫻10⫺5 .000 0.91 3.9⫻10⫺5 2.1⫻10⫺5 .000 0.07 3.0⫻10⫺5
“imagine the male or female speaker interacting with the object”) in order to remember who spoke the word. Speed and accuracy (i.e., vividness) of making the association were stressed as equally important. In Experiment 1, study words were presented for 2 sec, thereby limiting encoding time. In Experiment 2, encoding time was self-paced, and the participants were instructed to press “enter” after an association was made. These encoding time differences were expected to elicit weaker memory strength (i.e., greater noise) in Experiment 1 as compared with Experiment 2. Immediately following the encoding phase, the 240 words from the test list were presented. The participants made two judgments for each word: (1) confidence that a word was from the study phase (1 ⫽ very sure new, 2 ⫽ moderately sure new, 3 ⫽ less sure new, 4 ⫽ don’t know, 5 ⫽ less sure old, 6 ⫽ moderately sure old, and 7 ⫽ very sure old) and (2) confidence of the word’s source (also using
pquad .016 .019 .021 .025 .029 .034 .040 .047 .054 .062 .071 .081 .093 .106 .122 .142 .169 .210 .283 .442 .816
p2HT .000 .000 .000 .000 .000 .000 .000 .000 .000 .000 .000 .000 .000 .000 .000 .000 .002 .012 .066 .249 .541 cquad ⫺2.02 ⫺1.76 ⫺1.53 ⫺1.33 ⫺1.16 ⫺1.01 ⫺0.87 ⫺0.75 ⫺0.65 ⫺0.55 ⫺0.47 ⫺0.40 ⫺0.33 ⫺0.27 ⫺0.22 ⫺0.17 ⫺0.13 ⫺0.10 ⫺0.06 ⫺0.03 ⫺0.01
responses ranging from 1 ⫽ very sure female to 7 ⫽ very sure male). If the participants were very sure a word was new, they were told to respond “4” on the source judgment. In addition, they were instructed not to use the endpoints of the response scale alone or to evenly distribute their responses, but rather each response was to reflect the specific memorial experience relating to a given word. Analysis. The response matrices from both experiments (Tables 4 and 5), each summed across participants, were subjected to the same group analysis procedure as that used in the reanalysis of data from Yonelinas (1999, Experiment 2). Moreover, an individual participant analysis was conducted to (1) allow for post hoc parameter comparisons within or between experiments, using a onetailed t test (using between-participant variability to estimate variance) and (2) to ensure that the results reported were not due to averaging effects (Brown & Heathcote, 2003).
SUPPORT FOR A CONTINUOUS MEMORY MODEL
161
Table 3 (Continued) z-ROC Linearity Analysis Results % Noise R2lin Flin MSe lin plin Fquad MSe quad pquad cquad 0 0.999 3.5⫻103 4.1⫻10⫺4 .000 1.67 3.3⫻10⫺4 .325 ⫺0.04 3.0⫻10⫺4 .000 0.14 4.0⫻10⫺4 .746 0.01 5 0.999 5.4⫻103 10 0.999 2.2⫻103 8.0⫻10⫺4 .000 2.49 5.3⫻10⫺4 .255 0.06 15 0.997 1.1⫻103 1.8⫻10⫺3 .000 6.35 6.6⫻10⫺4 .128 0.09 20 0.995 645.35 3.4⫻10⫺3 .000 11.02 7.7⫻10⫺4 .080 0.12 25 0.993 451.10 5.3⫻10⫺3 .000 16.37 8.6⫻10⫺4 .056 0.15 30 0.991 345.86 7.6⫻10⫺3 .000 22.57 9.2⫻10⫺4 .042 0.16 35 0.990 282.63 1.0⫻10⫺2 .001 29.93 9.5⫻10⫺4 .032 0.18 40 0.988 242.08 1.3⫻10⫺2 .001 38.92 9.5⫻10⫺4 .025 0.18 45 0.986 215.09 1.6⫻10⫺2 .001 50.32 9.1⫻10⫺4 .019 0.19 50 0.985 196.99 1.9⫻10⫺2 .001 65.43 8.4⫻10⫺4 .015 0.19 55 0.984 185.28 2.2⫻10⫺2 .001 86.80 7.4⫻10⫺4 .011 0.19 60 0.983 178.64 2.5⫻10⫺2 .001 120.00 6.1⫻10⫺4 .008 0.18 65 0.983 176.56 2.8⫻10⫺2 .001 179.66 4.6⫻10⫺4 .006 0.18 70 0.984 179.27 3.0⫻10⫺2 .001 316.31 2.8⫻10⫺4 .003 0.17 75 0.984 187.88 3.1⫻10⫺2 .001 824.41 1.1⫻10⫺4 .001 0.16 80 0.986 205.24 3.2⫻10⫺2 .001 6.3⫻103 1.5⫻10⫺5 .000 0.14 85 0.988 238.18 3.0⫻10⫺2 .001 701.35 1.3⫻10⫺4 .001 0.12 90 0.990 306.28 2.7⫻10⫺2 .000 98.83 7.9⫻10⫺4 .010 0.10 95 0.994 488.81 1.9⫻10⫺2 .000 18.85 2.7⫻10⫺3 .049 0.07 100 0.998 1.4⫻103 7.8⫻10⫺3 .000 1.25 7.2⫻10⫺3 .380 0.02 Note—Bold χ 2 analysis p values indicate adequate fit ( p ⬎ .05), and bold linearity analysis p values indicate significant component ( p ⬍ .05).
Results and Discussion The recognition memory ROCs and z-ROCs (male vs. new and female vs. new) are shown in Figure 6, with associated parameter values in Table 6. The χ 2 analyses indicated that all recognition memory ROCs/z-ROCs were adequately fit by the unequal variance model, whereas the two-high threshold model did not provide an adequate fit in any case (Table 6). The individual participant χ 2 analysis results (Table 7) were generally consistent with the group χ 2 analysis, with the two-high threshold model not providing an adequate fit in any case and the unequal variance model not fitting either recognition memory ROC/z-ROC in Experiment 1 but providing an adequate fit to both recognition memory ROCs/z-ROCs in Experiment 2. To better assess the inadequate fits of the models to the recognition memory ROCs/z-ROCs in Experiment 1, the number of individual participant ROCs/z-ROCs that were adequately fit by each model were tallied, and the unequal variance model provided a significantly greater number of adequate fits than did the two-high threshold model (male vs. new, unequal variance model fit 11/15, two-high threshold model fit 0/15; female vs. new, unequal variance model fit 10/15, twohigh threshold model fit 0/15; both p values ⬍ .001, Fisher exact test). The χ 2 results were complemented by the linearity analysis, showing that all recognition memory ROCs were curvilinear (as indicated by the significant quadratic components) and all recognition memory z-ROCs were linear (with no significant quadratic components). To determine whether weaker memory strength was associated with a more linear source memory ROC, the collapsed source memory ROC results are considered
first (see Figures 7A and 7C and Table 6). Our encoding manipulation had the desired effect; the percent noise in Experiment 1 (43%) was significantly greater than that in Experiment 2 (35%; p ⬍ .001). This reduction in noise level across experiments was further illustrated by a significantly higher d′ corresponding to the collapsed source memory ROC in Experiment 2 (1.27), as compared with Experiment 1 (1.02; p ⬍ .001). We next assessed the shape of the collapsed source memory ROCs and z-ROCs in the two experiments. In agreement with our hypothesis, the collapsed source memory ROC was more curvilinear in Experiment 2 than in Experiment 1. Specifically, the quadratic component was significantly greater in Experiment 2 (⫺1.04) than in Experiment 1 (⫺0.64; p ⬍ .05). Although the collapsed source memory z-ROC was not significantly more linear in Experiment 2 than in Experiment 1, the small change in the value of the quadratic component (0.25 and 0.26, respectively) was in the predicted direction and of the same magnitude of change (0.01) shown in our simulation at the same noise levels (see Table 3, right column). In other words, the collapsed source memory ROCs are more linear (and the collapsed source memory z-ROCs are slightly more curvilinear) when participants are less likely to remember diagnostic source information. This result provides empirical evidence that increasing noise makes the ROC more linear and the z-ROC more curvilinear, which is consistent with the reanalysis of data from Yonelinas (1999, Experiment 2) and our simulation results. The χ 2 analysis of the collapsed source memory ROCs/ z-ROCs of both experiments showed that neither the unequal variance model nor the two-high threshold model
162
SLOTNICK AND DODSON
Figure 5. (A) ROCs derived from an unequal variance (UEV) model with noise ranging from 0% to 100%, in 20% increments. At 0% noise, model parameters were selected to approximate the UEV results of the refined source memory ROC derived from the reanalyzed data of Yonelinas (1999, Experiment 2); as such, the topmost ROC, shown by circles, is curvilinear by definition. Each ROC was fit with the UEV model. (B) The same ROCs in panel A each fit with the two-high threshold (2HT) model. (C) The corresponding z-ROCs each fit with the UEV model. (D) The corresponding z-ROCs each fit with the 2HT model.
provided an adequate fit. In contrast, the unequal variance model adequately fit both refined source memory ROCs/z-ROCs (Table 6). The identical pattern of results for the collapsed and refined source memory ROCs/ z-ROCs was observed in the individual participant χ 2 analysis (Table 7). These results replicate our reanalysis results of Yonelinas’s (1999, Experiment 2) data. The linearity analysis results, however, were mixed. The collapsed and refined ROCs in both experiments were curvilinear, given that all quadratic components were significant. The collapsed source memory z-ROCs in both experiments and the refined source memory z-ROC in Experi-
ment 1 were also curvilinear, which is not consistent with either the unequal variance model or the two-high threshold model. However, the refined source memory z-ROC in Experiment 2 was linear, as predicted by the unequal variance model. Overall, the results are consistent with our hypothesis that an increase in noise is associated with greater ROC linearity/z-ROC curvilinearity, as indicated by the significantly larger quadratic component for the refined than for the collapsed source memory ROC in both experiments (Experiment 1, ⫺1.45 vs. ⫺0.64, p ⬍ .001; Experiment 2, ⫺2.31 vs. ⫺1.04, p ⬍ .01) and by the smaller quadratic component for the
SUPPORT FOR A CONTINUOUS MEMORY MODEL
Old
New
Old
New
Table 4 Measured and Collapsed Confidence Ratings from Experiment 1 Female Male 1 2 3 4 5 6 7
Σ
Male Source 11 15 29 23 26 43 1 182 9 43 6 58 1 49 83 413
7 6 5 4 3 2 1 Σ
40 1 0 0 1 0 1 43
40 29 6 0 2 2 0 79
7 6 5 4 3 2 1 Σ
320 7 0 0 0 0 2 329
56 54 4 0 2 2 3 121
7 6 5 4 3 2 1 Σ
15 3 1 1 0 1 0 21
18 26 11 2 2 2 0 61
25 37 44 0 15 6 1 128
64 49 12 0 0 1 0 126
316 5 2 0 0 1 4 328
511 173 133 183 70 74 5 1,200
Female Source 25 22 20 39 24 33 25 46 38 2 187 1 8 47 9 4 48 2 2 61 0 105 435 103
38 25 7 0 1 2 0 73
33 1 0 0 0 0 0 34
514 183 120 190 67 58 68 1,200
17 29 9 3 1 2 1 62
16 0 0 0 0 0 0 16
96 149 166 306 110 203 170 1,200
New Old
New
9 30 34 2 15 5 0 95
7 31 58 295 75 188 168 822
14 30 53 3 17 5 1 123
refined than for the collapsed source memory z-ROC in both experiments (Experiment 1, 0.21 vs. 0.26, p ⬍ .01; Experiment 2, 0.03 vs. 0.25, p ⫽ .19).
linear when it is derived from data that only include diagnostic source information (i.e., the refined source memory ROC/z-ROC). The source memory ROC was shown to be linear and source memory z-ROC was shown to be curvilinear only when it was based on data that included many guessing responses (i.e., the collapsed source memory ROC/z-ROC). In addition, we constructed a model and showed that systematically adding noise linearizes—or flattens—a curvilinear source memory ROC and makes a linear z-ROC more curvilinear. Finally, we experimentally examined our hypothesis that source memory ROCs become more linear and source memory z-ROCs become more curvilinear under conditions in which participants are less likely to remember diagnostic source information. As predicted, these experiments revealed that source memory ROCs are more linear under noisy conditions and source memory z-ROCs are more curvilinear under noisy conditions. The present results also speak to distinguishing between models of recognition memory and source memory. In five of the six empirical examples evaluated, linearity analysis showed that the recognition memory ROCs were curvilinear and the z-ROCs were linear, replicating previous findings (Heathcote, 2003; Slotnick et al., 2000). These results are inconsistent with a two-high threshold model, thereby arguing against the multinomial model
Old
GENERAL DISCUSSION Does source memory retrieval occur in an all-or-none manner or in a continuous manner? High threshold models (e.g., Batchelder & Riefer, 1990; Yonelinas, 1999) predict that source memory is an all-or-none process, whereas signal detection models (e.g., Johnson et al., 1993; Slotnick et al., 2000) predict that source memory is a continuous process. Yonelinas (1999) observed linear source memory ROCs and curvilinear z-ROCs— markers of an all-or-none process—whereas Slotnick et al. and others observed curvilinear source memory ROCs and linear z-ROCs (Qin et al., 2001; see also Hilford et al., 2002), supporting a continuous process. We have resolved these seemingly inconsistent results by showing that source memory ROCs are naturally curvilinear and source memory z-ROCs are naturally linear but can appear linear and curvilinear, respectively, when the source memory ROC/z-ROC is computed from data that includes frequent guessing (i.e., noise). Specifically, we reanalyzed a dataset of Yonelinas (1999) and showed that the source memory ROC is curvilinear and z-ROC is
163
New
Old
New
Table 5 Measured and Collapsed Confidence Ratings From Experiment 2 Female Male 1 2 3 4 5 6 7
Σ
Male Source 19 17 24 17 45 31 0 66 1 70 2 64 0 55 91 320
7 6 5 4 3 2 1 Σ
36 0 1 1 0 0 0 38
15 34 9 0 1 0 0 59
7 6 5 4 3 2 1 Σ
374 15 2 1 0 0 5 397
56 65 17 1 0 2 1 142
7 6 5 4 3 2 1 Σ
30 2 1 0 0 0 1 34
4 25 15 0 0 2 0 46
29 32 50 4 2 0 1 118
83 47 12 0 0 0 0 142
419 9 2 0 0 0 2 432
618 163 150 71 74 66 58 1,200
Female Source 37 18 22 32 20 36 52 32 43 3 68 0 1 68 3 1 58 2 0 64 0 126 328 106
22 26 6 0 0 0 0 54
44 2 1 0 0 0 0 47
573 196 153 73 72 63 70 1,200
4 21 8 0 0 0 0 33
29 1 1 0 0 0 1 32
88 90 208 149 210 201 254 1,200
New Old
New
8 15 72 5 5 4 0 109
6 13 65 142 200 194 250 870
7 13 46 2 5 1 2 76
164
SLOTNICK AND DODSON
Figure 6. (A) Male versus new recognition memory ROC from Experiment 1 and best-fit unequal variance model and two-high threshold model. (B) Female versus new recognition memory ROC from Experiment 1. (C) Male versus new recognition memory ROC from Experiment 2. (D) Female versus new recognition memory ROC from Experiment 2. (E–H) Corresponding recognition memory z-ROCs.
as a viable model of recognition memory. The χ 2 analysis provided convergent results as the unequal variance model provided an adequate fit in five of the six recognition memory ROCs/z-ROCs evaluated (while the twohigh threshold model never provided an adequate fit). As we have pointed out before (Slotnick et al., 2000), it is quite astounding that the two-parameter unequal variance model so frequently provides an adequate fit to such a complex cognitive process as recognition memory. The linearity analysis of our two experiments indicated that both the collapsed source memory ROC and z-ROC were curvilinear (which is not predicted by either the unequal variance model or two-high threshold model),
failing to replicate Yonelinas (1999), who observed linear ROCs and curvilinear z-ROCs. By contrast, the linearity analysis of the refined source ROCs/z-ROCs, both from the reanalysis of Yonelinas’s (1999, Experiment 2) data and our two experiments, revealed a curvilinear refined source memory ROC in all cases and a linear refined source memory z-ROC in two of three cases. The refined source ROC/z-ROC pattern of results argues against the two-high threshold models of source memory (i.e., the multinomial model and dual-process model), but is consistent with the unequal variance model of source memory. Similar to the recognition memory results, the unequal variance model provided an adequate fit to the refined source memory ROC/z-ROC in all cases,
SUPPORT FOR A CONTINUOUS MEMORY MODEL
165
Figure 6 (Continued).
whereas the two-high threshold model never provided an adequate fit. It should also be mentioned that according to the dual-process model, the refined source memory ROCs/z-ROCs were constructed from the data in which recollection (a two-high threshold process) would be expected to play the largest role (i.e., at the highest confidence “old” level). However, the observed refined source memory ROCs and z-ROCs were relatively more curvilinear and linear, respectively, than were the collapsed source memory ROCs and z-ROCs, which is in direct opposition to the pattern of results predicted by the dualprocess model. In summary, the present recognition memory results disconfirmed the multinomial model and the present source memory results disconfirmed the multinomial model and the dual-process model (i.e., two-high thresh-
old models of source memory). Both recognition memory results and source memory results, however, were largely consistent with an unequal variance model of memory retrieval. The present results question previous reports of linear associative memory ROCs/curvilinear z-ROCs (Yonelinas, 1997; Yonelinas, Kroll, Dobbins, & Soltani, 1999), used as evidence to support the dual-process model (i.e., a high-threshold model under conditions of equal item familiarity). In those studies, the associative memory ROCs/z-ROCs were effectively collapsed (because old – new recognition ratings were not collected), which may have led to the linearization of the associative memory ROCs and produced more curvilinear z-ROCs. Supporting this possibility, Kelley and Wixted (2001) conducted multiple associative memory experiments using weak and
166
SLOTNICK AND DODSON Table 6 Recognition Memory and Source Memory ROC and z-ROC Parameters From Experiments 1 and 2 Parameter Values d′ σn/σs MN FN MFc MFr
MN FN MFc MFr
MN FN MFc MFr
0.93⫾.023 0.94⫾.022 1.02⫾.090 1.42⫾.059
0.75⫾.027 0.73⫾.025 0.94⫾.081 0.89⫾.060
MN FN MFc MFr
5.96 5.20 69.32 9.01
45.58 58.94 32.82 31.78
.202 .267 .000 .061
ROC Linearity Analysis Results MSe lin plin Fquad MSe quad
R2lin
Flin
0.974 0.967 0.992 0.938
150.43 116.00 469.55 60.28
R2lin
Flin
0.996 0.996 0.970 0.979
931.60 939.75 130.62 189.82
1.3⫻10⫺3 1.7⫻10⫺3 9.2⫻10⫺4 2.1⫻10⫺3
37.11 36.71 285.51 243.50
.000 .000 .000 .002
1.3⫻10⫺4 1.7⫻10⫺4 1.3⫻10⫺5 3.7⫻10⫺5
z-ROC Linearity Analysis Results MSe lin plin Fquad MSe quad 2.6⫻10⫺3 2.4⫻10⫺3 3.5⫻10⫺2 8.1⫻10⫺3
Parameter Values d′ σn/σs MN FN MFc MFr
Experiment 1 (Higher Noise) χ 2 Analysis Results 2 χ UEV pUEV χ 22HT
1.25⫾.022 1.20⫾.030 1.27⫾.077 1.68⫾.050 Flin
0.917 0.893 0.973 0.859
44.41 33.38 142.11 24.35
R2lin
Flin
1.0⫻10⫺3 3.1⫻10⫺3 2.0⫻10⫺3 6.1⫻10⫺4
2.20 7.44 37.01 1.46
cquad
.009 .009 .001 .001
⫺0.51 ⫺0.57 ⫺0.64 ⫺1.45
pquad
cquad
.072 .758 .003 .005
76.98 106.66 91.27 68.71
.699 .114 .000 .835
ROC Linearity Analysis Results MSe lin plin Fquad MSe quad 2.7⫻10⫺3 4.0⫻10⫺3 2.2⫻10⫺3 3.7⫻10⫺3
.003 .005 .000 .008
582.10 309.74 25.52 90.98
5.3⫻10⫺5 1.3⫻10⫺4 3.3⫻10⫺4 1.8⫻10⫺4
z-ROC Linearity Analysis Results MSe lin plin Fquad MSe quad
.000 .000 .000 .000
pquad
Experiment 2 (Lower Noise) χ 2 Analysis Results 2 χ UEV pUEV χ 22HT
0.70⫾.024 0.71⫾.033 0.96⫾.068 0.99⫾.047
R2lin
7.41 0.11 74.70 59.35
.000 .000 .000 .000
p2HT
0.06 0.01 0.26 0.21
p2HT .000 .000 .000 .000
pquad
cquad
.000 .000 .015 .002
⫺0.74 ⫺0.87 ⫺1.04 ⫺2.31
pquad
cquad
MN 0.998 1.8⫻103 9.4⫻10⫺4 .000 0.01 1.3⫻10⫺3 .933 0.00 FN 0.994 639.50 2.7⫻10⫺3 .000 2.43 2.0⫻10⫺3 .217 ⫺0.06 0.981 204.57 1.9⫻10⫺2 .000 28.44 2.4⫻10⫺3 .013 0.25 MFc MFr 0.997 1.5⫻103 1.0⫻10⫺3 .000 0.25 1.2⫻10⫺3 .651 0.03 Note—The noise levels in the collapsed source memory ROCs/z-ROCs of Experiments 1 and 2 were 43% and 35%, respectively. Bold χ 2 analysis p values indicate adequate fit ( p ⬎ .05), and bold linearity analysis p values indicate significant component ( p ⬍ .05).
Table 7 Individual Participant χ 2 Analysis Results From Experiments 1 and 2
χ 2UEV MN FN MFc MFr
χ 22HT
p2HT
Experiment 1 (Higher Noise) 107.66 .000 414.94 113.60 .000 487.33 510.02 .000 421.17 70.21 .173 443.58
.000 .000 .000 .000
pUEV
Experiment 2 (Lower Noise) MN 30.33 1.000 355.95 FN 42.98 .952 550.76 MFc 356.43 .000 395.05 MFr 43.68 .944 305.82 Note—Bold p values indicate adequate fit ( p ⬎ .05).
.000 .000 .000 .000
SUPPORT FOR A CONTINUOUS MEMORY MODEL
167
Figure 7. (A) Source memory ROC constructed by collapsing over old–new responses from Experiment 1. (B) Refined source memory ROC constructed by collapsing over the top two old–new ratings from Experiment 1. (C) Collapsed source memory ROC from Experiment 2. (D) Refined source memory ROC from Experiment 2 constructed from the top two old–new ratings. (E–H) Corresponding source memory z-ROCs.
strong associative memory strength conditions, similar to the present experiments. In the weak conditions, which approximately matched the associative memory strength of Yonelinas’s studies, the χ 2 analysis results were inconclusive, sometimes supporting the two-high threshold model and sometimes supporting the unequal variance model. However, in the strong conditions, the unequal variance model provided an adequate fit in all cases, whereas the two-high threshold model never provided an adequate fit. These associative memory results parallel the present source memory results and indicate that when there is little diagnostic associative memory information (as in the weaker source memory strength conditions), the naturally curvy associative memory ROC may be flattened and appear linear, and the naturally linear associative memory z-ROC may appear more curvilinear.
The unequal variance memory model supported here is fully consistent with a variant of the classic signal detection model (Hilford et al., 2002). In that model, an additional parameter defines the proportion of items that were unsuccessfully encoded; these items are forgotten and treated as new. The additional parameter in this model does not represent a threshold process (as recollection does in the dual-process model), because forgotten items are modeled as part of the new Gaussian distribution such that there are no thresholds in decision space above or below which any distribution exists in isolation (i.e., the marker for a threshold model; see Figure 2D). Hilford et al. (2002) essentially remove the effect of forgotten items from the source memory analysis by fitting an additional parameter. In the refined source memory ROC/z-ROC analysis used in the present study, we re-
168
SLOTNICK AND DODSON
Figure 7 (Continued).
moved the same items (i.e., forgotten items, with lower old –new confidence ratings). Thus, both procedures eliminate noise from the source memory analysis but operate in slightly different ways. The same line of argument for refining the source memory ROC/z-ROC might also be made for refining the recognition memory ROC/z-ROC, given that they are typically collapsed over source response ratings. In the male source versus new comparison, for example, male items might be incorrectly remembered as female items (i.e., source confusion), and new items might be falsely remembered as female items (i.e., false memories). A potential difficulty in producing the refined recognition memory ROC/z-ROC is that unlike the source memory analysis in which the lower recognition memory confidence ratings contain no diagnostic source information (allowing for an objective method to remove noise), all source memory confidence ratings contain old –new recognition memory information (see Tables 1, 4, and 5). Still, the percent noise in the collapsed recognition mem-
ory ROC/z-ROC could be estimated from source memory ratings representing the source of interest and including a fraction of those in the direction of the alternative source (which manifests the effects of source confusion or false memory). For example, within the male source and new response matrices shown in Tables 4 and 5 (corresponding to the male source vs. new comparison), columns 1–3 could be taken as containing no diagnostic recognition memory information (and similarly, columns 5–7 could be considered nondiagnostic for the female source vs. new comparison). However, using this procedure, the collapsed recognition memory ROCs/z-ROCs from our two experiments contained 12%–18% noise, which is substantially lower than the 35%– 43% noise in the collapsed source memory ROCs/z-ROCs. Given these relatively low recognition memory noise levels, one might expect little distortion of the collapsed recognition memory ROC/z-ROC, obviating the need to compute a refined recognition memory ROC/z-ROC. Indeed, the present results and previous results (Heathcote, 2003;
SUPPORT FOR A CONTINUOUS MEMORY MODEL
Slotnick et al., 2000) indicate that collapsed recognition memory ROCs/z-ROCs are well fit by an unequal variance model; therefore, the distortion of the recognition memory ROC/z-ROC due to collapsing over source memory response judgments appears to have little (if any) measurable effect and may well be ignored for all practical purposes. The present analysis provides support for an unequal variance model of recognition memory and source memory and rules out two-high threshold models (i.e., the multinomial model and dual-process model) as viable models of recognition memory and source memory. However, the present results do not rule out all threshold models, and more complex multithreshold models may represent our pattern of results. To determine the degree to which this might be so (given that the two-high threshold model never provided an adequate fit), we fit a threethreshold model (i.e., a combination of the two-high threshold model and Luce’s [1963] low threshold theory model) and a four-threshold model (i.e., a combination of the two-high threshold model and Green’s two-threshold model; see Swets, 1964) to the three refined source memory ROCs from the present study. Although the fourthreshold model provided an adequate fit in all cases, such a model is associated with five states of memory retrieval (vs. three states for the two-high threshold model). A fivestate model goes well beyond any reasonable model of recognition memory and source memory that has been proposed to date; in fact, such multithreshold models have been considered variants of unequal variance signal detection models (Swets, 1964). Therefore, the unequal variance model of recognition memory and source memory is the most parsimonious in that it adequately fits the data and is associated with a defensible cognitive process. The two-high threshold model assumes all-or-none memory for source, whereas the unequal variance model assumes a continuum of memory strength from no memory to complete memory for source. In support of the unequal variance model, Dodson, Holland, and Shimamura (1998) have shown that recollection is not an all-or-none process; participants often remember the correct gender of a previously heard speaker when they are unable to remember the particular speaker. Further evidence for partial source memory has been shown to occur during source confusion (Dodson & Johnson, 1996), and more recently in a source memory remember/know paradigm (Hicks, Marsh, & Ritschel, 2002), where a high rate of correct source trials was associated with “know” responses (according to the dual-process model, correct source responses should be largely mediated by recollection and thus should be associated with “remember” responses). The present results provide compelling support for an unequal variance model of both recognition memory and source memory. Considering this, the all-or-none process of memory retrieval (as assumed in the multinomial model and the recollection component of the dual-process model), although intuitively appealing, should be reconsidered as a viable description of memory retrieval. On
169
the basis of the present evidence, we argue that the vast range of memorial experiences, from incomplete memories to extremely vivid memories that seem to be all-ornone would be better construed as continuous in nature. REFERENCES Atkinson, R. C., & Juola, J. F. (1974). Search and decision processes in recognition memory. In D. H. Krantz, R. C. Atkinson, R. D. Luce, & P. Suppes (Eds.), Contemporary developments in mathematical psychology: I. Learning, memory and thinking (pp. 243-293). San Francisco: Freeman. Banks, W. P. (2000). Recognition and source memory as multivariate decision processes. Psychological Science, 11, 267-273. Batchelder, W. H., & Riefer, D. M. (1990). Multinomial processing models of source monitoring. Psychological Review, 97, 548-564. Bayen, U. J., Murnane, K., & Erdfelder, E. (1996). Source identification, item detection, and multinomial models of source monitoring. Journal of Experimental Psychology: Learning, Memory, & Cognition, 22, 197-215. Brown, S., & Heathcote, A. (2003). Averaging learning curves across and within participants. Behavior Research Methods, Instruments, & Computers, 35, 11-21. Clarke, F. R., Birdsall, T. G., & Tanner, W. P., Jr. (1959). Two types of ROC curves and definitions of parameters. Journal of the Acoustical Society of America, 31, 629-630. DeCarlo, L. T. (2003). Source monitoring and multivariate signal detection theory, with a model for selection. Journal of Mathematical Psychology, 47, 292-303. Dodson, C. S., Holland, P. W., & Shimamura, A. P. (1998). On the recollection of specific and partial source information. Journal of Experimental Psychology: Learning, Memory, & Cognition, 24, 11211136. Dodson, C. S., & Johnson, M. K. (1996). Some problems with the process-dissociation approach to memory. Journal of Experimental Psychology: Learning, Memory, & Cognition, 125, 181-194. Glanzer, M., Kim, K., Hilford, A., & Adams, J. K. (1999). Slope of the receiver-operating characteristic in recognition memory. Journal of Experimental Psychology: Learning, Memory, & Cognition, 25, 500-513. Green, D. M., & Swets, J. A. (1966). Signal detection theory and psychophysics. New York: Wiley. Heathcote, A. (2003). Item recognition memory and the receiver operating characteristic. Journal of Experimental Psychology: Learning, Memory, & Cognition, 29, 1210-1230. Hicks, J. L., Marsh, R. L., & Ritschel, L. (2002). The role of recollection and partial information in source monitoring. Journal of Experimental Psychology: Learning, Memory, & Cognition, 28, 503-508. Hilford, A., Glanzer, M., Kim, K., & DeCarlo, L. T. (2002). Regularities of source recognition: ROC analysis. Journal of Experimental Psychology: General, 131, 494-510. Jacoby, L. L. (1991). A process dissociation framework: Separating automatic from intentional uses of memory. Journal of Memory & Language, 30, 513-541. Johnson, M. K., Hashtroudi, S., & Lindsay, D. S. (1993). Source monitoring. Psychological Bulletin, 114, 3-28. Kelley, R., & Wixted, J. T. (2001). On the nature of associative information in recognition memory. Journal of Experimental Psychology: Learning, Memory, & Cognition, 27, 701-722. Luce, R. D. (1963). A threshold theory for simple detection experiments. Psychological Review, 70, 61-79. Macmillan, N. A., & Creelman, C. D. (1991). Detection theory: A user’s guide. New York: Cambridge University Press. Press, W. H., Teukolsky, S. A., Vetterling, W. T., & Flannery, B. P. (1996). Numerical recipes in C (2nd ed.). New York: Cambridge University Press. Qin, J., Raye, C. L., Johnson, M. K., & Mitchell, K. J. (2001). Source ROCs are (typically) curvilinear: Comment on Yonelinas (1999). Journal of Experimental Psychology: Learning, Memory, & Cognition, 27, 1110-1115.
170
SLOTNICK AND DODSON
Ratcliff, R., McKoon, G., & Tindall, M. (1994). Empirical generality of data from recognition memory receiver-operating characteristic functions and implications for the global memory models. Journal of Experimental Psychology: Learning, Memory, & Cognition, 20, 763-785. Riefer, D. M., Hu, X., & Batchelder, W. H. (1994). Response strategies in source monitoring. Journal of Experimental Psychology: Learning, Memory, & Cognition, 20, 680-693. Slotnick, S. D., Klein, S. A., Dodson, C. S., & Shimamura, A. P. (2000). An analysis of signal detection and threshold models of source memory. Journal of Experimental Psychology: Learning, Memory, & Cognition, 26, 1499-1517. Swets, J. A. (1964). Is there a sensory threshold? In J. A. Swets (Ed.), Signal detection and recognition by human observers; contemporary readings (pp. 122-144). New York: Wiley. Yonelinas, A. P. (1994). Receiver-operating characteristics in recognition memory: Evidence for a dual-process model. Journal of Experimental Psychology: Learning, Memory, & Cognition, 20, 13411354.
Yonelinas, A. P. (1997). Recognition memory ROCs for item and associative information: The contribution of recollection and familiarity. Memory & Cognition, 25, 747-763. Yonelinas, A. P. (1999). The contribution of recollection and familiarity to recognition and source-memory judgments: A formal dualprocess model and an analysis of receiver operating characteristics. Journal of Experimental Psychology: Learning, Memory, & Cognition, 25, 1415-1434. Yonelinas, A. P., Kroll, N. E. A., Dobbins, I. G., & Soltani, M. (1999). Recognition memory for faces: When familiarity supports associative recognition judgments. Psychonomic Bulletin & Review, 6, 654-661. Yu, J., & Bellezza, F. S. (2000). Process dissociation as source monitoring. Journal of Experimental Psychology: Learning, Memory, & Cognition, 26, 1518-1533. (Manuscript received January 19, 2004; revision accepted for publication May 21, 2004.)