The presented traces include the ... mouse and keyboard, and the screen states, the source code ... Figure 1 depicts the design of our system to visualize the.
Support for Understanding GUI Programs by Visualizing Execution Traces Synchronized with Screen Transitions Tatsuya Sato, Buntarou Shizuki, and Jiro Tanaka Department of Computer Science, University of Tsukuba {tatsuya,shizuki,jiro}@iplab.cs.tsukuba.ac.jp Abstract To support understanding a specific GUI functionality in a program, we propose a visualization technique that presents the correspondence between the screens before and after the operation, as well as the traces of the source code executed by the operation. The presented traces include the executed lines and the method calls, which are fundamental information for understanding the functionality. They are represented as highlights that are superimposed on the entire source code.
1. Introduction To maintain, reuse, and extend the functionality of a program, the developer needs to understand the program. However, identifying the source code that corresponds to a specific GUI functionality is difficult for several reasons. Usually, to understand a functionality, it is vital for the developer to identify the inputs and outputs, and then to relate those to the implementation. However, in the case of a GUI functionality, according to the inputs, which are the operations done with the mouse and keyboard, and the screen states, the source code is executed dynamically, and the updates on the screen are displayed as outputs. Therefore, the developer must first grasp the GUI functionality of the program as a change on the screen, and understand the implementation based on it. Moreover, the implementation of one GUI functionality is scattered in the source code, i.e., it is usually coded in several files. Therefore, before it is possible to understand the functionality, the developer must explore those files, and extract the corresponding implementation from them. As an example, assume that the developer wants to understand the drawing functionality of a drawing tool. The implementation of the drawing functionality is separate for each role, such as the drawing processor, the shape object
model, and the event handler. At runtime, the program handles the user’s operations, changes the states of the shape objects, and draws objects with the states. To understand this functionality, the developer must acquire the screen changes during the consecutive mouse operations and the parts of the executed source code. Reading static representations such as documents and source code is not satisfactory, since it does not directly provide the developer with correspondence among the inputs (i.e., GUI operations and screen states), the implementation (i.e., the scattered source code), and the outputs (i.e., the resulting screen states), and thus forces the developer to imagine the correspondence. On the other hand, a debugger or visualization tool based on dynamic execution (e.g., [1, 2, 6, 7, 8]) provides techniques for understanding the program based on dynamic analysis. For example, a debugger makes it possible to trace the execution while suspending the program transiently by using break points and issuing the trace step commands. However, these dynamic techniques also do not provide the above correspondence, and therefore, understanding the functionality might be difficult or impossible. Consider the functionality in which the screen changes during consecutive mouse operations. When the debugger is used, the execution must be suspended in order to analyze the program. Therefore, the developer cannot analyze the functionalities that use consecutive operations or include the screen changes during the operations. Our key idea for providing support to the developer to easily understand GUI functionality is to present the correspondence with the operations and the screen states as the inputs, the screen changes as the outputs, and the executed source code as the implementation. We designed and implemented a system called ORCA (Operation Reaction Code Analyzer), that visualizes such correspondence and provides user interfaces for easy access to the correspondences, making it easy to understand the GUI functionalities of a Java GUI program.
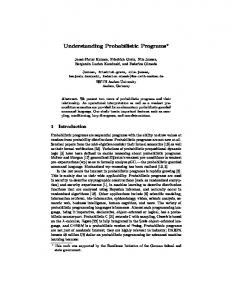
Source Code Representation
Executed parts during the operation
Screen before the operation
Thumbnails
mouse action[1]. In Seesoft, source code is presented per file. However, because GUI programs are programmed using objectoriented designs, our system presents the source code per the class definition. Figure 2 shows the representation of a class definition. A class definition is represented as the source code itself with the class name label. By using this representation, all of the class definitions comprising the target program are tiled in the display region.
Screen after the operation
ClassA class ClassA { ClassB classB;
Figure 1. Presentation of correspondence between executed source code parts and the screen change
void m1() { classB.m1(); }
class name label
source code
・・・ }
2. Visualization Approach and Design Figure 2. Representation of a class definition Figure 1 depicts the design of our system to visualize the correspondence. The system captures the screen image before and after each operation, and presents the pair of the two thumbnails as the screen change caused by the operation, with the entry method name. The name works as the event name based on the operation. At the same time, the system highlights the parts of source code that were executed while the screen change occurred. Thus, the system enables the developer to grasp, “Which parts of the source code were executed while operating the GUI?” There are two ways of tracing the execution of a program and visualizing the information: the offline display and the online display. In the above approach, the offline display visualizes the information after the execution by the operation. On the contrary, the online display immediately updates the visualized information according to the execution by the operation. Our approach utilizes both the offline and online displays. While the user is operating the GUI, the display visualizes the correspondences immediately after an operation is performed online dynamically, and then leaves their results for later browsing offline. This offline re-browsing is also useful for understanding the functionality requiring the multiple operations. We use a similar approach to Seesoft[1] to represent the executed source code parts. Seesoft is a code-based program visualization technique. Seesoft visualizes the entire source code within one screen. Each line of the source code is represented as one segment, which is colored according to the result of an analysis. Thus, Seesoft can represent interesting patterns using colors. This representation is effective to understand patterns between the files or the source code in the initial stage of development, and also to find the scattered execution parts of the real-time execution such as the
Our strategy to present dynamically analyzed information is to superimpose them onto the representation of the entire source code so that the developer can easily grasp both. Specifically, the representation of each dynamically analyzed piece of information is: Lines of the executed source code: The lines of the executed source code are represented as the highlighted lines in the class definition. In Figure 3, the executed lines are highlighted with a bright color. Method calls: A method call is represented as the directed edge that connects the calling method and the called method. In Figure 3, the system visualizes the method call from Class1.m1() to Class2.m1().
ClassA class ClassA { ClassB classB; void m1() { classB.m1(); } void m2() { ..... } }
ClassB
Call Edge
class ClassB { Field field; ….. void m1() { ….. } ….. }
An executed line is highlighted.
Figure 3. Representation of dynamically analyzed information
Class hierarchy: The arrangement of each class definition is based on a tree structure of a parent-child relationship in the class hierarchy. One challenge is how to
display the entire source code within one screen while maintaining the tree structure. We propose a spacefilling technique that extends TreeMap[5]. Our technique gives a region for each element. Following the conventional tree representation where a child is arranged under its parent, our technique renders a tree as shown in Figure 4. At the left of this figure is a tree whose root is ClassA. At the right is the result of the allocation to this tree. ClassA
ClassB
ClassD
ClassE
ClassA
Base Class
ClassC
ClassB mapping
Inherited Class
ツリー表示領域 ClassD
ClassC
ClassE
Figure 4. Representation of class hierarchy Displaying the entire source code within one screen means that when large-scale source code or source code that includes a complex class hierarchy is displayed, the readability decreases. In such cases, it is difficult for the developer to focus on an interesting call edge, to read the source code related to the edge, or to follow the edge before/after the call. To help the developer trace for call edges, our system provides Zooming Presentation. This enlarges the focused part of the source code while it shrinks the other parts. By pressing buttons, the developer can change the focus forward/backward along the static graph according to the order of method calls. While SHriMP[3] also provides a focus + context technique[4], which enlarges the focused part while keeping the overview, for browsing source code, Zooming Presentation adopts our own focus + context algorithm. The display region is computed according to the importance given to each class. Figure 5 shows an example of Zooming Presentation. Assume that ClassC is the most-focused class. While the left image shows the basic allocation, the right image shows the allocation that focuses on ClassC. We can see that the largest region is allocated for ClassC at the right side of the figure.
3. ORCA system We implemented ORCA based on our visualization system design. An overview of ORCA is shown in Figure 6. The ORCA user interface consists of a control panel, graph panel, and thumbnail panel. The graph panel visualizes the source code, as shown in the middle of the figure, in which
Figure 5. Allocation based on importance the entire source code is shrunk in order to be displayed within the screen, thus making it suitable for browsing. In the source code, a method call and executed lines are highlighted. When many or complex method calls are visualized, the displayed edges might make it difficult to grasp the executed lines. To deal with this problem, ORCA enables the user to turn the method call presentation on and off. The thumbnail panel presents the screen transitions caused by the execution of the target program as an array of thumbnail (shown at the bottom of Figure 6). Whenever the GUI is operated, the system captures the screen before and after the operation. The thumbnail panel presents transitions between subsequent captured screens. In Figure 6, the highlighted screens show the transitions that are being examined. When one is selected, the graph panel visualizes the executed source code corresponding to the selected transition. By pressing buttons on the control panel, the user can start/restart the target program and do step tracing (shown at the top of Figure 6). Step tracing allows the developer to trace one edge of the method calls and examine the visualized information in detail. For each step, ORCA displays the source code in Zooming Presentation that focuses on the method call at that point. The system overview shown in Figure 6 is the result when the system is running a drawing tool. This drawing tool consists of roughly 1100 lines of code. The code is organized into 19 classes, whose inheritance tree has a maximum of two depths. If the developer wants to understand the GUI functionalities of the program, she/he browses the visualized information while operating its GUI directly. Zooming Presentation is shown in Figure 7. In the figure, a method in ClassA calls a method in ClassB. Because ClassA (upper left) and ClassB (lower right) are the focused classes in this scene, these classes are zoomed. Additionally, ClassC is zoomed because it is the parent of ClassB. The arrow in the center of the display is the edge of the focused method call. The lines of code around the executed ones are also zoomed.
4. Implementation We built ORCA as an Eclipse plug-in to integrate our visualization system with an IDE to enable the user to an-
Control Panel
Graph Panel Screen transitions by operations
Executed parts during the operation
Thumbnail Panel
Figure 6. Overview of ORCA
C
A B Zooming in on focused classes and lines Highlights of focused call edges
Figure 7. Zooming Presentation based on importance
alyze the target program dynamically with ORCA. To analyze the behavior of Java programs, the system requires both the static information (such as class hierarchy and methods and fields of each class) and the dynamically analyzed information (such as method calls and field changes during the execution). The system acquires the former by using Java Development Tools API, and the latter by using Java Debug Interface API. Piccolo.Java1.2 is used to render Zooming Presentation. Piccolo is a toolkit that supports the building of a zooming interface. We used Robot class (in the Java AWT package) to capture screen snapshots for thumbnails. In our experimental use of ORCA, the above implementation enabled us to comfortably visualize and examine a GUI program comprising several thousand lines of code.
5. Conclusion In this paper, we described ORCA, a visualization system that supports to understand a specific GUI functionality in a program. Our approach provides the presenta-
tion of the correspondence with each GUI operation, the screen changes, and the executed source code, which are fundamental information for understanding the functionality. Thus, the system allows the developer to build a mental map with the inputs and outputs and the implementation of the functionality.
References [1] Stephen G. Eick, Joseph L. Steffen, and Eric E. Sumner, Jr: Seesoft - A Tool For Visualizing Line Oriented Software Statistics , IEEE Transactions on Software Engineering, Vol. 18, No. 11, pp. 957–968, 1992. [2] Minoru Terada: ETV - a Program Trace Player for Students, Proceedings of ACM Special Interest Group on Computer Science Education 2005, pp. 118–122, 2005. [3] Margaret A. Storey, Casey Best, and Jeff Michaud: SHriMP Views - An Interactive Environment for Exploring Java Programs, Proceedings of IEEE International Workshop on Program Comprehension 2001, pp. 111–112, 2001. [4] George W. Furnas: Generalized Fisheye Views, Proceedings of ACM Special Interest Group on Computer-Human Interaction’86, pp. 16–23, 1986. [5] Ben Shneiderman: Tree Visualization with tree-maps - 2d space-filling approach, ACM Transactions on Graphics, Vol. 11, No. 1, pp. 92–99, 1992. [6] Steven P. Reiss: Visualizing Java in Action, Proceedings of ACM Software Visualization 2003, pp. 57–65, 2003. [7] Steven P. Reiss and Manos Renieris: JOVE - Java as it Happens, Proceedings of ACM Software Visualization 2005, pp. 115–124, 2005. [8] Paul V. Gestwicki and Bharat Jayaraman: Interactive Visualization of Java Programs, Proceedings of IEEE Human Centric Computing, Languages, and Environments 2002, pp. 226– 235, 2002.