Abstract—Continuous Integration (CI) has become an estab- lished best practice
of ...... Improving Software Quality and Reducing Risk. Addison-Wesley, 2007.
Zurich Open Repository and Archive University of Zurich Main Library Strickhofstrasse 39 CH-8057 Zurich www.zora.uzh.ch
Year: 2014
Supporting continuous integration by mashing-up software quality information Brandtner, Martin; Giger, Emanuel; Gall, Harald
Abstract: Continuous Integration (CI) has become an established best practice of modern software development. Its philosophy of regularly integrating the changes of individual developers with the mainline code base saves the entire development team from descending into Integration Hell, a term coined in the field of extreme programming. In practice CI is supported by automated tools to cope with this repeated integration of source code through automated builds, testing, and deployments. Currently available products, for example, Jenkins-CI, SonarQube or GitHub, allow for the implementation of a seamless CI-process. One of the main problems, however, is that relevant information about the quality and health of a software system is both scattered across those tools and across multiple views. We address this challenging problem by raising awareness of quality aspects and tailor this information to particular stakeholders, such as developers or testers. For that we present a quality awareness framework and platform called SQA-Mashup. It makes use of the service-based mashup paradigm and integrates information from the entire CI-toolchain in a single service. To evaluate its usefulness we conducted a user study. It showed that SQA-Mashup’s single point of access allows to answer questions regarding the state of a system more quickly and accurately than standalone CI-tools.
Posted at the Zurich Open Repository and Archive, University of Zurich ZORA URL: https://doi.org/10.5167/uzh-85632 Originally published at: Brandtner, Martin; Giger, Emanuel; Gall, Harald (2014). Supporting continuous integration by mashingup software quality information. In: IEEE CSMR-WCRE 2014 Software Evolution Week (CSMRWCRE), Antwerp, Belgium, 3 February 2014 - 6 February 2014, 109-118.
Supporting Continuous Integration by Mashing-Up Software Quality Information Martin Brandtner, Emanuel Giger, and Harald Gall University of Zurich, Department of Informatics, Switzerland Email: {brandtner, giger, gall}@ifi.uzh.ch
respective builds. Second, these build dates can then be used to answer the question itself by investigating, e.g., commit logs, file-diff data, build details, issue details etc. However, to obtain the relevant information a developer must access several different tools and navigate through multiple views. Additionally, the scope covered by modern CI-toolchains is not limited to build break and test failures. Quality measurements, such as code metrics, violations of coding guidelines, or potential bugs, are computed with each integration run. They provide an immediate feedback circuit for recently committed source code changes. Currently, this immediate feedback is limited to email notifications from each CI-tool due to the missing integration along a CI-toolchain. Integration approaches, such as the work of Singer et al. [3], address only tools used by developers during the creation of source code. We derived seven specific tool requirements from the literature (see Table I) and implemented a proof-of-concept mashup for data integration and a front-end for its representation. Our framework and platform called SQA-Mashup is highly extensible and integrates information from various CI-tools I. I NTRODUCTION such as BitBucket, GitHub, Jenkins-CI, and SonarQube. The A fundamental aspect of Continuous Integration (CI) ac- graphical front-end of SQA-Mashup is role-based and supports cording to Fowler is visibility: ”[...] you want to ensure that tailored views associated to different stakeholders in the context everyone can easily see the state of the system and the changes of a software project. In this paper we use the term stakeholder that have been made to it.”[1]. The integration of a modern CI- to refer to developers and testers as these two roles are currently toolchain within the development process of a software project supported. However, we emphasize that our approach can be is fully automated, and its execution is triggered after every extended by including views for other stakeholders, such as commit. Developers or testers perceive the CI process most software architects or project managers. often only in case of a build break or test failure. In such a case, The developer view provides code-related measurements, they get an automatically generated notification, for example, such as code complexity etc.; the tester view provides testingvia email. A developer can then fix the problem using this related measurements such as test coverage etc. To validate information. This kind of exception-driven behavior helps to our approach we defined the following research question: detect and fix problems as early as possibly during integration RQ: How do stakeholders perform in answering quesruns. Even in the absence of build or test failures, modern tions about software quality with SQA-Mashup compared CI-tools generate a bulk of data with each commit. This data to the use of standalone CI-tools? is scattered across the entire CI-toolchain and analyzing it, for We answered this research question with a user study that we instance, to monitor quality of a system, is a time consuming conducted with 16 participants on the JUnit project. The results task. This can delay the rapid feedback cycles of CI and one of our study show empirical evidence that an integrated platform of its major benefits is then not realized. has substantial advantages in terms of accuracy of answers and The need for an integration of the tools used in a CI- time needed to answer questions: information needs covered landscape is expressed in studies that address the information by an integration of CI-tools lead to more accurate answers in needs of software developers. Questions are, for example, What less time compared to the standalone use of CI-tools. has changed between two builds [and] who has changed it? [2]. The remainder of this paper is structured as follows: We Typically the way to answer these kind of questions require discuss related work in Section II. In Section III we briefly two steps. First, a developer needs to know the dates of the introduce the SQA-Mashup approach. The experimental design
Abstract—Continuous Integration (CI) has become an established best practice of modern software development. Its philosophy of regularly integrating the changes of individual developers with the mainline code base saves the entire development team from descending into Integration Hell, a term coined in the field of extreme programming. In practice CI is supported by automated tools to cope with this repeated integration of source code through automated builds, testing, and deployments. Currently available products, for example, Jenkins-CI, SonarQube or GitHub, allow for the implementation of a seamless CI-process. One of the main problems, however, is that relevant information about the quality and health of a software system is both scattered across those tools and across multiple views. We address this challenging problem by raising awareness of quality aspects and tailor this information to particular stakeholders, such as developers or testers. For that we present a quality awareness framework and platform called SQA-Mashup. It makes use of the service-based mashup paradigm and integrates information from the entire CI-toolchain in a single service. To evaluate its usefulness we conducted a user study. It showed that SQA-Mashup’s single point of access allows to answer questions regarding the state of a system more quickly and accurately than standalone CI-tools.
c 2014 IEEE /14/$31.00
109
CSMR-WCRE 2014, Antwerp, Belgium
of our user study is described in Section IV. In Section V we provide the results of the evaluation, and we discuss our findings in Section VI. II. R ELATED W ORK The goal of our approach is to support the answering of common questions in the context of software evolution and continuous integration. We follow insights of prior research analyzing the information needs of developers to ensure that our set of questions is relevant and useful. We divide the field of the related work into the following areas: software evolution in general, information needs, and continuous integration. Software evolution: Mens et al. [4] list a number of challenges in software evolution. One approach to reason about the evolution of software systems is the integration of data from a wide variety of sources. The Moose project [5] is a platform, which addresses the integration of data from different of data sources, such as source code repositories or issue trackers. FM3 is the meta-model used in Moose, which builds the base for an automatic evolution analysis. Another approach based on Semantic Web technologies was proposed by Li and Zhang [6]. Our approach tackles the integration differently since we do not use a meta-model, such as Moose, to analyze the evolution of a software system. Instead, we integrate data with what is already computed by state-of-the-art CI-tools. Information needs: Aranda and Venolia [7] investigated source code histories in repositories to identify common bug fixing patterns. Breu et al. [8] extracted a catalog of questions from bug reports. They found that many questions are not explicitly stated in issues and therefore often not answered. Other studies conclude with an explicit catalog of questions asked by a group of stakeholders. LaToza and Myers [9] came up with a list of Hard-to-answer questions about code. Fritz and Murphy [2] provide a collection of developer’s questions in combination with an information fragment model to answer these questions. Another group of studies examined the tasks of professionals during software comprehension. Roehm et al. [10] showed that developers follow different strategies to complete their work. M¨uller and Fritz [11] shifted the focus from software testers and developers to a more diverse audience such as requirements engineers and product line managers. They found that these stakeholders require multiple different artifacts to perform their daily activities. Their findings extend existing studies [2], [9] performed with software developers. Continuous integration: Staff and Ernst reported on a controlled human experiment to evaluate the impact of continuous testing onto the source code quality [12]. The results of their experiment showed an improvement caused by the immediate feedback from the continuous testing framework. Their approach was implemented as plugins for Eclipse and Emacs. A similar experiment was conducted by Hurdugaci and Zaidman [13]. They implemented a plugin for Visual Studio, which helps developers to identify the unit tests that need to be altered and executed after a code change [13]. Both experiments showed that an immediate feedback from CItools fosters software quality during software development and
maintenance. We base upon these results and aim at mashing up the proper information for the respective stakeholder. III. M ASHING -U P S OFTWARE Q UALITY DATA The goal of our approach is to integrate the information scattered across the CI-tooling landscape into a single Webbased service and to present it according to the information needs of different stakeholders. Our approach aims for a fast and easy way to analyze and communicate the state, health, and recent changes of a system. In the following, we discuss our approach of data integration and presentation. We discuss tool requirements and list associated literature. We then present our mashup-based data integration approach that is inspired by Yahoo pipes.1 Finally, SQA-Mashup, a proof-of-concept implementation of the approach is illustrated, followed by a description of its flexible Web-service API and role-based user interface. A. Data Integration and Presentation Approach The aim of our approach is the integration of CI-data from various CI-tools and the presentation of this data according to the information needs of stakeholders. In modern CI-tools, the initial access to the data is facilitated by means of Web-Service interfaces. The challenge lies in the integration and interlinking of the data across the various data sources. The findings of Wasserman [14] about integration issues in computer-aided software engineering, such as the absence of standards for tool integration, are also applicable for CI-tools. We address this challenge with a mashup-based approach, which enables a flexible way of selecting specific data from multiple data sources and to integrate it into one consistent information space. The mashup allows for a pipe-and-filter based processing of the integration steps. Every integration pipe in the SQA-Mashup service back-end is described as a series of pipe-and-filter steps (see Section III-C). The execution of such a pipe is triggered by a Web-service call. Our approach builds on a service back-end, which integrates the data for a dynamic user interface composition based on information needs. We leverage this flexibility for a presentation which allows for a dynamic arrangement of aggregated CI-data. Every integration pipe of the SQA-Mashup service back-end can be visualized through a widget in the front-end. A widget in our context is a graphical representation of an integration pipe. A strict separation of concerns enables the visualization of one pipe output with different widgets, such as a list, a chart or a tree-map. We pushed this flexibility even further and enabled the creation of views. A view is an individual arrangement of widgets according to the needs of a stakeholder group or of an individual stakeholder. In the current implementation, we offer a view for developers and a view for testers. These two views differ in the kind and the granularity of the presented information. For example, the pipe with data about the unit tests is presented in the developer view as a chart of passed
110
1 http://pipes.yahoo.com/pipes/
and failed test cases but in the tester view the same pipe is presented as a list with more detailed information.
and personal preferences are not supported by CI-tools such as SonarQube. It is possible to address this issue with plugins, for example, to achieve a simple rearrangement of widgets B. Tool Requirements for a personalized view. The capability to combine widgets We surveyed the literature for tool requirements and infor- from multiple views within one view is often restricted by the mation needs of stakeholders during their work on source code. underlying architecture of a CI-tool. For example, a tool has one The work of Mockus et al. [15] and LaToza et al. [9] was view on development-related data and a second view on testingchosen as starting point for our further literature survey. We related data. The ability of a CI-tool to handle combined views investigated related work and looked for explicitly-stated and is stated in tool requirement R2. A similar tool requirement, implicitly-stated tool requirements. but yet on another level is stated through tool requirement Table I lists requirements for the integration platform R5. The dynamic level added through tool requirement R5 presented in this paper. The column kind indicates if a tool allows for interactive views based on a stakeholder’s role. An requirement is explicitly (E) stated in literature or derived (D). interactive visualization adopts the view of a stakeholder based We categorized each tool requirement based on the context in on latest changes in the data of a CI-toolchain and with respect which it was stated in the literature: change awareness (CA) to the affected stakeholder’s role. and tool-design-related requirements, such as user interface Agile development processes do iterations within the devel(UI) and architectural design (AD). opment and maintenance phase compared to other software development processes. More iterations within the same amount TABLE I of time require the ability to respond faster to changes T OOL REQUIREMENTS happening during an iteration. Particular CI-tools support ID Tool requirement Kind Cat Ref agile software development but each single tool restricts the R1 Be able to locate quality hot-spots in D CA [9] data presentation to its own data. Within each iteration a source code (e.g. low test coverage, high complexity) stakeholder has to navigate through every tool to become R2 Permit dynamic arrangement of informaD UI [2] aware of changes since the last build. Tool requirement R4 tion shown in the user interface. Provide awareness of the activities of R3 D CA [7] addresses the awareness of changes within each build. A similar peers (co-workers). direction is stated by tool requirement R3. The difference R4 Be able to discover immediately where E CA [15] changes occurred, when they were made, between information need R3 and R4 is the point of view; and who made them. R3 addresses the awareness between co-workers, whereas R4 R5 Provide an interactive visualization of E UI [15] a person’s role (e.g., developer, tester, addresses the awareness of changes within a certain period manager). (for example, an iteration). R1 has a special focus on software E AD [3] R6 Be able to interoperate with other softquality measurements. Similar to R4, the aim of R1 is to ware engineering tools. R7 Permit the independent development of E AD [3] become aware of changes. user interfaces (clients).
The entries in Table I show that more recent literature has a strong focus on change awareness, whereas, traditionally the focus has been on architectural design and user interfaces. The reason for this can be found in recent technological innovations, from which service-based architectures emerged over the last decade. Nowadays, many CI-platforms offer Web-service based interface to exchange data with other systems. Tool requirement R6 reflects this functionality and requests for interoperability rather than a simple data exchange over pre-defined interfaces. Interoperability has to guarantee that exchanged data can be processed in each of the associated systems. Current CI-tools exhibit limited interoperability, because their service interfaces are a collection of flat data optimized for the associated user interface. A tight integration between service interface and user interface is contradictory to tool requirement R7. The Webservice interface of Jenkins-CI is an example for a Web-service optimized for the default front-end. Independent development of a user interface is possible if the data layer is designed in a generic way or offers configurable services. Our definition of configurable services is described in Section III-D. A dynamic arrangement of UI-elements in state-of-the-art tools is possible but often restricted to one configuration per project. Personalized views according to a stakeholder role
C. Web-Service Integration We use a mashup-based solution to collect and aggregate data from different CI-tools. Our mashup solution called SQAMashup consists of three data processing steps: • Fetch: Expects a URI of a Web-service and returns the response document of the Web-service call. • Merge: Expects two documents as input parameter and returns one document containing the data of both input documents. • Select: Expects a document and one or more XPath expression(s) as input parameters. The outcome is one or more nodes of the document selected by one or more expression(s). The advantage of such a mashup-based solution is the ability to combine each single step to a chain of processing steps. This allows for a dynamic and automatic processing of data from multiple data sources. We use Representational State Transfer (RESTful) Webservices in combination with the JavaScript Object Notation (JSON) for the data collection, aggregation, processing, and propagation. JSON is a text-based data-exchange format with a low processing overhead and, in combination with RESTful Web-services, a de-facto standard in CI-tools.
111
Client GUI create or list interfaces modify interface (1) (1a)
CI-data (2)
configuration channel
data transfer channel Service
Server
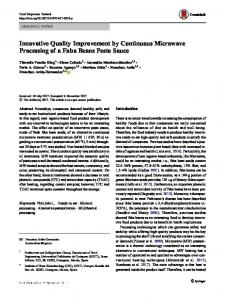
Fig. 1. Dynamic Web-service definition trough channels
The simplicity of JSON has two drawbacks, which affect the processing of our mashup-based implementation: there is no standardized query language and no context information, such as schemas or namspaces known from XML. Therefore, its not possible to automatically associate a JSON document to the context of a CI-tool, such as the build tool or testing tool context. We overcome the missing context by automatically deriving the context from the uniform resource identifier (URI) of a service call. We automatically add a key-value pair to each JSON document with the context information right after it is received from the Web-service of a CI-tool. The missing schema and namespace definition within a JSON document also affects the possibilities to query information. For example, a key can occur multiple times in different positions within one document. We used JXPath2 in combination with Jackson3 and XPath to query for a key based on the surrounding structure in the JSON document. For example, we query for a key metric-value which has a sibling key called metric-name with the value loc. The result of this example query would be the value of the lines of code metric out of a document from the SonarQube Web-service. D. Web-Service Presentation The Web-service interface design plays an important role for satisfying tool requirement R7. The design of a Web-service interface aims for a clear separation of concerns and avoidance of redundant values in response data. This is different to a user interface that provides redundant data to allow a stakeholder to easily discover dependencies between data from different CI-tools based on the tool requirements R1-R4. We overcome the divergence between the Web-service interface description and the visual representation with a clientserver architecture and a twofold design of the Web-service interface (Figure 1). The twofold Web-service design consists out of a configuration channel and a data transfer channel for the communication between the service and a client. The data transfer channel contains Web-services for the actual transfer of data from CI-tools to a client application, such as a graphical user interface (GUI). Each Web-service in 2 http://commons.apache.org/proper/commons-jxpath/ 3 http://jackson.codehaus.org/
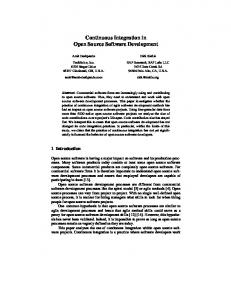
the data transfer channel can be dynamically created, modified, or deleted during runtime. The logic to manage the data transfer channel is encapsulated in Web-services, which are part of the configuration channel. All Web-services used in the configuration channel are hard-coded and cannot be modified during runtime. The Web-services of the configuration channel represent an API which is the starting point for a client application. Every client application with access to this API is able to consume, adopt, and extend the data transfer channel. The twofold Web-service design enables an encapsulation of the complete integration logic and computation efforts into one place. This is especially interesting for concerns on change awareness such as tool requirements R2 and R4. An example is an application which visualizes the evolution of a software project based on data from CI-tools. Depending on a software project’s history the amount of evolution data can be enormous. For such a large amount of data our approach enables a visualization client to query meta data, which can be used to limit the actual query size. Smaller response values which accord to the needed data format save computation power on the client device. The saved computation power can be used for enhancements such as richer or faster visualization. E. Visual Representation The visual representation presents the integrated data to a stakeholder according to tool requirement R5. Figure 2 depicts the Developer View and Tester View of the SQAMashup front-end. Both views have a similar appearance but present information for different stakeholders. For example, the second widget in the second row in Figure 2 visualizes the relative size of each source code package and the status of a quality measurement, such as rule compliance. The background color of each source code package depends on a pre-defined thresholds of a certain quality measurement. For example, a rule compliance above 90% leads to a green background color. In case of the Developer View the background color indicates the rule compliance of each source code package according to, for example, the Java Code Conventions. The same widget is on the Tester View but the background color indicates the test coverage instead of rule compliance. IV. C ONTROLLED U SER S TUDY We designed and conducted a controlled user study with 16 participants who had to solve nine software maintenance tasks. The participants were randomly assigned to either the control group or the experimental group. Each group consisted out of eight subjects and the control group confined the baseline of our study. This group had to use state-of-the-art CI-tools and a social coding platform: Jenkins-CI and SonarQube as the CI-tools and GitHub as the social coding platform. The experimental group had to use SQA-Mashup, which was implemented according to the tool requirements listed in Table I. More information about the study population is provided in Section IV-B and the nine tasks are listed in Table III. We formulated three hypotheses (see Table II) and verified them through statistical tests based on the results of the user
112
Fig. 2. SQA-Mashup - The screenshots illustrate the similar appearance of the Developer View (left) and Tester View (right).
study. The hypotheses address the total values of the score, the time, and the system usability score. The total score and time are summed up over all tasks per participant. TABLE II H YPOTHESES ID H10 H20 H30
Null Hypothesis There is no difference in the total score per subjects between the experimental and the control group. There is no difference in the total time per subjects between the experimental and the control group. There is no difference in the total system usability score between the experimental and the control group.
A. Tasks - Nine Questions from the Literature We exclusively selected tasks out of the software maintenance and evolution field which have been used in other studies or information need questions stated in literature. This is to ensure an objective comparison of our SQA-Mashup approach and the baseline approach with CI-tools. We composed nine tasks which can be categorized along the domains Program Comprehension, Testing, and Cross-Domain questions. The tasks originate from the work of Aranda et al. [7], Fritz and Murphy [2], LaToza and Myers [9], Mockus et al. [16], and Wettel et al. [17]. Our aim was to preserve each task in its original structure and semantics. We applied a two-step procedure to achieve this aim. The first step was to replace all general expressions in a task with a specific entity of the software maintenance and evolution domain. For example, the question ”Is this tested?” was refined to ”Is Classa tested?”. In a second step we replaced placeholders such as Classa with entities from the software project used for the user study, in our case the JUnit project. We provide a short statement for each task to outline the reason why we selected it. Table III lists the nine tasks with a short statement, categorized by their nature, and with references to the literature. B. Study Setting
general and minimum three years development experience with Java. 14 participants were advanced graduate students. 11 out of these 14 graduate students worked part-time in industry. The remaining two participants were one post-doctoral researcher and one PhD student. The youngest participant is 22 years and the oldest 49 years old. The median age of the participants was 27.9 years. To avoid bias, the students were recruited from courses, which were held by people other than the main authors. The control group and the experimental group consist out of eight participants each. Every subject was randomly assigned to either one of both. Our SQA-Mashup approach allows for an integration of data originate from a CI-toolchain. The tools used in a CI-chain can vary between software projects. Nevertheless, we had to select CI-tools for the baseline of our study. We decided to stay with two major open source developer communities and selected the CI-tools used in the Eclipse and Apache community. The Apache Software Foundation (ASF) provides Jenkins-CI and GitHub repositories for all projects under the ASF Development Process. SonarQube provides an instance4 which regularly performs quality analysis of Apache projects. The Eclipse Foundation provides Hudson-CI and GitHub repositories for all projects under the Eclipse Development Process. Therefore, we decided to use Jenkins-CI, GitHub, and SonarQube as baseline CI-tools in the control group of our study. Hudson-CI and Jenkins-CI are similar in their usage as they are forks of the same codebase. The experimental group of our study had to use the SQA-Mashup front-end. The input data was gained from the same CI-tools instances used by the control group. Each participant of our study had to solve nine tasks (Section IV-A) in the context of the JUnit project hosted on GitHub. JUnit [18] is a popular unit testing framework for source code written in Java. The project is under active development since a decade. The JUnit project team uses the built-in issue tracker of GitHub to manage bugs and feature requests. At the time of our study the JUnit project on GitHub had in total 1650 revisions, about 30k lines of code, 54 contributors, and 736 issues. We decided to select the JUnit project because of the mature stage
We ran the user study with 16 participants (S1-16). Each subject had at least five years of development experience in
113
4 http://nemo.sonarqube.org/
TABLE III TASKS ID Task Program Comprehension Domain T1 Description. How big is the source code of Projecta ? Statement. Values such as lines of code, number of classes, and number of packages allow a first approximation of the project size and structure. T2 Description. The three classes with the highest method complexity in Projecta ? Statement. The refactoring of complex parts of source code leads to a better maintainability of software. T3 Description. What is the evolution of the source code in Projecta ? Statement. To understand a software, it is important to know about the evolution. One way to describe the evolution of a software is to look at testing coverage and coding violations over time. Testing Domain T4 Description. Is Classa tested? Statement. Untested parts of source code does potentially increase the risk of bugs. T5 Description. Which part of the code in Projecta takes most of the execution time? Statement. The performance of a system can be influenced by a single piece of code. The execution time of unit test can be used to find such pieces with a weak performance. T6 Description. Three packages with a test coverage lower than the overall test coverage in Projecta ? Statement. ”Code coverage is a sensible and practical measure of test effectiveness.” [16] Cross-Domain T7 Description. Between which builds changed the status of Issuea ? Statement. The status changes of an issue can be used to track recurring bugs with each build. T8 Description. What have my coworkers been doing between Datea and Dateb ? Statement. Quickly assessing the current status in a software project can support context switches between multiple projects. T9 Description. What has changed between Buildc and Buildd ? Who has changed it? Statement. Finding changes which introduced a bug but still let the source code compile can cause substantial effort.
Ref [9] [17] [2]
[9] [9] [16]
[7] [2] [2]
of the project. At the time of our study the commits indicated a standard Web-browser such as Mozilla Firefox or Google that most of the source code changes address bugs or refactoring Chrome. The subjects of the experimental group started at tasks. Only a small set of commits introduced new features. the project page of JUnit in the SQA-Mashup front-end. We think it is therefore a good example for a software project Participants of the control group started with three Web-browser which is in its maintenance phase. windows. One window for Jenkins-CI, one for SonarQube, and The maximum time to work through all tasks of our study one for the project page on GitHub. was 45 minutes with maximum of five minutes per task. After five minutes a participant had to stop to work and to go on with the next question. The execution of one study in total lasts approximate 40-60 minutes as there was no time restriction on the introduction and the feedback section. C. Usability We were interested of what the participants of our study think about the usability of the CI-tools they used to solve the tasks. We decided to use the popular System Usability Scale (SUS) by Brooke [19]. The SUS is a simple and easy understandable scheme which consists out of ten questions each rated on a scale from ”Strongly Agree” to ”Strongly Disagree.” The subjects of the control group were asked to give a cumulative feedback for all CI-tools they used during the study and the experimental group rated SQA-Mashup. As part of our user study each participant was asked to rate the Difficulty of each task right after solving it. We used a scale from ”Very difficult” to ”Very easy” in which a participant provides a personal opinion. This additional information should allow us to sharpen our understanding of the usability rating. D. Performing the Study We performed the user study in four sessions in the lab of our research group in Zurich. The setup for the experimental group was a computer with Windows 8 and the SQA-Mashup front-end installed on it. The setup for the control group was
Fig. 3. Self-assessment - (C)ontrol group and (E)xperimental group
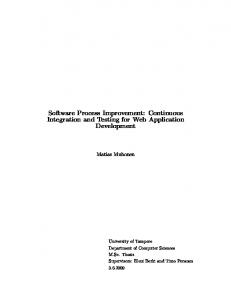
At the beginning of every session we explained the structure of the study in addition to the written explanation on the questionnaire. The participants solved the tasks independently and the time restriction was enforced with individual stopwatches. We asked the participants of the user study to do a self-assessment of their Programming skills as-well-as their working experience with the CI-tools used in the study. Figure 3 depicts the self-assessment results of the control group and the experimental group. Only one participant had no working experience with any of the used platforms such as GitHub,
114
2000 1600
Total Time
800
1200
24 20
Total Score
16
C
E
C
(C)ontrol and (E)xperimental Group
E
(C)ontrol and (E)xperimental Group
Fig. 5. Total Time
100
Fig. 4. Total Score
80 60
SUS Score
40 20
Ratio Total Score/Total Time
The answers of the study participants were manually preprocessed for an analysis of the data with R [20]. The questionnaire of the user study consists of single choice questions, open questions, and rating scales for usability related questions. Every answer of the questionnaire was mapped to a numeric representation to run a statistical analysis on it. We used the following rules for the mapping: • Rating scales: The index of the selected entry is the numerical representation, starting with zero for the first entry. • Single choice and open questions: A grading scheme based on points with 3 points for a correct answer, 2 points for a partly correct answer (for open questions only), 1 point for a wrong answer, and 0 points for no answer. We graded an answer of an open question as partly correct if it was correct but incomplete. For example, if the correct answer consists of two artifacts but only one was found by a participant. In case of an open question with only one correct answer the grading is the same as for single choice questions.
12
E. Data Collection
0.5 1.0 1.5 2.0 2.5 3.0
Jenkins, and SonarQube. All others had experience with at least two out of these three platforms. The self-assessment results of the experimental group and control group were statistically not significantly different.
C
E
(C)ontrol and (E)xperimental Group
Fig. 6. Ratio Total Score/Time
C
E
(C)ontrol and (E)xperimental Group
Fig. 7. SUS Score
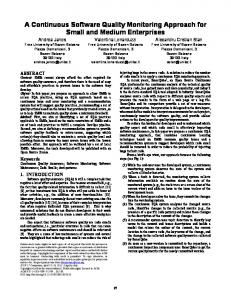
The box-plot of the total score per subject (see Figure 4) of the experimental group shows that the 0.75 quantile and the median are close and almost the same as the upper whisker of the plot. This indicates a skewed distribution. Furthermore, Q-Q plots and Shapiro-Wilk tests showed significant evidence V. E MPIRICAL R ESULTS In this section we statistically examine the results of the against normality in the data. We made similar observations user study with respect to the hypotheses as listed in Table II. regarding the other quantities (see Figures 4-7) although the In Section V-A we analyze H10 and H20 using the aggregate departures are less. Since our group sample sizes are below the results: total score per subject, total time per subject, and the commonly accepted rule of thumb (at minimum 30 to 40) we ratio of total score to total time per subject aggregated over all chose a non-parametric, independent-two-samples procedure, nine tasks. In Section V-B we analogously analyze H10 and i.e., Mann-Whitney-Wilcoxon (MWW), to test all hypotheses. H20 on the level of each individual task. The results of the Loosely speaking, MWW determines if the values in the experimental group are (significantly) different by comparing SUS and the difficulty ratings are discussed in Section V-C. the mean ranks of the values in both groups. If both groups A. Analysis & Overview of Aggregated Results come from identical distribution they have equal chances for Total Score: Table IV lists the total score per subject high and low ranks, and there is no difference in their mean aggregated over all tasks for both, the experimental and control ranks. Note, that the actual test itself is based on the U statistic group. Each of the nine tasks was graded with 3 points if [21]. The box-plots further reveal that distributions of the values solved correctly (see Section IV-E), so the maximum score a between the experimental and the control group might exhibit participant could achieve was 27. The median of the total scores dissimilar shapes. In this case, MWW is interpreted as a test was 20.0 points in the control group and 25.5 points in the of stochastic equality [21] rather than a test of medians. Under the above considerations H10 (see Table II) states that experimental group. In other words, this median difference of 5.5 points means that the experimental group outperformed the the mean ranks of total score per subject of the two groups are control group on average by 20.4% (=5.5/27) when referring equal. A two-sided MWW test resulted in a p-value of 0.038 to the total score per subject. The minimum total score per and 0.95 (non-parametric) confidence interval bounds of [1, 7]. subject was 18 points (S12) and 17 points (S4), the maximum This gives us significant evidence against H10 : The total scores was 24 points (S10) and 26 points (S1-3,14) in the control and per subject in the experimental group (mean rank = 11) are the experimental group, respectively. None of the participants significantly different than for the control group (mean rank solved all tasks correctly. One outlier (S12) with 12 points in = 6.0). In other words, based on the p-value and direction of the control group solved only four tasks - but those correctly. the difference (as indicated by the interval bounds) we find We could not observe any particularly obvious reasons, such significant evidence that the subjects of the experimental group as technical difficulties, tool failure, or misunderstandings of score higher. the tasks, for this comparably low score and hence did not Total Time: Table IV lists the total time per subject exclude subject S12 from our analysis. aggregated over all tasks for both, the experimental and control
115
group. The median of the total time was 30.7 minutes in the Correctness in our context is defined as the score achieved control group and 17.5 minutes in the experimental group. This by a participant: A higher score means a higher correctness. median difference of 13.2 minutes means that the experimental The goal of this section is to further investigate where the group outperformed the control group on average by 29.3% advancements come from, and we break down the analysis of (=13.2/45) when referring to the total time per subject. The the global hypotheses H1 and H2 into individual tasks. maximum total time per subject was 35 minutes (S11, S12), Due to the same reasons as on the aggregate level (nonthe minimum was 14 minutes (S14) and 14.2 minutes (S1) in normality and sample size below 30) the analyses on each task the control and the experimental group, respectively. However, were performed with the MWW procedure. However, because none of the participants reached the time limit of 45 minutes. of their post-hoc character we applied the Bonferroni-Holm H20 (see Table II) states that the mean ranks of total time [22] correction to the resulting p-values of the MWW tests on per subject of the two groups are equal. A two-sided MWW task level. This correction counteracts the problem of multiple test resulted in a p-value of 0.003 and (non-parametric) 0.95 hypotheses testing by controlling the family-wise error rate. confidence interval bounds of [-977, -308]. This gives us TABLE V significant evidence against H20 : The total time per subjects R ESULTS PER TASK in the experimental group (mean rank = 5.12) is significantly Score (median) Time (median) different than for the control group (mean rank = 11.88). Based Control Experim. ∆ Control Experim. ∆ Task on these results we find strong evidence that the subjects of T1 3.0 3.0 0.0 67.5 40.0 27.5 T2 3.0 3.0 0.0 112.0 67.5 44.5 the experimental group could solve the tasks in less time. T3 1.0 2.0 1.0 285.0 225.0 60.0 Ratio of Total Score to Total Time: Table IV lists the total 3.0 3.0 0.0 130.0 53.5 76.5 T4 score to total time ratio (st-ratio) per subject aggregated over all T5 1.0 3.0 2.0 240.0 50.0 190.0 T6 3.0 3.0 0.0 125.0 79.0 46.0 tasks for both, the experimental and control group. This value T7 0.5 2.0 1.5 300.0 300.0 0.0 was multiplied by 100 to aid readability. The median of the stT8 3.0 3.0 0.0 300.0 175.0 125.0 ratio was 1.09 in the control group and 2.26 in the experimental 3.0 3.0 0.0 300.0 150.0 150.0 T9 group. In other words, this median difference of 1.17 means 1) Task T1 - Learning about project size: All participants that the experimental group outperformed the control group by in both groups were able to find this information and solved about plus 0.7 points (1.17/100*60) per minute. the task correctly. Moreover, a large adjusted p-value, such A two-sided MWW test resulted in a p-value of 0.005, (nonas p>0.2, clearly indicates that the observed time difference parametric) 0.95 confidence interval bounds of [0.363, 1.798], between the two groups is not significant. and mean ranks of 11.75 and 5.25, for the experimental and Information about the project size is readily available in a control group. particular view of the CI-toolchain. Hence not surprisingly, TABLE IV all participants of control group were able to write down R ESULTS PER S UBJECT - MEDIAN AND STANDARD DEVIATION (SD) the correct answer. We hypothesize that the single point of Subject Group Total Score Total Time Score/Time * 100 access for all information as provided by SQA-Mashup allows S1 E 26 853.0 3.05 to spot the project size immediately and might offered the S2 E 26 984.0 2.64 experimental group a head start. However, currently the results S3 E 26 1789.0 1.45 S4 E 17 1620.0 1.05 are not statistically conclusive and further work is needed on S5 C 22 1760.0 1.25 that issue, for instance, including additional participants. S6 C 23 1730.0 1.33 2) Task T2 - Finding exceptionally complex source code: S7 C 19 1927.0 0.99 S8 E 25 980.0 2.55 Every participant of both groups solved the task correctly. S9 E 22 1300.0 1.69 With respect to time a large adjusted p-value, such as p>0.2, S10 C 24 1415.0 1.70 shows that the measured time difference between both group is S11 C 18 2097.0 0.86 S12 C 12 2100.0 0.57 not significant. Again, analyzing additional subjects increases S13 E 22 1120.0 1.96 power of the test and would give more confident estimates S14 E 26 841.0 3.09 and insights whether the observed times differences of such S15 C 20 1740.0 1.15 S16 C 20 1940.0 1.03 magnitudes in this task are due to chance. median C 20.0 1843.5 1.09 3) Task T3 - Leaning about quality evolution: This task was median E 25.5 1052.0 2.26 solved with a significantly higher correctness (adjusted p-value SD C 3.73 226.88 0.36 SD E 3.24 355.06 0.76 of 0.025) by the experimental group but not necessarily faster (large adjusted p-value of p>0.2). Task T3 captures an essential activity of CI, rigorously B. Task Analysis monitoring the state and quality of a software system over The aggregated results in the previous Section V-A show a time [23]. However, to facilitate a comprehensive view of significance evidence that the subjects using our SQA-Mashup the state of the system, different quality indicators, such as approach tend to solve the tasks more correctly in less time test coverage, code metrics, test failures, or coding violations, compared to subjects using the given set of baseline tools. must be considered. The subjects of the control group had
116
to manually search through the individual CI-tools to locate this information. Furthermore, they faced the difficulty that each tool uses different time periods and scales to calculate and visualize information. We generally noticed that only two subjects in the control group provided a partially correct answer, the remaining six subjects answered the task wrong. We interpret the results that a consistently integrated interface can foster project visibility and helps to encourage team awareness with respect to different software quality aspects. 4) Task T4 - Learning about test coverage: 14 participants solved the task correctly. Only one participant out of each group gave a wrong answer. With respect to time a large adjusted p-value, such as p>0.2, shows that there is no significant difference between the two groups. 5) Task T5 - Finding high execution times: This task was Fig. 8. Difficulty Rating - (C)ontrol group and (E)xperimental group solved with a significantly higher correctness (adjusted p-value The result of a SUS is a score between 0 and 100 to represent of 0.040) by the experimental group. We found a certain evidence (adjusted p-value of 0.073) that less time was needed. the usability of a system. In our paper the score was calculated While the experimental group likely benefited from the based on the original scoring scheme of Brooke [19] as follows: integrated view the subjects of the control group might The contribution of every item with an odd index equals the have struggled with the fact that multiple CI-tools provide score minus one, the contribution of every item with an even index is calculated as five minus the score. Finally, the sum of redundantly the same information about execution times. 6) Task T6 - Finding test coverage below average: Only one the resulting contributions is multiplied by 2.5. Figure 7 depicts participant was not able to solve the task correctly. Moreover, a box-plot based on the SUS scores of the control and the with respect to time a large adjusted p-value, such as p>0.2, experimental group. The usability median of the control group is 41.25 compared to 82.5 of the experimental group. Note, it is shows that the measured difference is not significant. 7) Task T7 - Relating build information to issues: This task by chance that the usability measured in the experimental group was solved correctly by only two subjects of the control group is exactly twice of the control group’s usability. The minimum and four subjects of the experimental group. Generally, this whisker of the experimental group with 52.5 is slightly above task seemed time-consuming and difficult since 75% of all the 0.75 quantile of the control group with a usability of 48.75. H30 (see Table II) states that the mean ranks of the usability participants reached the time limit of five minutes and over scores per subject of the both groups are equal. A two-sided 50% rated it as ”Very Difficult” (see Figure 8). MWW test resulted in a p-value of 0.004 and 0.95 confidence 8) Task T8 - Learn about activities of coworkers: This interval bounds of [15, 55]. This gives us significant evidence task was solved significantly faster (adjusted p-value of 0.050) against H3 by the experimental group but not necessarily with higher 0 : The usability score per subject in the experimental group (mean rank = 11.94) is significantly different from the correctness (large adjusted p-value). score per subject in the control group (mean rank = 5.06). The participants of the control group mentioned in their Based these findings there is strong evidence that the subjects of written feedback that they had difficulties in finding a specific the experimental group perceived the integrated SQA-Mashup view corresponding to the time period which we asked for front-end more ”user friendly”. in the user study. SQA-Mashup, on the other hand, offers a Next, we describe differences in the individual task ratings coherent, chronological view of developers and their activities. regarding Difficulty between the control group and experimental 9) Task T9 - Learn about activities between builds: This group (see Figure 8). Two-sided MWW tests on each individual task was solved significantly faster (adjusted p-value of 0.033) by the experimental group but not necessarily with higher task rating resulted in large p-values. Noticeable differences are the ratings of the control group on task T2, T3, T5, and T6. correctness (large adjusted p-value). Task 9 is similar to task T8 from the perspective of builds. In all cases the control group rated the three tasks as ”Very We expected a decrease in time to solve the task for both difficult” in difference to the experimental group. groups compared to task T8 because of learning effects and since builds are the central aspect of CI-tools. Only the median D. Discussion of the Results Overall we found evidence that the participants of the time of the experimental group decreased to 150 seconds, the median time of the control group remained high at 300 seconds. experimental group solved the tasks of our study in less time and with a higher correctness. The SQA-Mashup approach was The scores increased in both groups. rated as more ”user friendly” than the given baseline tools C. Participant Ratings reflected by a significantly higher SUS score. We asked each participant to complete the SUS questionnaire When analyzing these differences on the level of the and to rate the Difficulty of each task (Figure 8). individual tasks we found major insights in the benefits of
117
monitoring the CI-process and the capabilities of existing CI- in the visualizations. We currently work on a timeline-based tools. On the one hand, regarding single aspects of software user interface to facilitate software evolution monitoring. quality, such project size (T1) or code complexity (T2), existing ACKNOWLEDGMENT CI-tools provide already good support. The participants of both We gratefully acknowledge the financial support from the groups achieved a high correctness, and we could not observe Swiss National Science Foundation for our project ”SoSYA a significant time gain in either of the two groups. Systems of Systems Analysis” (Project No. 200021 132175). On the other hand, we found evidence that monitoring We are also grateful to our students Jens Birchler, Stefan software quality during CI can substantially benefit from an Hiltebrand, and Hannes Tresch who implemented the first integrated view. This is particularly the case when the required prototype of our SQA-Mashup tool. information is scattered over multiple CI-tools and displayed in different scales and units, for instance, as it is the case R EFERENCES for tasks T3 or T8. The subjects of the control group had [1] M. Fowler, “Continuous integration,” 2006. [Online]. Available: http://www.martinfowler.com/articles/continuousIntegration.html to search the CI-toolchain and then manually combine the [2] T. Fritz and G. C. Murphy, “Using information fragments to answer the information obtained from the individual tools. This seems to questions developers ask,” ser. ICSE, Cape Town, 2010, pp. 175–184. be a disadvantage compared to the experimental group that was [3] J. Singer, T. Lethbridge, N. Vinson, and N. Anquetil, “An examination of software engineering work practices,” ser. CASCON, Toronto, 1997, presented a single interface that integrates all relevant quality pp. 21–36. information. Therefore, we see potential for such integrated [4] T. Mens, M. Wermelinger, S. Ducasse, S. Demeyer, R. Hirschfeld, and approaches when multiple facts need to be merged to answer M. Jazayeri, “Challenges in software evolution,” ser. IWPSE, Lisbon, 2005, pp. 13–22. an aggregated quality aspect of a software system. E. Threats to Validity Unequal distribution of experience in terms of development experience and experience with the used tools can bias the results of a user study. We addressed this issue by a random assignment of the participants to a group. The analysis of both experiences with the MWW test indicated no significant difference of the two populations. The number of participants might have influenced the drawn conclusion. Many results had a clear tendency but they were not statistically significant. A greater number of participants might help to draw a clear conclusion for those results. Generalizability of the results. This threat is in respect to the participants of our study which were students and not professional developers. We tried to overcome this by selecting students with development experience in industry. The authenticity of the tasks for the daily work of a software developer. The task selection of our user study is only a small extract of tasks which are done during software maintenance. We selected tasks from literature to avoid any favor in the direction of the baseline tools or SQA-mashup. VI. C ONCLUSIONS The chance to descend into Continuous Integration Hell increases with each CI-tool added to a CI-toolchain. We developed SQA-Mashup, which dynamically integrates data from various CI-tools and tailors the information for stakeholders. We deducted information needs and tasks from related works for the design and the evaluation of our proof-of-concept implementation. The integrated SQA-Mashup approach can (1) foster project visibility, (2) encourage team awareness, and (3) help to avoid the spreading of inconsistent information. The results of a user study showed that participants solved tasks with 21.6% higher correctness and 57% faster with SQA-Mashup compared to standalone CI-tools. Next, we will tackle the scattering of information over multiple branches and the challenge of different scales and units
[5] O. Nierstrasz, S. Ducasse, and T. Gˇırba, “The story of moose: an agile reengineering environment,” SIGSOFT Softw. Eng. Notes, vol. 30, no. 5, pp. 1–10, 2005. [6] Y.-F. Li and H. Zhang, “Integrating software engineering data using semantic web technologies,” ser. MSR, Waikiki, 2011, pp. 211–214. [7] J. Aranda and G. Venolia, “The secret life of bugs: Going past the errors and omissions in software repositories,” ser. ICSE, Washington, 2009, pp. 298–308. [8] S. Breu, R. Premraj, J. Sillito, and T. Zimmermann, “Information needs in bug reports: improving cooperation between developers and users,” ser. CSCW, Savannah, 2010, pp. 301–310. [9] T. D. LaToza and B. A. Myers, “Hard-to-answer questions about code,” in Evaluation and Usability of Programming Languages and Tools, ser. PLATEAU, Reno, 2010, pp. 8:1–8:6. [10] T. Roehm, R. Tiarks, R. Koschke, and W. Maalej, “How do professional developers comprehend software?” ser. ICSE, Piscataway, 2012, pp. 255–265. [11] S. C. M¨uller and T. Fritz, “Stakeholders’ information needs for artifacts and their dependencies in a real world context,” ser. ICSM, Eindhoven, 2013. [12] D. Saff and M. D. Ernst, “An experimental evaluation of continuous testing during development,” SIGSOFT Softw. Eng. Notes, vol. 29, no. 4, pp. 76–85, 2004. [13] V. Hurdugaci and A. Zaidman, “Aiding software developers to maintain developer tests,” ser. CSMR, Szeged, 2012, pp. 11–20. [14] A. Wasserman, “Tool integration in software engineering environments,” in Software Engineering Environments, ser. Lecture Notes in Computer Science, 1990, vol. 467, pp. 137–149. [15] A. Mockus and J. D. Herbsleb, “Expertise browser: a quantitative approach to identifying expertise,” ser. ICSE, Orlando, 2002, pp. 503– 512. [16] A. Mockus, N. Nagappan, and T. T. Dinh-Trong, “Test coverage and post-verification defects: A multiple case study,” ser. ESEM, Washington, 2009, pp. 291–301. [17] R. Wettel, M. Lanza, and R. Robbes, “Software systems as cities: a controlled experiment,” ser. ICSE, Waikiki, 2011, pp. 551–560. [18] P. Louridas, “Junit: unit testing and coiling in tandem,” Software, IEEE, vol. 22, no. 4, pp. 12–15, 2005. [19] J. Brooke, “Sus-a quick and dirty usability scale,” Usability evaluation in industry, vol. 189, p. 194, 1996. [20] R Development Core Team, R: A Language and Environment for Statistical Computing, Vienna, 2011. [21] H. Mann and D. Whitney, “On a test of whether one of two random variables is stochastically larger than the other,” Annals of Mathematical Statistics, vol. 18, no. 1, pp. 50–60, 1947. [22] S. Holm, “A simple sequentially rejective multiple test procedure,” Scandinavian Journal of Statistics, vol. 6, no. 2, pp. 65–70, 1979. [23] P. M. Duvall, S. Matyas, and A. Glover, Continuous Integration: Improving Software Quality and Reducing Risk. Addison-Wesley, 2007.
118


![[PDF] Download Continuous Integration: Improving Software Quality ...](https://m.moam.info/img/260x300/pdf-download-continuous-integration-improving-soft_6477d367097c4796708c21a1.jpg)


![Read [PDF] Continuous Integration: Improving Software ... - Google Sites](https://m.moam.info/img/260x300/read-pdf-continuous-integration-improving-software_6477cdcc097c4744708c1e99.jpg)