Supporting Information
An Efficient Halogen-Free Electrolyte for Use in Rechargeable Magnesium Batteries** Oscar Tutusaus, Rana Mohtadi,* Timothy S. Arthur, Fuminori Mizuno, Emily G. Nelson, and Yulia V. Sevryugina anie_201412202_sm_miscellaneous_information.pdf
Contents Page # Experimental Details ...................................................................................................................................S2 NMR spectra ...............................................................................................................................................S6 X-Ray Crystallographic Data ....................................................................................................................S16 Electrochemistry........................................................................................................................................S23 Thermogravimetric Analysis .....................................................................................................................S36 Water compatibility ...................................................................................................................................S39 Supporting References ..............................................................................................................................S40
Experimental Details General Methods All experiments were conducted in an argon filled glovebox, unless otherwise indicated. Acetone, hexane, anhydrous Et2O, magnesium carbonate trihydrate, Dowex 50WX8 50-100 ion exchange resin, and anhydrous magnesium bromide (99.995%) were purchased from Sigma Aldrich and used as received. 4-methoxy-2,2,6,6tetramethylpiperidine-1-oxyl radical (4-MeO-TEMPO) was purchased from TCI and used as received. CsCB11H12 was purchased from Katchem (Czech Republic) and used as received. AgCB11H12 was prepared according to [1]. Neutral alumina (Brockmann I) was purchased from Sigma Aldrich and was dried for 15 h at 250 °C under vacuum before use. Tetrahydrofuran (THF), 1,2-dimethoxyethane (DME) and diglyme (G2) were purchased in anhydrous form from Sigma Aldrich, passed through a column containing 10% (v/v) of dry neutral alumina, distilled from Na metal, and stored over activated 3Å molecular sieves. Triglyme (G3) and tetraglyme (G4) were purchased from Sigma Aldrich, passed through a column containing 10% (v/v) of dry neutral alumina, distilled from Na metal, and stirred in the presence of freshly prepared Mg shavings at 100 °C for 15 h; solvents were stored with Mg shavings and filtered right before use. DMSO-d6 was purchased from Cambridge Isotope Labs and stored over activated 3Å molecular sieves prior to use. NMR analyses were conducted on a Varian MR400 MHz and a Varian vnmrs 700 MHz spectrometers. 1H and 13C NMR spectra were referenced relative to the protic solvent resonance, and 11B spectra are referenced indirectly based on the 1H spectrum.[2] Scanning Electron Microscopy (SEM) was conducted in a Jeol-JSM-7800F Field Emission Scanning Electron Microscopy equipment FE-SEM that is equipped with an EDAX energy dispersive X-ray spectroscopy (EDS) system. Prior to each SEM/EDS analysis, in Ar glove box, the sample was loaded in an air-tight sample holder to prevent any exposure to ambient air during sample transfer. Synthetic Protocols Synthesis of [Mg(H2O)6](CB11H12)2 (2): CsCB11H12 (500 mg, 1.81 mmol) was dissolved in H2O (10 mL) under ambient conditions with gentle heating and the warm solution was passed through a cation exchange resin column (acidic form, 2x7 mL). The resulting solution of the free acid was neutralized with excess MgCO3∙3H2O (250 mg, 2 eq). The suspension was vigorously stirred for 10 minutes and filtered. The filtrate was evaporated to dryness and the white solid was extracted with acetone (2x10 mL). The solvent was concentrated to 5 mL, then H2O (5 mL) was added and the solution was evaporated to dryness. The white solid was added H2O (5 mL), the resulting cloudy suspension was filtered and evaporated to dryness to provide 2 as a white solid. Yield: 355 mg (94%). 1H{11B} NMR (399.54 MHz, [D6]DMSO): 3.37 (s, 6H; H2O), 2.38 (s, 1H; CH), 1.56 (s, 6H; BH), 1.41 (s, 5H; BH); 11B NMR (128.19 MHz, [D6]DMSO): ‒7.0 (d, 1B, 2J(BH)=135 Hz), ‒13.3 (d, 5B, 2J(BH)=135 Hz), ‒ 16.2 (d, 5B, 2J(BH)=150 Hz); 13C{1H}NMR (100.47 MHz, [D6]DMSO): 50.74 (s, CH); Elemental analysis calculated for C2H36B22MgO6: C 5.74, H 8.67. Found: C 6.52, H 8.74. Synthesis of [Mg(THF)6](CB11H12)2 (3): A solution of AgCB11H12 (5.04 g, 20.1 mmol) in THF (12 mL) was added to a stirring solution of anhydrous MgBr2 (1.826 g, 9.92 mmol) in THF (43 mL). The suspension was stirred for 2.5 h and the solid was collected by filtration, washed with THF (2x10 mL) and dried under vacuum. Obtained 10.615 g (96%) of a pale yellow solid composed of a mixture 3:AgBr (1:2). 1H{11B} NMR (399.54 MHz, [D6]DMSO): 3.60 (m, 12H; OCH2), 2.38 (s, 1H; CH), 1.76 (m, 12H; CH2), 1.56 (s, 6H; BH), 1.41 (s, 5H; BH); 11B NMR (128.19 MHz, [D6]DMSO): ‒7.0 (d, 1B, 2J(BH)=133 Hz), ‒13.3 (d, 5B, 2J(BH)=135 Hz), ‒16.2 (d, 5B, 2J(BH)=150 Hz); 13C{1H}NMR (100.47 MHz, [D6]DMSO): 67.01 (s, OCH2), 50.67 (s, CH), 25.12 (s, CH2). S2
Synthesis of [Mg(DME)3](CB11H12)2 (4): Pale yellow solid containing 3:AgBr (1:2) (10.615 g, 9.49 mmol of 3) was added DME (100 mL) in a 250 mL Erlenmeyer flask, and the mixture was stirred while cooled externally with an external acetone/CO2 bath. After 15 minutes, the mixture reached a temperature of ‒15 °C. At that point, the solid was filtered off and washed with cold DME (2x5 mL). Filtrate and washings were combined and stored at room temperature overnight, during which time some crystals precipitated. The mixture was gently heated to 60 °C without stirring for 3 h, and more solid crystallized out. The white crystalline solid was collected by filtration, washed with hot DME (5 mL + 2 mL) and dried under vacuum. Yield: 4.896 g (89%). 1H{11B} NMR (399.54 MHz, [D6]DMSO): 3.42 (s, 6H; CH2), 3.23 (s, 9H; CH3), 2.39 (s, 1H; CH), 1.56 (s, 6H; BH), 1.41 (s, 5H; BH); 11B NMR (128.19 MHz, [D6]DMSO): ‒7.0 (d, 1B, 2J(BH)=133 Hz), ‒13.3 (d, 5B, 2J(BH)=135 Hz), ‒16.2 (d, 5B, 2J(BH)=148 Hz); 13C{1H}NMR (100.47 MHz, [D6]DMSO): 71.09 (s, CH2), 58.07 (s, CH3), 50.76 (s, CH); Elemental analysis calculated for C14H54B22MgO6: C 28.96, H 9.37. Found: C 28.93, H 9.96. While the solid yields X-ray quality crystals of 4, and appears pure by NMR and elemental analysis, further purification is required for electrochemical grade purity. Purification of 4 by “Inverse Recrystallization”: 4 (3.05 g) was suspended in 20 mL of DME at room temperature, and the suspension was cooled down with an external acetone/CO2 bath while stirring. After about 15 minutes, the solid dissolved, even though in some instances small amounts of grey particles remain insoluble. Any insoluble solid was filtered off and the filtrate was immediately heated up to 60 °C. After 45 mins, the suspension was filtered using only gentle suction and filtration was stopped when the solid was still somewhat damp to avoid its redissolution due to cooling. It was then washed with hot DME (8 mL), and transferred while damp to a flask and connected to vacuum until dry. Obtained 2.96 g (97%) of 4 as a white microcrystalline solid. Synthesis of [Mg(G2)2](CB11H12)2∙G2 (5): Pale yellow solid containing 3:AgBr (1:2) (76.6 mg, 68.5 µmol) was extracted with diglyme (3x1 mL). Hexane (3 mL) was added to the combined diglyme extracts to precipitate a white solid, which was collected by filtration, washed with excess hexane and dried under vacuum. Yield: 42.1 mg (86%). 1H{11B} NMR (399.54 MHz, [D6]DMSO): 3.50 (m, 6H; CH2), 3.42 (m, 6H; CH2), 3.24 (s, 9H; CH3), 2.39 (s, 1H; CH), 1.56 (s, 6H; BH), 1.41 (s, 5H; BH); 11B NMR (224.51 MHz, [D6]DMSO): ‒7.0 (d, 1B, 2 J(BH)=131 Hz), ‒13.3 (d, 5B, 2J(BH)=133 Hz), ‒16.2 (d, 5B, 2J(BH)=148 Hz); 13C{1H}NMR (175.97 MHz, [D6]DMSO): 71.28 (s, CH2), 69.57 (s, CH2), 58.05 (s, CH3), 50.70 (s, CH); Elemental analysis calculated for C20H66B22MgO9: C 33.70, H 9.33. Found: C 33.51, H 9.42. Electrochemical Analysis All electrochemical experiments were conducted using a Bio-Logic VMP3 multi-channel potentiostat. A fresh electrolyte solution was prepared for each experiment. Working electrodes were Pt (1.6 mm dia.), Al (2 mm dia.), Ni (3 mm dia.), glassy carbon (GC, 3 mm dia.), and 316-stainless steel (316SS; 2 mm dia.) disks, purchased from BASi and were extensively polished between each use. Unless otherwise stated, counter and reference electrodes were magnesium ribbons. Cyclic voltammetry and linear sweep voltammetry experiments were conducted at a scan rate of 5 mV/sec. Oxidation onset potentials and coulombic efficiencies were determined using previously described methods.[3] Cyclic voltammetry experiments of 4-MeO-TEMPO used ferrocene as an internal reference and were carried out in a modified three electrode set-up with a Pt disk working electrode, a Pt wire counter electrode, and a Ag wire quasi-reference electrode. Conductivity measurements were conducted using a Pt electrode symmetrical cell. The cell constant was obtained by cell calibration using potassium chloride and was used to calculate the conductivity of the electrolyte. The 0.2 M (2:1) PhMgCl:AlCl3/THF (APC) electrolyte and Chevrel phase Mo6S8 cathode were prepared as was described in literature.[4] S3
General procedure for the preparation of 0.75 M magnesium monocarborane (MMC) salt solutions in G3 or G4: to obtain approx. 1 mL of MMC/G3 or MMC/G4 electrolyte solutions, recrystallized 4 (363 mg, 625 µmol) was added G3 or G4 (833 µL) and the mixture was stirred for 10 minutes. The clear solution thus obtained was further stirred under vacuum for 10 minutes to remove all DME. Chronoamperometry experiments Chronoamperometry experiments were conducted using a SB-1A (EC Frontier Inc, Japan) battery evaluation cell with a 316SS disk working electrode (19 mm dia.), a Mg disk counter electrode, and a Mg wire as reference electrode. EPMD gaskets (13 mm dia.) were used to limit the area exposed to electrolyte solution on the working and counter electrodes to 1.33 cm2. In a typical test run, a predetermined constant voltage was applied on the 316SS disk for 48 h. The cell was deconstructed and the 316SS disk was washed first with G4, and then with THF. The 316SS disk was then analyzed by SEM, EDS and laser microscope. When 3.5 V were applied, the electrolyte solution was sampled before and after chronoamperometry experiment to determine Fe, Ni and Cr contents via ICP analysis. Galvanostatic Deposition Galvanostatic deposition of magnesium was conducted using a two electrode cell with a platinum disk working electrode (15 mm dia.) and a magnesium disk counter electrode (15 mm diameter). A constant current corresponding to a potential of ‒0.6 V (vs. Mg) was applied for 40 h, before the cell was deconstructed, and platinum disk was soaked in anhydrous G4, followed by rinsing in anhydrous THF. The deposits on the Pt disk were then analyzed by XRD and SEM to verify the deposition of magnesium. Powder X-ray Diffraction X-ray diffraction was conducted in Rigaku SmartLab® equipped with Cu K X-ray source. Prior to the X-ray analysis, the platinum disk obtained following galvanostatic deposition of magnesium was carefully covered with 8 μm Kapton film to prevent exposure to air. All experiments were run at 0.3 °/min scan rate and 0.02 ° step size. The ex-situ XRD results shown in figure S45 were run for the pristine, as prepared, Chevrel phase electrode and following the first discharge. The discharged battery was disassembled under Ar in a glove box and the cathode electrode was completely rinsed with THF and dried under vacuum at 25 °C for 12 hours to remove any residual solvent in the electrode. The discharged electrode was then sealed in an air-free sample holder with beryllium window during the XRD analysis. Battery Testing Battery experiments were conducted in 2032 coin cell using a magnesium disk anode, a glass microfiber filter as separator and either Chevrel phase (Mo6S8) cathode or -MnO2 cathode. The Mg anode with 15 mm in diameter was mechanically polished prior to cell assembly. 100 l of as-made electrolytes (APC or MMC/G4) were immersed in the separator (19 mm dia. and 435 m in thickness). The cathodes were prepared by mixing 70 wt% active material, 15-20 wt% carbon black and 10-15 wt% poly(tetrafluoroethylene), pressed into a 100-120 μm thick pellet, and vacuum dried at 120 ◦C for 12 h. The cathode pellets were cut out from the sheet at 15 mm diameter. The cell was assembled in the glove box (H2O and O2 < 0.1 ppm) and run at room temperature under a constant current density.
S4
Thermal Analysis The TGA experiments were conducted in a STA 409 PC Simultaneous Thermal Analyzer from Netzsch Instruments, operated in an argon-filled glovebox. Experiments used 20-30 mg samples with a heating rate of 2 °C/min from ambient to 500 °C and constant argon flow. Water Compatibility Experiment A 0.75 M MMC/G4 electrolyte solution (0.5 mL) was placed in a glass shell containing a stir bar and water was added dropwise without stirring. After 35 seconds, an equal volume of water was added, which stayed as an immiscible layer above the MMC/G4 solution. The biphasic mixture was then stirred and quickly became a colorless solution. Mixing was continued overnight. No reaction was observed during addition nor when the solutions mixed.
S5
NMR spectra
Figure S1. 1H NMR (399.54 MHz, DMSO-d6) of [Mg(H2O)6](CB11H12)2 (2).
Figure S2. 1H{11B} NMR (399.54 MHz, DMSO-d6) of [Mg(H2O)6](CB11H12)2 (2). S6
Figure S3. 11B NMR (128.19 MHz, DMSO-d6) of [Mg(H2O)6](CB11H12)2 (2).
Figure S4. 11B{1H} NMR (128.19 MHz, DMSO-d6) of [Mg(H2O)6](CB11H12)2 (2). S7
Figure S5. 13C NMR (100.47 MHz, DMSO-d6) of [Mg(H2O)6](CB11H12)2 (2).
Figure S6. 1H NMR (399.54 MHz, DMSO-d6) of [Mg(THF)6](CB11H12)2 (3). S8
Figure S7. 1H{11B} NMR (399.54 MHz, DMSO-d6) of [Mg(THF)6](CB11H12)2 (3).
Figure S8. 11B NMR (128.19 MHz, DMSO-d6) of [Mg(THF)6](CB11H12)2 (3). S9
Figure S9. 11B{1H} NMR (128.19 MHz, DMSO-d6) of [Mg(THF)6](CB11H12)2 (3).
Figure S10. 13C NMR (100.47 MHz, DMSO-d6) of [Mg(THF)6](CB11H12)2 (3).
S10
Figure S11. 1H NMR (399.54 MHz, DMSO-d6) of [Mg(DME)3](CB11H12)2 (4).
Figure S12. 1H{11B} NMR (399.54 MHz, DMSO-d6) of [Mg(DME)3](CB11H12)2 (4). S11
Figure S13. 11B NMR (128.19 MHz, DMSO-d6) of [Mg(DME)3](CB11H12)2 (4).
Figure S14. 11B{1H} NMR (128.19 MHz, DMSO-d6) of [Mg(DME)3](CB11H12)2 (4). S12
Figure S15. 13C NMR (100.47 MHz, DMSO-d6) of [Mg(DME)3](CB11H12)2 (4).
Figure S16. 1H NMR (699.76 MHz, DMSO-d6) of [Mg(G2)2](CB11H12)2∙G2 (5). S13
Figure S17. 1H{11B} NMR (399.54 MHz, DMSO-d6) of [Mg(G2)2](CB11H12)2∙G2 (5).
Figure S18. 11B NMR (224.51 MHz, DMSO-d6) of [Mg(G2)2](CB11H12)2∙G2 (5). S14
Figure S19. 11B{1H} NMR (224.51 MHz, DMSO-d6) of [Mg(G2)2](CB11H12)2∙G2 (5).
Figure S20. 13C NMR (175.97 MHz, DMSO-d6) of [Mg(G2)2](CB11H12)2∙G2 (5).
S15
X-Ray Crystallographic Data X-ray quality crystals of 2∙1.5(H2O) were obtained by slow cooling of a 45 °C saturated solution; for 4, were obtained directly from synthetic procedure; for 5, by slowly evaporating THF from the filtrate obtained upon extracting solid mixture 3:AgBr (1:2) (812 mg) with 5 mL of diglyme; for [Mg(G4)2(H2O)](CB11H12)2 (6), by layering anhydrous Et2O onto a 1 M MMC/G4 solution for 16 h, then removing the upper ethereal layer, followed by layering Et2O (containing 50 ppm H2O) onto the remaining thick oil. Complete and redundant data were collected on a single flash-cooled crystal (T=85(2) K with an Oxford Cryostream LT device) using a Rigaku AFC10K Saturn 944+ CCD-based X-ray diffractometer equipped with the Micromax-007HF Cu-target microfocus rotating anode (λ = 1.54178 Å) operated at 1.2 kW power (40 kV, 30 mA). The X-ray intensities were measured with the detector placed at a distance 42 mm from the crystal. Absorption corrections were applied using the SADABS empirical method.[5] The structures were solved and refined using the Bruker SHELXTL[6] software package. All of the non-hydrogen atoms were refined with anisotropic thermal parameters. In 4, 5, and 6, the refinement of H-atoms was mixed. Hydrogen atoms were located in difference Fourier maps and refined individually for: i) all atoms, with O‒H bond distances in water molecules restrained to 0.84 Å using DFIX, in 2∙1.5(H2O); ii) all atoms, except partially occupied B- and C-atoms of carboranes in 4; iii) all B- and C-atoms of carborane molecules in 5; iv) C-atoms of carboranes and of water molecules in 6. The remaining H-atoms were included at geometrically idealized positions. In 2∙1.5(H2O), one of the co-crystallized water molecules displayed symmetry-induced disorder which was modeled using PART ‒1 instruction; since the H-atom of this water refined with an extreme anisotropic ellipsoid, it was manually fixed at 0.05. In 4, two carborane half-cages displayed symmetry induced disorder for C- and B-atoms, which was modeled by allowing shared 50:50 occupancy for B and C occupying the same position. In 5, an inversion twin was refined with the 65:35 ratio. In 6, one of the side chains of tetraglyme displayed a minor disorder, which was refined with the 60:40 ratio between two orientations. The crystallographic data and the details of data collection and structure refinement are provided in Table S1. Figures were prepared using molecular graphics in X-SEED.[7] CIF files have been deposited with the Cambridge Crystallographic Data Centre, CCDC Nos. 1039287 (2∙1.5(H2O)), 1038588 (4), 1038587 (5), and 1038586 (6). Copies of this information may be obtained free of charge from The Cambridge Crystallographic Data Centre via www.ccdc.cam.ac.uk/data_request/cif or from The Director, CCDC, 12 Union Road, Cambridge CB2 1EZ, UK [fax:(int. code) +44 (1223) 336-033 or e-mail:
[email protected]].
S16
Table S1. Crystallographic details for 2∙1.5(H2O), 4, 5, and 6. 2∙1.5(H2O) 4 Formula C2H39B22MgO7.50 C14H54B22MgO6 FW, g∙mol‒1 445.46 580.70 Color, habit colorless needle colorless plate Crystal dimensions (mm3) 0.22 0.17 0.17 0.10 0.06 0.01 Crystal system triclinic triclinic Space group P P a, Å 10.2650(4) 10.9344(2) b, Å 11.9726(2) 11.9271(2) c, Å 12.3503(5) 14.6311(10) α, deg 64.124(6) 91.442(6) β, deg 65.480(4) 92.196(7) γ, deg 78.322(5) 114.536(8) 3 V, Å 1242.08(10) 1732.78(16) Z 2 2 dcalcd, g∙cm‒3 1.191 1.113 µ, mm‒1 0.806 0.651 θ range, deg 4.11–68.22 3.03–68.24 Unique data 33328 46654 obs data, I>2σ(I) 4249 4904 Parameters 448 596 GOFa on F2 1.065 1.141 b c 0.0347, 0.1010 0.0794, 0.2222 R1 , wR2 [I > 2(I)] b c R1 , wR2 (all data) 0.0358, 0.1021 0.0915, 0.2382 max,min (eA3) 0.298, 0.394 0.440, 0.638 Tmin/Tmax 0.78/0.88 0.67 /0.99 a 2 2 2 1/2 GOF = [[w(Fo – Fc ) ]/(Nobs – Nparams)] . b R1 = ||Fo| |Fc||/|Fo|. c wR2 = [[w(Fo2 – Fc2)2]/[w(Fo2)2]]1/2.
S17
5 C20H66B22MgO9 712.85 colorless plate 0.24 0.24 0.09 monoclinic
6 C22H70B22MgO11 772.91 colorless needle 0.24 0.06 0.06 monoclinic
Cc
Cc
23.4092(16) 8.8170(2) 23.7953(17)
14.2944(3) 62.906(5) 14.9555(3)
124.688(9)
91.398(5)
4038.4(5) 4 1.172 0.703 2.26–68.24 56663 7162 566 1.229 0.0350, 0.0883 0.0350, 0.0883 0.304, 0.613 0.78 /0.95
13444.0(11) 12 1.146 0.704 2.81–68.26
188980 19514 1564 1.116 0.0649, 0.1670 0.0783, 0.1811 0.475, 0.573 0.70/1.00
Figure S21. Thermal ellipsoid plot of asymmetric unit of [Mg(H2O)6](CB11H12)2·1.5H2O (2∙1.5(H2O)), shown at 50% probability level. Co-crystallized water molecules are omitted for clarity. Element colors: Mg(green), O (red), B (orange), C (grey), H (white).
S18
Figure S22. Thermal ellipsoid plot of [Mg(DME)3](CB11H12)2 (4), shown at 50% probability level. Element colors: Mg(green), O (red), B (orange), C (grey), H (white).
S19
Figure S23. Thermal ellipsoid plot of [Mg(G2)2](CB11H12)2∙(G2) (5), shown at 50% probability level. Element colors: Mg(green), O (red), B (orange), C (grey), H (white).
S20
Figure S24. Thermal ellipsoid plot of one of the three independent [Mg(G4)2(H2O)](CB11H12)2 molecules found in the unit cell of 6, shown at 50% probability level. The major orientation of G4 is displayed. Element colors: Mg(green), O (red), B (orange), C (grey), H (white). S21
Figure S25. Mg cation coordination environment in [Mg(G4)2(H2O)](CB11H12)2 (6). Thermal ellipsoids drawn at 50% probability level. Hydrogen atoms of G4 ligand are omitted for clarity. Element colors: Mg(green), O (red), C (grey), H (white).
S22
Electrochemistry
Conductivity (mS∙cm‒1)
3.5
MMC/G3 MMC/G4
3 2.5 2 1.5 1 0.5 0 0
0.5 1 Concentration (M)
1.5
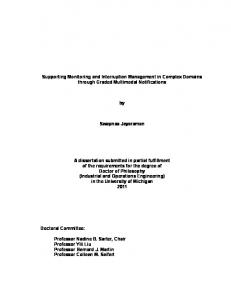
Figure S26. Ionic conductivity of MMC/G3 and MMC/G4 solutions as function of salt concentration.
10
5 Q-Q0 (mC)
Q-Q0 (mC)
CE = 94.4%
CE = 79.6%
0 -10 -20
0 -5 -10
-30
-15
-40 0
400
800 Time (s)
0
1200
400
800 Time (s)
1200
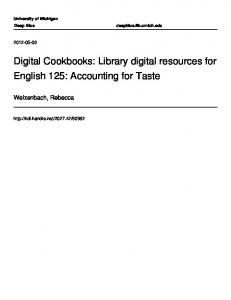
Figure S27. Charge balance of Mg deposition/stripping for the first scan of a cyclic voltammetry test on Pt electrode of 0.75 M MMC/G3 (left) and 0.75 M MMC/G4 (right) electrolytes collected at 5 mV∙s‒1.
S23
Pt
Intensity (a.u.)
Pt
Mg Mg Mg 101 100 002 30
35
Mg 110
Mg 102 40
45 2θ (degrees)
50
55
60
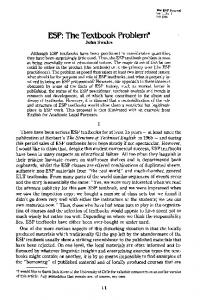
Figure S28. XRD plot of a Pt disk following galvanostatic deposition of Mg from 0.75 M MMC/G4 electrolyte.
Figure S29. SEM micrographs of solid deposited upon galvanostatic Mg plating onto a Pt working electrode at 5 mA cm‒2 from 0.75 M MMC/G4 electrolyte.
S24
Current density (mA∙cm‒2)
1 0.15 M MMC/G4 0.15 M Mg(TFSI)₂/G4 0.17 M LiBF₄/G4 0.15 M MMC/ACN
0.8 0.6 0.4 0.2 0 0.5
1
1.5 2 Potential (V vs Ag/Ag+)
2.5
3
Figure S30. Linear sweep voltammograms of various electrolyte solutions on Pt electrode collected at 0.05 mV∙s‒1.
1st cycle 2nd cycle 50th cycle
10 5 0 Coulombic Efficiency (%)
Current Density
(mA∙cm‒2)
15
-5 -10 -15
100 80 60 40 20 0 0
20
40
60
80
100
Cycle
-20 -1
0
1 2 Potential (V vs Mg)
3
4
Figure S31. Cyclic voltammograms of 0.75 M MMC/G3 electrolyte on a Pt electrode collected within the potential range of −0.6–3.0 V (vs. Mg) collected at 5 mV∙s‒1 (inset: cycling efficiencies of Mg deposition and dissolution). S25
Current Density (mA∙cm‒2)
6 1st cycle
4
2nd cycle
2 0 -2 -4 -6 -8 -1
0
1 2 Potential (V vs Mg)
3
4
Figure S32. Cyclic voltammograms on a 316SS electrode in 0.75 M MMC/G4 electrolyte collected within the potential range of −0.6-3.0 V (vs. Mg) collected at 5 mV∙s‒1.
Current density (mA∙cm‒2)
0.16 Pt GC Ni 316SS Al
0.14 0.12 0.1 0.08
Pt GC Ni 316SS Al
0.06 0.04
0.02 0 2
2.5
3 3.5 Potential (V vs Mg)
4
4.5
Figure S33. Linear sweep voltammograms of 0.75 M MMC/G4 electrolyte on Al, Ni, SS, GC and Pt electrodes collected at 5 mV∙s‒1. Dashed lines represent the reverse scan. S26
Table S2. Summary of EDS analysis of 316SS disk electrode surface and ICP analysis of electrolyte solution before and after chronoamperometry experiments.
Fe Cr Ni Mo
3.0 V Before After EDS (%) EDS (%) 62.2±0.8 62.8±0.8 16.2±0.4 16.3±0.4 14.2±1.0 13.5±1.0 2.5±0.2 2.4±0.2
3.5 V Before After ICP EDS (%) ICP EDS (%)