Supporting Information Detection of Volatile Organic Compounds Using Microfabricated Resonator Array Functionalized with Supramolecular Monolayers Yao Lu, Ye Chang, Ning Tang, Hemi Qu, Jing Liu, Wei Pang*, Hao Zhang, Daihua Zhang, and Xuexin Duan* State Key Laboratory of Precision Measuring Technology & Instruments, College of Precision Instrument and Optoelectronics Engineering, Tianjin University, Tianjin 300072, China. * Tel. /Fax: +86 2227401002. E-mail:
[email protected],
[email protected].
S-1
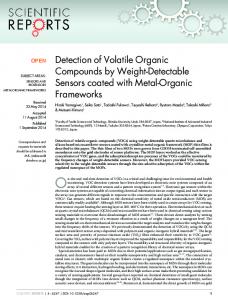
1. FBAR microfabrication process Figure S1 shows the microfabrication process of a film bulk acoustic resonator (FBAR). (a) A single-side polished silicon wafer was rinsed with DI water for the next procedures. (b) An air cavity was generated on the silicon substrate by deep reactive ion etching (DRIE). (c) Then, the air cavity was filled with phosphosilicate glass (PSG) as sacrificial layer by chemical vapor deposition (CVD) and (d) the deposited wafer was reduced by chemical mechanical polish (CMP). (e) The bottom electrode (Mo), piezoelectric layer (AlN) and the top electrode (Mo) were deposited successively to form a typically sandwiched structure of FBAR. (f) The passivation layer (AlN) was then deposited on the top electrode to protect it from oxidation and corrosion. (g) The Au pads were first formed by physical vapor deposition (PVD) and then lifted off to achieve electrical connection. (h) Finally, the sacrificial layer was released by hydrofluoric acid to form an air cavity to realize the vibration of FBAR. (a)
(e)
(b)
(f)
(c)
(g)
(d)
(h)
Silicon
PSG
Mo
AlN
Au
Figure S1. FBAR microfabrication process. (a) A single-side polished silicon wafer. (b) An air cavity generated by DRIE. (c) Deposition of PSG layer. (d) Wafer reduction by CMP. (e)
S-2
Deposition of electrodes and piezoelectric layer. (f) Deposition of passivation layer. (g) Deposition and lift-off of Au electrode. (h) Release of the air cavity. 2. Setup for VOCs detection Figure S2 shows the VOCs detection setup used in this work. Since most VOCs are harmful to the human health and the environment, a VOCs absorber filled with ethanol was added at the end of the gas channel.
Figure S2. VOCs detection setup
3. Contact angle measurements Figure S3 shows the values of Contact Angles (CA) for the four supramolecular monolayers (Calix[8]arene, Porphyrin, β-CD and CB[8]), which prove that the interfaces of Calix[8]arene and Porphyrin are hydrophobic. On the contrast, the interfaces of β-CD and CB[8] present hydrophilic.
S-3
Figure S3. CA results of AlN substrates after coatings of supramolecular monolayers of (a) Calix[8]arene, (b) Porphyrin, (c) β-CD and (d) CB[8]. 4. Energy dispersive spectrometer tests The analysis of element contents was used to characterize the supramolecular films on Si surfaces instead of AlN since the contents of N would be influenced by the AlN substrates. It was obtained by Energy Dispersive Spectrometer (EDS) on Scanning Electron Microscope (SEM). Table S1 shows the atomic percent of elements C and N contained in the four supramolecules from EDS tests and theoretical calculations respectively. Table S1. Atomic percent of elements C and N contained in the four supramolecules from EDS tests and theoretical calculations. Atomic percent
Calix[8]arene
Porphyrin
β-CD
CB[8]
(%)
EDS
theoretical
EDS
theoretical
EDS
theoretical
EDS
theoretical
C
23.82
42.31
48.18
42.86
16.39
28.57
23.75
33.33
N
0.79
0
4.98
4.76
0.08
0
1.36
22.22
S-4
5. Real-time sensor responses of the FBAR sensor array Figure S4 shows the real-time sensor responses of an FBAR sensor array containing sensors individually functionalized with four supramolecular monolayers (Calix[8]arene, Porphyrin, β-CD and CB[8]) in exposure to acetone, n-propyl alcohol (NPA), methanol, hexane and cyclohexane vapors respectively at ten different concentrations. (a) Acetone
Frequency Shift (kHz)
2000 0.1 0.2 0.3 0.4 0.5 0.6
0.7
0.8
0.9
1.0
0 -2000
N2 N2 N2 N2
N2
N2
-4000
N2 N2
-6000
N2
Calix[8]arene Porphyrin β-CD CB[8]
-8000
N2
-10000 0
1000 2000 3000 4000 5000 6000 7000
Time (Seconds) (b) NPA
Frequency Shift (kHz)
500 0.1 0.2 0.3
0.4 0.5
0.6
0.7 0.8 0.9
1.0
0 -500 N2 N2
-1000
N2
N2
N2
-1500
N2 N2
-2000
Calix[8]arene Porphyrin β-CD CB[8]
-2500 -3000
N2
N2
-3500 0
1000
2000
3000
4000
N2
5000
Time (Seconds)
S-5
Frequency Shift (kHz)
(c) Methanol 2000 0.1 0.2 0.3 0.4 0.5 0.6 0.7 0.8 0
0.9
1.0
-2000 N2 N2 N2 N N 2 2 N2 N2
-4000
N2
-6000 N2
-8000 -10000
Calix[8]arene Porphyrin β-CD CB[8]
-12000 -14000
N2
-16000 0
1000
2000
3000
4000
5000
6000
7000
Time (Seconds) (d) Hexane
Frequency Shift (kHz)
1000 0.1 0.2 0.3 0.4 0.5 0.6
0.7 0.8
0.9
1.0
0 -1000 N2 N 2
-2000
N2 N 2 N 2
N2 N2
-3000
N2
-4000
Calix[8]arene Porphyrin β-CD CB[8]
-5000 -6000
N2
N2
-7000 0
500
1000
1500
2000
2500
3000
3500
Time (Seconds)
S-6
(e) Cyclohexane
Frequency Shift (kHz)
500 0.1 0.2 0.3 0.4
0.5
0.6
0.7 0.8
0.9
1.0
0 -500 N2 N 2 N 2
-1000
N2
-1500
N2
N2 N2
-2000
N2
Calix[8]arene Porphyrin β-CD
-2500 -3000
N2
CB[8]
N2
-3500 0
500
1000
1500
2000
2500
3000
3500
Time (Seconds) Figure S4. Real-time sensor responses of the FBAR sensor array functionalized with supramolecular monolayers in exposure to (a) acetone, (b) NPA, (c) methanol, (d) hexane and (e) cyclohexane vapors respectively at ten different concentrations in terms of P/P0 from 0.1 to 1. The frequency responses of the same modified FBAR sensor array in exposure to different VOCs behave discriminative in Figure S4. Among the six VOCs (including the detection of chloroform shown in Figure 5(a)), chloroform has the most frequency shift at the same VOCs concentration (-2 kHz at P/P0= 0.5), which indicates that the four supramolecular monolayers are more sensitive to chloroform than the other five VOCs. Besides, the shapes of the real-time frequency shift curves are different as well for the six VOCs. The main reason is the different Van de Walls force between the gas molecules and the supramolecular receptors.
6. Adsorption isotherms of VOCs on supramolecular monolayers The adsorption isotherms of acetone, NPA, methanol, hexane and cyclohexane on four supramolecular monolayers were plotted in Figure S5. The solid lines fitted by the Dual-Site
S-7
Langmuir-Freundlich (DSLF) equation match well with the measuring data (squares in Figure S5). (b)
(a) Calix[8]arene Porphyrin β-CD CB[8]
9000 8000 7000 6000 5000 4000 3000 2000 1000
Acetone
0
Frequency Shift (kHz)
Frequency Shift (kHz)
10000
2500
Calix[8]arene Porphyrin β-CD CB[8]
2250 2000 1750 1500 1250 1000 750 500 250
NPA
0 0.1
0.1 0.2 0.3 0.4 0.5 0.6 0.7 0.8 0.9 1.0
0.2
0.3
0.4
0.6
0.7
0.8
0.9
P/P0
P/P0
(c)
(d) 4500
5000
Calix[8]arene Porphyrin β-CD CB[8]
4000 3500 3000 2500 2000 1500 1000 500
Methanol
0 0.1
0.2
0.3
0.4
0.5
0.6
0.7
0.8
Frequency Shift (kHz)
Frequency Shift (kHz)
0.5
0.9
4500 4000 3500
Calix[8]arene Porphyrin β-CD CB[8]
3000 2500 2000 1500 1000 500
Hexane
0
0.1 0.2 0.3 0.4 0.5 0.6 0.7 0.8 0.9 1.0
P/P0
P/P0
(e) Frequency Shift (kHz)
4000 3500 3000
Calix[8]arene Porphyrin β-CD CB[8]
2500 2000 1500 1000 500
Cyclohexane
0
0.1 0.2 0.3 0.4 0.5 0.6 0.7 0.8 0.9 1.0
P/P0
Figure S5. The adsorption isotherms of (a) acetone, (b) NPA, (c) methanol, (d) hexane and (e)
S-8
cyclohexane on four supramolecular monolayers. For the six VOCs (including chloroform already shown in Figure 5(b)) to be detected, the adsorption isotherms varied with different VOCs however, they display the same trend of two-step process.
7. Adsorption kinetics of VOCs on supramolecular monolayers By fitting the adsorption curves, the obtained values of (ka (P/P0) + kd) were plotted versus VOCs concentrations as well for acetone, NPA, methanol, hexane and cyclohexane (see Figure S6). The slopes of the fitted solid lines give the adsorption rate constants. The number of obtained values of (ka (P/P0) + kd) varies with different VOCs. It is likely that the turning points between monolayer and multiple-layer adsorption are distinct for different VOCs.
(a)
(b)
0.32
Calix[8]arene Porphyrin β-CD CB[8]
0.28 0.24
ka(P/P0)+kd
ka(P/P0)+kd
0.28
0.32
Calix[8]arene Porphyrin β-CD CB[8]
0.24
0.20
0.16
Acetone 0.12
0.20 0.16 0.12 0.08
NPA
0.04 0.10
0.15
0.20
P/P0
0.25
0.30
0.1
0.2
0.3
0.4
0.5
0.6
P/P0
S-9
(c)
(d)
0.32
0.24
Calix[8]arene Porphyrin β-CD CB[8]
Calix[8]arene Porphyrin β-CD CB[8]
0.32 0.28
ka(P/P0)+kd
ka(P/P0)+kd
0.28
0.20 0.16 0.12
0.24 0.20 0.16 0.12
Methanol
Hexane
0.08
0.08 0.1
0.2
0.3
0.4
0.5
0.1
0.2
P/P0
0.3
0.4
0.5
P/P0
(e) 0.32
Calix[8]arene Porphyrin β-CD CB[8]
0.28
ka(P/P0)+kd
0.24 0.20 0.16 0.12 0.08
Cyclohexane 0.04 0.1
0.2
0.3
0.4
0.5
0.6
0.7
P/P0
Figure S6. Plots of adsorption rates (ka (P/P0) + kd) versus P/P0 for (a) acetone, (b) NPA, (c) methanol, (d) hexane and (e) cyclohexane.
S-10