Supporting Information
New steroidal saponins from the rhizomes of Paris vietnamensis and their cytotoxicity
Yang Liu 1, †, Minchang Wang 2, 3, †, Ke Liu 2,3, Pengcheng Qiu 1, Shan Zhang 1, Yunyang Lu 1, Na Tang 1, Haifeng Tang 1,*
1
Institute of Materia Medica, School of Pharmacy, Fourth Military Medical University, Xi’an 710032, PR China;
[email protected] (Y.L.);
[email protected] (H.-F.T.)
2
State Key Laboratory of Fluorine & Nitrogen Chemicals, Xi’an 710065, PR China;
[email protected] (M.-C.W.);
[email protected] (K. L.)
3
Xi’an Modern Chemistry Research Institute, Xi’an 710065, PR China;
[email protected] (M.-C.W.);
[email protected] (K. L.)
* Correspondence:
[email protected] (H.-F.T.); Tel.: +86-29-8477-4748 (H.-F.T.) † The authors contribute equally to this work.
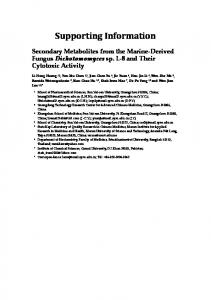
Contents Figure S1 Structures of compounds 110 from Paris vietnamensis Figure S2 Key 1H-1H COSY, HMBC and NOESY correlations of compound 2. Figure S3 Key 1H-1H COSY, HMBC and NOESY correlations of compound 3. Figure S4 Key 1H-1H COSY, HMBC and NOESY correlations of compound 4
Physical and spectroscopic data of compounds 510 Table S113C-NMR data of the aglycone moieties of compounds 5-10 Table S2 13C-NMR data of the sugar portion of compounds 5-10
NMR (1D and 2D) and MS spectra of compounds 14 S1. Positive HR-ESI-MS spectrum of compound 1 S2. Positive and Negative ESI-MS spectrum of compound 1 S3. 1H NMR (800 MHz, CD3OD) spectrum of compound 1 S4. 13C NMR (201 MHz, CD3OD) spectrum of compound 1 S5. DEPT 135 spectrum of compound 1 S6. HSQC spectrum of compound 1 S7. HMBC spectrum of compound 1 S8. 1H-1H COSY spectrum of compound 1 S9. NOESY spectrum of compound 1 S10. TOCSY spectrum of compound 1 S11. Positive HR-ESI-MS spectrum of compound 2 S12. Positive and Negative ESI-MS spectrum of compound 2 S13. 1H NMR (800 MHz, CD3OD) spectrum of compound 2 S14. 13C NMR (201 MHz, CD3OD) spectrum of compound 2 S15. DEPT 135 spectrum of compound 2 S16. HSQC spectrum of compound 2
S17. HMBC spectrum of compound 2 S18. 1H-1H COSY spectrum of compound 2 S19. NOESY spectrum of compound 2 S20. TOCSY spectrum of compound 2 S21. Positive HR-ESI-MS spectrum of compound 3 S22. Positive ESI-MS spectrum of compound 3 S23. 1H NMR (500 MHz, CD3OD) spectrum of compound 3 S24. 13C NMR (125 MHz, CD3OD) spectrum of compound 3 S25. DEPT 135 spectrum of compound 3 S26. HSQC spectrum of compound 3 S27. HMBC spectrum of compound 3 S28. 1H-1H COSY spectrum of compound 3 S29. NOESY spectrum of compound 3 S30. TOCSY spectrum of compound 3 S31. Positive HR-ESI-MS spectrum of compound 4 S32. 1H NMR (500 MHz, CD3OD) spectrum of compound 4 S33. 13C NMR (125 MHz, CD3OD) spectrum of compound 4 S34. DEPT 135 spectrum of compound 4 S35. HSQC spectrum of compound 4 S36. HMBC spectrum of compound 4 S37. 1H-1H COSY spectrum of compound 4 S38. NOESY spectrum of compound 4 S39. TOCSY spectrum of compound 4
Aglycone
R1
R2
R3
R4
Configuration of C-25
1
I
S1
COCH3
OH
CH3
25R
2
I
S1
H
OH
CH2OH
25R
3
II
S1
H
-
-
25R
4
II
S2
H
-
-
25R
5
I
S1
H
OH
CH3
25R
6
I
S1
H
OH
CH3
25S
7
I
S3
H
OH
CH3
25R
8
I
S4
H
H
CH3
25R
9
I
S5
H
OH
CH3
25R
10
I
S1
H
H
CH3
25R
Figure S1 Structures of compounds 110 from Paris vietnamensis
Figure S2 Key 1H-1H COSY, HMBC and NOESY correlations of compound 2
Figure S3 Key 1H-1H COSY, HMBC and NOESY correlations of compound 3
Figure S4 Key 1H-1H COSY, HMBC and NOESY correlations of compound 4
Physical and spectroscopic data of compounds 510 Compound 5: White amorphous powder; 1H-NMR (500MHz, CD3OD) δH: 0.83 (3H, s, H-18), 1.05 (3H, s, H-19), 0.89 (3H, d, J = 6.4 Hz, H-21), 0.80 (3H, d, J = 7.2 Hz, H-27), 5.39 (1H, br s, H-6), 1.26 (3H, d, J = 6.24 Hz, Me of Rha I), 4.48 (1H, d, J = 7.76 Hz, Glc H-1), 5.20 (1H, br s, Rha H-1);
C-NMR data, see Table S1 and Table S2; ESI-MS
13
(negative ion mode) 737 [M – H]. Compared to the physical and spectroscopic data with
literature
values,
compound
5
25(R)-spirost-5-en-3β,17α-diol-3-O-α-L-rhamnopyranosyl-
was
identified (1
as →
2)-β-D-glucopyranoside [1]. Compound 6: White amorphous powder; 1H-NMR (500MHz, CD3OD) δH: 0.89 (3H, s, H-18), 1.06 (3H, s, H-19), 0.93 (3H, d, J = 7.44 Hz, H-21), 1.09 (3H, d, J = 7.12 Hz, H-27), 5.39 (1H, br s, H-6), 1.24 (3H, d, J = 6.24 Hz, Me of Rha I), 4.48 (1H, d, J = 7.76 Hz, Glc
H-1), 5.19 (1H, br s, Rha H-1);
C-NMR data, see Table S1 and Table S2; ESI-MS
13
(negative ion mode) 737 [M – H]. Compared to the physical and spectroscopic data with
literature
values,
compound
6
was
25(S)-spirost-5-en-3β,17α-diol-3-O-α-L-rhamnopyranosyl
identified -(1
→
as 2)
-β-D-glucopyranoside [2]. Compound 7: White amorphous powder; 1H-NMR (500MHz, CD3OD) δH: 0.83 (3H, s, H-18), 1.05 (3H, s, H-19), 0.89 (3H, d, J = 7.2 Hz, H-21), 0.80 (3H, d, J = 6.4 Hz, H-27), 5.39 (1H, br s, H-6), 1.24 (3H, d, J = 6.24 Hz, Me of Rha I), 4.48 (1H, d, J = 7.84 Hz, Glc H-1), 5.19 (1H, br s, Rha H-1);
C-NMR data, see Table S1 and Table S2; ESI-MS
13
(negative ion mode) 737 [M – H]. Compared to the physical and spectroscopic data with
literature
values,
compound
7
was
25(R)-spirost-5-en-3β,17α-diol-3-O-α-L-rhamnopyranosyl-(1
identified
as →
3)-β-D-glucopyranoside [3]. Compound 8: White amorphous powder; 1H-NMR (500MHz, CD3OD) δH: 0.82 (3H, s, H-18), 1.07 (3H, s, H-19), 0.98 (3H, d, J = 7.0 Hz, H-21), 0.81 (3H, d, J = 6.4 Hz, H-27), 5.40 (1H, br s, H-6), 1.27 (3H, d, J = 6.25 Hz, Me of Rha I), 1.26 (3H, d, J = 6.25 Hz, Me of Rha II), 4.51 (1H, d, J = 7.8 Hz, Glc H-1), 5.22 (1H, br s, Rha I H-1), 4.85 (1H, br s, Rha II H-1); 13C-NMR data, see Table S1 and Table S2; ESI-MS (negative ion mode) 867 [M – H]. Compared to the physical and spectroscopic data with literature values, compound 8 was identified as 25(R)-diosgenin-3-O-α-L-rhamnopyranosyl-(1 → 2)-α-L-rhamnopyranosyl- (1→3)-β-D-glucopyranoside [4]. Compound 9: White amorphous powder; 1H-NMR (500MHz, CD3OD) δH: 0.84 (3H, s,
H-18), 1.06 (3H, s, Me-19), 0.90 (3H, d, J = 7.25 Hz, H-21), 0.80 (3H, d, J = 6.3 Hz, H-27), 5.40 (1H, br s, H-6), 1.25 (3H, d, J = 6.25 Hz, Me of Rha I), 1.27 (3H, d, J = 6.25 Hz, Me of Rha II), 4.51 (1H, d, J = 7.85 Hz, Glc H-1), 5.21 (1H, br s, Rha I H-1), 4.85 (1H, br s, Rha II H-1); 13C-NMR data, see Table S1 and Table S2; ESI-MS (negative ion mode) 883 [M – H]. Compared to the physical and spectroscopic data with literature values, compound
9
was
identified →
25(R)-spirost-5-en-3β,17α-diol-3-O-α-L-rhamnopyranosyl-(1
as 4)-[α-L-rhamn
opyranosyl-(1→2)]-β-D-glucopyranoside [5]. Compound 10: White amorphous powder; 1H-NMR (500MHz, CD3OD) δH: 0.81 (3H, s, H-18), 1.05 (3H, s, Me-19), 0.96 (3H, d, J = 7.0 Hz, H-21), 0.79 (3H, d, J = 6.4 Hz, H-27), 5.38 (1H, br s, H-6), 1.24 (3H, d, J = 6.25 Hz, Me of Rha), 4.48 (1H, d, J = 7.75 Hz, Glc H-1), 5.19 (1H, br s, Rha H-1);
C-NMR data, see Table S1 and Table S2; ESI-MS
13
(negative ion mode) 721 [M – H]. Compared to the physical and spectroscopic data with
literature
values,
compound
10
was
identified
25(R)-diosgenin-3-O-α-L-rhamnopyranosyl-(1→2)-β-D- glucopyranoside [6].
Table S1
C-NMR data of the aglycone moieties of compounds 5-10
13
Compounds
Position 5
6
7
8
9
10
1
38.74
38.74
38.74
38.70
38.72
38.70
2
30.91
30.90
30.91
.0.89
30.87
30.89
as
3
79.32
79.33
79.32
79.43
79.39
79.35
4
39.66
39.66
39.66
39.65
39.63
39.66
5
142.05
142.06
142.05
142.04
141.99
142.07
6
122.75
122.72
122.75
122.78
122.78
122.74
7
32.66
33.36
32.66
32.88
32.64
32.89
8
33.44
33.38
33.44
32.93
33.41
32.93
9
51.64
51.62
51.63
51.84
51.59
51.85
10
38.15
38.15
38.15
38.19
38.12
38.19
11
21.84
21.91
21.84
22.12
21.84
22.13
12
33.01
33.38
33.00
41.08
32.98
41.08
13
46.00
46.49
46.00
41.57
45.97
41.56
14
54.08
53.36
54.07
57.95
54.05
57.95
15
32.25
32.94
32.25
33.32
32.24
33.35
16
90.69
89.78
90.69
82.35
90.68
82.36
17
91.45
90.06
91.45
63.89
91.43
63.88
18
17.67
18.01
17.67
16.69
17.69
16.92
19
19.99
19.98
19.99
19.99
19.99
19.99
20
45.68
46.75
45.68
43.06
45.66
43.05
21
9.25
10.06
9.25
15.01
9.27
15.03
22
111.10
112.31
111.10
110.73
111.09
110.73
23
33.37
22.49
33.37
32.57
33.36
32.57
24
29.59
25.33
29.59
30.03
29.57
30.03
25
31.44
28.58
31.44
31.58
31.42
31.59
26
67.86
69.56
67.86
68.00
67.84
68.00
27
17.64
16.67
17.64
17.64
17.65
17.64
Table S2
Compounds
Sugar portion Glc
C-NMR data of the sugar portion of compounds 5-10
13
1
5
6
7
8
9
10
100.66
100.67
100.66
100.60
100.56
100.68
Rha I
Rha II
2
79.18
79.18
79.54
79.45
79.46
79.18
3
77.89
79.53
79.18
80.13
76.70
77.86
4
79.54
77.88
77.89
76.72
80.06
79.52
5
71.99
72.00
71.99
78.18
78.15
71.98
6
62.91
62.91
62.09
62.07
62.91
1
102.33
102.31
102.33
102.43
102.43
102.31
2
72.38
72.37
72.38
72.33
72.30
72.36
3
72.53
72.54
72.53
79.42
72.49
72.53
4
74.09
74.10
74.09
73.87
74.04
74.07
5
69.90
69.90
69.90
69.91
69.91
69.89
6
18.11
18.11
18.11
18.13
18.02
18.11
1
103.15
103.13
2
74.07
72.57
3
72.59
72.30
4
72.51
73.85
5
70.82
70.79
6
18.01
18.12
62.91
Reference
1. Xie, B.B; Liu, H.Y; Ni, W; Chen, C.X. Ypsilandrosides C-G, five new spirostanol saponins from Ypsilandra thibetica. Steroids 2009, 12, 950-955. 2. Kang, L.P; Huang, Y.Y; Zhan, Z.L; Liu, D.H; Peng, H.S; Nan, T.G; Zhang, Y; Hao, Q.X; Tang, J.F; Zhu, S.D; et al. Structural characterization and discrimination of the Paris polyphylla var. yunnanensis and Paris vietnamensis based on metabolite profiling analysis. Journal of Pharmaceutical and Biomedical Analysis 2017, 142, 252-261. 3. Tang, L.Y; Wang, Z.J; Wu, H.W; Yokosuka, A; Mimaki, Y. Steroidal glycosides from the underground parts of Dracaena thalioides and their cytotoxic activity. Phytochemistry 2014, 107, 102-110. 4. Khodakov, G.V;
Akimov, Y.A;
Shashkov, A.S; Kintia, P.K;
Grishkovets,
V.I.
Triterpene and steroid saponins isolated from two Melilotus species. Oxygen
Transport to Tissue XXXIII 1996, 405,: 211-222. 5. Li, Y.H; Liu, C.X; Xiao, D; Han, J; Yue, Z.G; Sun, Y; Fan, L; Zhang, F; Meng, J; Zhang, R; et al. Trillium tschonoskii steroidal saponins suppress the growth of colorectal Cancer cells in vitro and in vivo. Journal of Ethnopharmacology 2015, 168, 136-145. 6. Lee, H.J; Watanabe, B; Nakayasu, M; Onjo, M; Sugimoto, Y; Mizutani, M. Novel steroidal saponins from Dioscorea esculenta (Togedokoro). Bioscience, Biotechnology, and Biochemistry 2017, 81, 2253-2260.
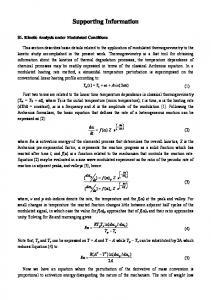
S1. Positive HR-ESI-MS spectrum of compound 1 Mass 803.4170
Calc. Mass 803.4194
mDa -2.4
-3.0
PPM 9.5
DBE 212.5
i-FIT
Formula C41H64O14Na
SIPI Q-Tof micro N-15 YA019 Y18-012HR 24 (0.443) AM (Cen,4, 80.00, Ar,5000.0,775.39,1.00); Sm (Mn, 2x3.00); Sb (1,5.00 ); Cm (13:28) 803.4170 100
14:38:22,11-Feb-2018 TOF MS ES+ 1.30e+004
804.4224
%
805.4301 802.4611 802.9195
802.0673
0 801.50
802.00
802.50
803.9668
803.00
803.50
804.00
804.9446 804.50
805.8790
805.00
805.50
806.0790 m/z
806.00
806.50
S2. Positive and Negative ESI-MS spectrum of compound 1 SIPI N-15
Q-Tof micro YA019
10:39:39,17-Jan-2018
Y18-012 1 (0.019) Cm (1:2)
TOF MS ES+ 1.66e3
803.31
100
%
804.32
763.35 85.09
88.08
213.15
256.25 312.31
395.27 437.18
805.35
761.35 487.27
555.27 619.47
0 Y18-012N 1 (0.019) Cm (1:2)
TOF MS ES450
779.25
100
780.26
%
737.26
815.21 826.25 325.14
653.19
434.24 591.21
0
m/z 100
200
300
400
500
600
700
800
900
1000
1100
1200
S3. 1H NMR (800 MHz, CD3OD) spectrum of compound 1
1300
1400
S4. 13C NMR (201 MHz, CD3OD) spectrum of compound 1
S5. DEPT 135 spectrum of compound 1
S6. HSQC spectrum of compound 1
S7. HMBC spectrum of compound 1
S8. 1H-1H COSY spectrum of compound 1
S9. NOESY spectrum of compound 1
S10. TOCSY spectrum of compound 1
S11. Positive HR-ESI-MS spectrum of compound 2 Mass
Calc. Mass
mDa
PPM
DBE
i-FIT
Formula 777.4044
777.4037
0.7
0.9
8.5
140.1
C39H62O14Na
SIPI Q-Tof micro N-19 YA019 Y18-013HR 30 (0.555) AM (Cen,4, 80.00, Ar,5000.0,803.42,1.00); Sm (Mn, 2x3.00); Sb (1,5.00 ); Cm (8:46) 777.4044 100
%
13:53:26,11-Feb-2018 TOF MS ES+ 5.28e+003
778.4103
779.4168
777.8839
776.9425
0 776.50
777.00
777.50
778.8830
778.00
778.50
779.8813
779.00
779.50
m/z
780.00
780.50
S12. Positive and Negative ESI-MS spectrum of compound 2 SIPI N-19
Q-Tof micro YA019
10:49:33,17-Jan-2018
Y18-013 3 (0.056) Cm (3)
TOF MS ES+ 611
777.47
100
%
778.50
779.49 312.37 256.32
284.36
393.35
761.47
437.26 523.38
619.60 647.65
793.50
719.55
0 Y18-013N 4 (0.074) Cm (1:4)
TOF MS ES122
753.28
100
753.22
%
754.28
753.03 789.06
96.93
219.10
255.17
311.15 339.07
799.30 447.07 485.18
653.05 737.29 559.18 615.16
843.35867.13
0
m/z 100
200
300
400
500
600
700
800
900
1000
1100
1200
1300
1400
S13. 1H NMR (800 MHz, CD3OD) spectrum of compound 2
S14. 13C NMR (201 MHz, CD3OD) spectrum of compound 2
S15. DEPT 135 spectrum of compound 2
S16. HSQC spectrum of compound 2
S17. HMBC spectrum of compound 2
S18. 1H-1H COSY spectrum of compound 2
S19. NOESY spectrum of compound 2
S20. TOCSY spectrum of compound 2
S21. Positive HR-ESI-MS spectrum of compound 3 Mass
Calc. Mass
775.3884
mDa
775.3881
0.3
PPM
DBE
0.4
9.5
i-FIT
Formula
n/a
C39H60O14Na
SIPI Q-Tof micro N-23 YA019 Y18-014HR 6 (0.111) AM (Cen,4, 80.00, Ar,5000.0,803.42,1.00); Sm (Mn, 2x3.00); Sb (1,5.00 ); Cm (3:9) 775.3884 100
14:02:55,11-Feb-2018 TOF MS ES+ 1.85e+003
776.3945
%
774.4407
773.8578
0 773.50
774.00
774.8888
774.50
775.9672
775.00
775.50
777.0291
776.7836
776.00
776.50
m/z
777.00
777.50
S22. Positive ESI-MS spectrum of compound 3 SIPI N-23
Q-Tof micro YA019
11:02:23,17-Jan-2018
Y18-014 2 (0.037) Cm (2:3) 775.43
100
TOF MS ES+ 3.14e3
x10
%
776.46
427.35
777.48
791.48
1527.94
428.36
792.51
445.37 793.51
409.35
761.55 1529.01
0
m/z 100
200
300
400
500
600
700
800
900
1000
1100
1200
1300
1400
S23. 1H NMR (500 MHz, CD3OD) spectrum of compound 3
1500
1600
S24. 13C NMR (125 MHz, CD3OD) spectrum of compound 3
S25. DEPT 135 spectrum of compound 3
S26. HSQC spectrum of compound 3
S27. HMBC spectrum of compound 3
S28. 1H-1H COSY spectrum of compound 3
S29. NOESY spectrum of compound 3
S30. TOCSY spectrum of compound 3
S31. Positive HR-ESI-MS spectrum of compound 4
Mass
Calc. Mass
775.3849
775.3881
mDa -3.2
PPM
-4.1
DBE
i-FIT
9.5
36.7
Formula C39H60O14Na
SIPI Q-Tof micro N-44 YA019 Y18-048HR 21 (0.390) AM (Cen,4, 80.00, Ar,5000.0,891.47,1.00); Sm (Mn, 2x3.00); Sb (1,5.00 ); Cm (16:25) 775.3849 100
15:04:32,11-Feb-2018 TOF MS ES+ 6.44e+003
776.3913
%
777.4015 774.3884
0 774.00
774.50
778.4094 774.8665 775.00
775.8705 775.50
776.00
776.8906 776.50
777.00
777.7918 777.50
778.00
S32. 1H NMR (500 MHz, CD3OD) spectrum of compound 4
S33. 13C NMR (125 MHz, CD3OD) spectrum of compound 4
779.1373 778.50
779.00
m/z 779.50
S34. DEPT 135 spectrum of compound 4
S35. HSQC spectrum of compound 4
S36. HMBC spectrum of compound 4
S37. 1H-1H COSY spectrum of compound 4
S38. NOESY spectrum of compound 4
S39. TOCSY spectrum of compound 4