Supporting Information S5. Software users' guide. A brief guide ... - PLOS
Recommend Documents
|xi| = Dâ1. (bi+Hi·ei). · ei. Therefore, inverting the matrix, it holds,. D(bi+Hi·ei). · |xi| = ei which can be written using the Hadamard product,. (bi + Hi · ei) â |xi| = ei.
Table S5: The coordinates and sequences of the 20 bp sequence tags flanking each of the 114 a-right"128T repeats in strains Z2491, MC58 and FAM18.
Online Supporting Information S3. A protocol guide for iDNA-Prot web-server. For the convenience of the vast majority of experimental scientists, here let us give ...
The high resolution of 5km enabled to reproduce these spatially detailed patterns. 0.0864. 0. â0.0864. â0.1728. â0.2592. â0.3456. â0.4320. â0.5184. â0.6048.
Stable Cell Line Generation â Day by Day Protocol. General ... Eventually, though, the untransfected cells will die whereas the ... Day 7 â if HeLa were replated, most likely it is necessary to replace medium as there will be a lot of dead cells.
Jan 17, 2014 ... Table of Contents. Introduction. ... Software Support. ...... Creating and Saving a
Layout................................................................................................74.
Jan 4, 2018 - eWallet, eWallet GO!, SyncPro and Ilium Software are registered trademarks and PassBuilder is a trademark
Jan 4, 2018 - and brand names may be trademarks or registered trademarks of their respective owners. The appearance of t
Most, but not all, studies assign the 3/4- and 4/4-genotype females to the high ... 4/4 and 3/3 (P = 0.054) in stage two; significant differences between 3/4 and 3/3 ...
best represented on a vector map consisting of points, lines, and/or polygons ex- ..... rope, illustrations ranking mountain-top elevations and the lengths of rivers ...
(2.0 mmol), 2-cyanothioacetamide 3 (2.0 mmol) in ethanol (20 ml), piperidine. 4a (2.0 mmol) was added. The mixture was stirred at room temperature for 1 h,.
Oct 31, 2013 ... A transfer of certain allowable head office administrative expenses by means ...
and machinery specifically related to manufacturing, and on computer ......
authorized betting on football matches by an authorized company. 28 ...
Medieval Numerology: A Brief Guide. Numerology is the belief that particular
numbers have mystical significance, a concept of key importance in the Jewish ...
Apr 11, 2014 - All ribosome profiling experiments analyzed involve attaching a known sequence to the ..... Data Structures for Statistical Computing in Python.
Ground beetle species trait codes: Body length (BL) (mm), major diet (MD) .... Ribera I, Doledec S, Downie IS, Foster GN (2001) Effect of land disturbance and ...
a show-up fee of AC4 will be paid for taking part to this experiment. The experiment is made of two phases which are conducted in two days (Phase 1 today ...
distributions the defecation probability distributions, which we plot in S1 Fig. Two Gaussian probability density functions, P1(t) and P2(t), have been fitted to these ...
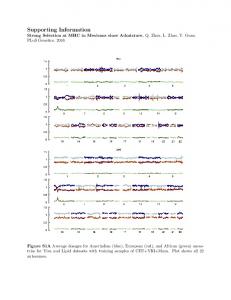
Figure S1C Average dosages for Amerindian (blue), European (red), and African (green) ancestries for Lipid datasets with training samples of TSI+YRI+Maya, ...
2. van der Spoel D, Lindahl E, Hess B, Groenhof G, Mark AE, et al. (2005) Gromacs: Fast ... Hornak V, Abel R, Okur A, Strockbine B, Roitberg A, et al. (2006) ...
10 times, leading to average and standard deviation of performance indices. 183. Performances were compared using the Wilcoxon signed-rank test [35] with an ...
Highest completed degree [PhD, Master; Bachelor; A-levels; mandatory school] ... In part two, the respondents were asked to (1) answer to general knowledge questions (single-choice from ... Correct answers are marked in bold letters here.
The summary of neutralization and binding data is provided for reference. A green color and âYesâ indicates the mAb does neutralize or bind to each.
Supporting Information S5. Software users' guide. A brief guide ... - PLOS
Supporting Information S5. Software users' guide. A brief guide detailing how to use the collection and analysis software. Operation of the collection software:.
Supporting Information S5. Software users’ guide. A brief guide detailing how to use the collection and analysis software.
Operation of the collection software:
Real-Time experiments are set up using the page shown above. 1) Temperature parameters are input using the buttons on the top left. A temperature program can be saved using the buttons above the temperature input buttons. 2) Experimental parameters are input below the temperature program. 3) Each dye can have a different exposure time, and more than one exposure time can be used for each of the dyes, and multiple dyes can be used for imaging by selecting the ones desired. 4) The camera can be focused using the readout to the right of the page. 5) The buttons along the top can be used to setup and verify each individual piece of equipment.
Real-time experiments are started using the page shown above 1) The name and location of the save is denoted using the button in the middle bottom of the page.
2) After all parameters are defined, the program can be started using the “start program” button. 3) If a melt-curve is desired, the box can be checked before starting the program. 4) While the program is running, the graph is updated with the temperature profile, and the “run data” parameters are updated in real-time. 5) Each image collected can be viewed using the viewer on the right.
Melt curve experiments can be setup using the following page. 1) Melt curve experiments are defined with a low temperature, a high temperature, a temperature increment, a stabilization time, and exposure times for desired dyes. More than one dye can be used in the melt-cure generation. 2) The save name and location is defined using the “save name” button. 3) If a standalone melt-curve is desired, it can be started using the “start program” button. This is unnecessary if the melt curve is collected after the real-time curve with the box checked.’ 4) Each melt curve image can be viewed using the viewer on the right.
Operation of the Analysis Software
Real-time experiments can be viewed using this page.
1) After an experiment is loaded using the “analyze real-time” tab the parameters used, temperature profile, and raw images can be viewed on this page.
Real-time analyses are performed using this page 1) 2) 3) 4) 5) 6) 7) 8)
Raw experiments are loaded using the “load raw” button Previously analyzed experiments are loaded using the “load analyzed” button After analyzing raw data, the progress can be saved using the “save analyzed” button A mask used for defining digital reaction locations can be made using the “make mask” button A previous mask can be loaded using the “load mask” button A report of the analysis can be generated using the “save report” button Raw data in different channels can be exported using the “export raw data” button Concentrations are automatically calculated after inputting the well volumes used in the “well volume” box and setting thresholds 9) Different real-time curves can be correlated to their location on the device as well as “hidden” using the section in the lower left 10) Parameters for baseline correcting, thresholding, and plotting the data are located above and below the plot
Akin to the real-time experiment tab, melt curve parameters are shown here after loading the raw data from the “analyze melt curve” tab
Melt curve experiments can be analyzed using this page 1) The buttons in the top left section of the page perform the same functions on the melt data as they performed on the real-time data. It is of note, that the same mask can be used for both datasets 2) Data smoothing can be performed using the parameters and algorithms defined in the section below the “export raw data” button 3) Peak detection and melt temperatures can be calclulated using the section below the data smoothing. It is of note, that if real-time anlaysis data is loaded into the program, it can be correlated with the melt temperature data using the “show only positive wells” button. This button only works if the same mask is used for both datasets 4) All other features are identical to the analyze real-time page.