Electronic Supplementary Material (ESI) for Dalton Transactions This journal is © The Royal Society of Chemistry 2012
SUPPORTING INFORMATION: Scrutinizing Negative Thermal Expansion in MOF-5 by Scattering Techniques and Ab Initio Calculations Nina Lock1, Mogens Christensen1, Yue Wu2, Vanessa K. Peterson3, Maja K. Thomsen1, Ross O. Piltz3, Anibal J. Ramirez-Cuesta4, Garry J. McIntyre3,5, Katarina Norén6, Ramzi Kutteh,3 Cameron J. Kepert2, Gordon J. Kearley3, Bo B. Iversen1*
1
Center for Materials Crystallography, Dept. of Chemistry and iNANO, Aarhus University, 8000 Aarhus C, Denmark 2
School of Chemistry, The University of Sydney, Sydney NSW 2006, Australia
3
Australian Nuclear Science and Technology Organisation, Lucas Heights NSW 2234, Australia
4
ISIS, Rutherford Appleton Laboratory, Oxfordshire, UK
5
Institut Laue-Langevin, 38042 Grenoble Cedex 9, France
6
MAX-lab, Lund University, SE-221 00 Lund, Sweden
*Corresponding author:
[email protected]
This material presents experimental details and supports data and conclusions given in the manuscript.
1
Electronic Supplementary Material (ESI) for Dalton Transactions This journal is © The Royal Society of Chemistry 2012
1. EKSPERIMENTAL DETAILS 1.1 Synthesis
Single crystals of cubic H-MOF-5 and D-MOF-5 with edge lengths up to 600 m were synthesized according to a previously reported procedure.1 The only difference between the syntheses of H-MOF-5 and D-MOF-5 was using protonated or deuterated precursors of terephthalic acid (C6H4(COOH)2 or C6D4(COOH)2, respectively). H-MOF-5 powders were used for powder X-ray diffraction, INS and EXAFS, whereas D-MOF-5 was used for powder- and single-crystal X-ray and neutron diffraction. We successfully scaled up the procedure to batch sizes of 200 mL. All chemicals were used as purchased. Zn(NO3)26H2O and terephthalic acid were dissolved in diethylformamide (DEF) in a molar ratio of 3:1. The mixture was heated from room temperature to 100C over 30 min. in either a sealed glass container or in a glass vial placed in a Teflon-lined stainless-steel autoclave. Crystals had formed after approximately 16 hours at 100C, and the hot DEF was replaced by dimethylformamide (DMF) in a nitrogen-filled glove bag. DMF was subsequently exchanged with chloroform in which the crystals were stored for at least 7 days prior to further handling aiming to exchange DMF in the pores with CHCl3. Due to the moisture sensitivity of MOF-5,2 dry crystals were handled and stored in a glove box or glove bag at all times. Crystals were submersed in CHCl 3 when handled outside the glove box or glove bag e.g. when mounting single crystals. 1.2 Powder X-Ray Diffraction (D-MOF-5 and H-MOF-5)
Multi-temperature synchrotron radiation powder X-ray diffraction (PXRD) data were collected at the 1-BM beam line at the Advanced Photon Source (APS), Argonne National Laboratory, USA on a sample of guest-free D-MOF-5 sealed under vacuum. The crystals were ground and loaded into a 0.3 mm capillary in an argon filled glove box. The capillary was evacuated under dynamic vacuum for 24 hours and subsequently flame sealed. PXRD data were measured on a MAR-345 image-plate detector using a wavelength of 0.62 Å, and the sample-to-detector distance was calibrated using a LaB6 standard. An Oxford Cryostream was used to control the sample temperature. The capillary was initially cooled to 100 K, and data were collected continuously while heating the sample at a rate of 120 K/hour (exposure time: 7.0 s/frame). The same setup was used to measure multi-temperature powder diffraction data on solvent-free H-MOF-5 in argon atmosphere at near-ambient pressure. These conditions correspond to the environment during the X-ray absorption spectroscopy data collection. In an argon-filled glove bag solvent-free H-MOF-5 powder was loaded into a Kapton capillary, which was mounted in a flow cell.3 The capillary was connected to an argon cylinder and kept at an overpressure of 0.7 bar during the experiment (exposure time: 12 s/frame). The program Fit2D was used to integrate around the powder rings in the 2-dimensional diffraction images.4 The temperature dependent unit-cell parameter was determined by Le Bail fitting of
2
Electronic Supplementary Material (ESI) for Dalton Transactions This journal is © The Royal Society of Chemistry 2012
the 1D projected data using the FullProf programme.5 The diffraction profiles were described using a Thomson-Cox-Hastings pseudo-Voigt profile function. 1.3 Powder Neutron Diffraction (D-MOF-5)
Powder neutron diffraction (PND) data were collected on guest-free D-MOF-5 under vacuum at variable temperatures on the high-resolution powder diffractometer ECHIDNA at the Australian Nuclear Science and Technology Organization (ANSTO). 0.5 g D-MOF-5 was coarsely ground in CHCl3 and loaded into a cylindrical vanadium can with an approximate inner diameter of 5 mm. The can was closed in an argonfilled glove bag, and a lead gasket sealed the can air tight. Subsequently, the can was evacuated through a Swagelok valve to remove CHCl3 from the crystal pores. The can was held under reduced pressure during the data collection. A wavelength of 1.88 Å was used to collect data in the angular range of 4-164° by moving the 128 3He detector bank in steps of 0.05°. Data were collected for 6-8 h at each temperature (20, 50, 100, 200, 300, and 400 K). The temperature was controlled by placing the sample in a closed-cycle refrigerator. The wavelength was calibrated using an Al2O3 standard, and the D-MOF-5 data were Rietveld refined using the FullProf software.5 The background was described by a third-degree polynomial, and the peak profiles were fitted with a pseudo-Voigt function with axial divergence. All atomic positions were refined, and an isotropic model was used to describe the atomic thermal vibration. Two asymmetry parameters were refined to describe the asymmetric line profiles at low angle, and two parameters were included in the model to compensate for a slight off-center position of the sample during the data collection. 1.4 Single Crystal X-Ray Diffraction (D-MOF-5)
A D-MOF-5 crystal with approximate dimensions of 0.5×0.5×0.6 mm3 was loaded into a CHCl3-filled glass capillary. The crystal was fixed to the bottom using glass wool. The capillary was evacuated for 24 h under dynamic vacuum and flame sealed. The same deuterated single crystal was used for both single crystal X-ray and neutron diffraction to exclude that differences between the X-ray and the neutron results are sample related. Variable-temperature single-crystal X-ray diffraction data were collected on a Bruker-Nonius APEX II diffractometer at The University of Sydney. A graphite monochromator selected the MoKα line from a rotating anode source (λ = 0.71 Å), and the diffracted beam intensities were collected on a CCD detector. A nitrogen cryostream from Oxford Cryosystems was used to control the temperature during data collection. Identical data sets with high redundancy were collected in the temperature range 100-300 K in 25 K intervals. The sample was not removed from the diffractometer between collections of the different data sets.
3
Electronic Supplementary Material (ESI) for Dalton Transactions This journal is © The Royal Society of Chemistry 2012
The intensities of the Bragg reflections were integrated using the program SAINT,6 and data were corrected for absorption (μl(MOF-5) = 1.12 mm-1) in SADABS.6 Structural solution and refinements were performed in SHELX-977 using the WinGX software package.8 All non-hydrogen atoms were refined with anisotropic atomic displacement parameters (ADPs) without any geometry constraints. The position and isotropic atomic displacement parameters of deuterium were calculated using the SHELX command HFIX. 1.5 Single-Crystal Neutron Diffraction (D-MOF-5)
The thermal-neutron Laue diffractometers VIVALDI9 at the Institut Laue-Langevin (ILL), France, and KOALA at ANSTO, Australia, were used to collect single-crystal neutron diffraction data on the D-MOF-5 crystal. The two instruments are nearly identical and are each equipped with a cylindrical image-plate detector. The diffractometers are placed at the end of thermal-neutron guides and the wavelength ranges are approximately 0.8-5.2 Å and 0.9-5.0 Å for VIVALDI and KOALA, respectively. A large volume of the reciprocal space is covered in a single exposure of the stationary crystal and a full data collection consists of just a few patterns, which differ by rotation of the crystal around the cylindrical-detector axis. The temperature was maintained by a He-flow Orange cryostat at ILL, whereas at ANSTO a closed-cycle refrigerator was used. On VIVALDI data were collected at 100 K (6 settings), 200 K (2 settings), and 300 K (3 settings); the crystal was removed from the cryostat when the room-temperature data set was collected. At KOALA the measurement temperatures were 4 K (11 settings), 20 K (11 settings), 50 K (19 settings), 100 K (20 settings) and 200 K (9 settings). It should be stressed that a porous crystal with a ~0.125 mm 3 volume is a weak neutron scatterer. Therefore, long counting times were needed (the total exposure time per temperature was 28 h or more). The main difference between VIVALDI and KOALA is differences in their wavelength spectra mainly as a consequence of different sources and guide systems. Furthermore, VIVALDI is situated at a guide, where a number of instruments are located upstream. In the case of KOALA only one instrument is found upstream and the monochromator of this instrument is placed so it does not interfere with the neutron spectra for KOALA. Also the data collection strategy was different; at KOALA many short collections were carried out, while at VIVALDI just a few angular settings with long exposures were used. Therefore, direct comparison of the data quality for the two instruments is not straightforward. Reflections measured at ILL were initially indexed, integrated, and wavelength normalized using Laue-diffraction software available at ILL including lauegen, argonne-boxes, and lauenorm.10, 11 The ANSTO data were processed similarly using upgraded versions of the ILL software,12 which were finally used to reprocess the VIVALDI data (as presented herein). The resulting hkl files were used for structural refinements in SHELX7 using the WinGX8 user interface. Determination of the unit-cell parameter is not
4
Electronic Supplementary Material (ESI) for Dalton Transactions This journal is © The Royal Society of Chemistry 2012
possible from single-crystal Laue diffraction data due to direct correlation between the unit-cell and wavelength. The unit-cell sizes determined from single-crystal X-ray diffraction were used for the VIVALDI data, whereas the unit-cell information extracted from powder neutron diffraction (PND) data covering the low-temperature region were used for the KOALA data analysis. The 4 K unit-cell was estimated by fitting a linear function to the PND data and extrapolation to 4 K; however, we have no evidence from these studies that NTE in MOF-5 follows a linear trend below 20 K. The interatomic distances and the sizes of the thermal ellipsoids at 4 K are therefore possibly slightly biased by the choice of unit-cell size. At 4 K and 20 K an isotropic description of Zn was used and the 4 K Uiso was fixed to a value estimated from linear interpolation of the Zn ADPs at higher temperatures. A free refinement of U(Zn) at 4 K resulted in an unphysical low value, pointing to some uncorrected systematic error in the data. Likewise, at 4 K one carbon atom (C1) was refined isotropically to obtain a stable refinement. 1.6 Extended X-Ray Absorption Fine Structure (H-MOF-5)
The experiment was carried out at MAX-lab in Lund, Sweden, at the wiggler beam line I811. EXAFS data were collected in transmission mode on the K-edge of zinc. A standard zinc foil was used as reference. Data were collected between 100 K and 300 K in 50 K intervals. The sample was cooled in an Oxford cryostat using liquid nitrogen; windows in the cryostat allowed optical access to the sample. An air-tight brass sample cell with Kapton windows, a 7 mm circular cross-section and a 1.5 mm thickness was designed for the purpose. MOF-5 powder from the same crystal batch as used for the INS experiment was filled into the sample cell in an argon glove box. Hence, the data were collected on MOF-5 at ambient argon pressure rather than on an evacuated sample like in the scattering experiments. Energy scans were collected at each temperature from 150 eV below to 650 eV above the absorption edge at 9.66 keV. The step size was 5 eV in the pre-edge region and 0.3 eV on the edge, while the EXAFS region of the spectrum was collected in energy steps corresponding to 0.05 Å-1 in k-space. The 100 K and 300 K spectra resolve features to approximately 12 Å-1 and 10 Å-1, respectively. The data were merged using the Athena software,13 while the remaining data processing was performed in WinXAS.14 Atomic scattering paths were generated by the Atoms15 and Feff16 codes using a 100 K MOF-5 crystallographic information file (CIF) based on the single-crystal X-ray diffraction results. The calculated scattering paths were used as starting model for the data refinement. The interatomic distance (R), vibrational parameter (2), zero-point energy offset (E0), and amplitude factor (S02) were refined for the first coordination shell (O1 and O2). The coordination number N was fixed to four as the sum of one O1 (in the Zn4O1 cluster) and three carboxylate O2 atoms with almost identical Zn-O bond distances. Fixing the coordination number is reasonable as the coordination number for Zn is known to be four in the MOF-5 crystal structure.
5
Electronic Supplementary Material (ESI) for Dalton Transactions This journal is © The Royal Society of Chemistry 2012
1.7 Inelastic Neutron Scattering (H-MOF-5)
INS data were collected on the TOSCA spectrometer (Thermal Original Spectrometer with Cylindrical Analyzers) at target station 1 (TS1) at the ISIS pulsed spallation source at Rutherford Appleton Laboratory, England. TOSCA is an inverted-geometry spectrometer. A white beam of neutrons are scattered from a sample, and the energies of the scattered neutrons are analyzed using time-of-flight (TOF). After scattering in the sample the neutrons with a specific fixed energy are reflected by graphite analyzers into the 3Hefilled detector tubes.17 The incident neutron energies are determined from the measured TOF, and the energy transfer to the sample is given by the difference between the incident energy and final energy selected by the graphite analyser.
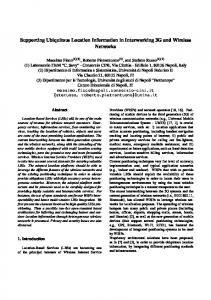
Figure S1. (a) Pulse pattern illustrating the normal operational mode of TOSCA. The slowest neutrons from each pulse (red and yellow) are cut off by operating a tail cutter chopper at a 50 Hz frequency. The fastest neutrons (violet, blue, and green) are scattered by the sample. The scattered neutrons form a white beam (illustrated as a color spectrum for the first and the last neutrons in a pulse and grey at all other times). The graphite (002) analyzer selects neutrons with a 3 certain energy (green), which are detected in He detectors. There is no spectral overlap between the pulses. (b) Data collection using a chopper frequency of 10 Hz. The chopper cuts off the low-energy neutrons from pulse A preventing a spectral overlap between pulse A and pulse B. The slowest neutrons are detected during the pulse break after B. Had there not been a break in the pulse pattern, there would have been frame overlap between B and the subsequent pulse. Due to overlap between the other three pulses in a ‘…11110…’ pulse sequence, only data from one in four neutron pulses were used.
To avoid time frame overlap a tail-cutting chopper is installed in front of the spectrometer. The tail cutter removes the slowest neutrons from the incident beam as they would be overtaken by the fast
6
Electronic Supplementary Material (ESI) for Dalton Transactions This journal is © The Royal Society of Chemistry 2012
neutrons from the next pulse before reaching the detector. Consequently, the slowest neutrons, which could potentially contribute to the low-energy-loss spectrum, are removed from each pulse when operating the tail cutter at 50 Hz (normal operational mode). In normal configuration, the lowest-energy-loss detectable is 3 meV. However, vibrational motions with energies lower than 3 meV play a crucial role for NTE in MOF-5 according to computational findings.18 Therefore, TOSCA was operated in a new configuration allowing access to the low-energy spectrum below 3 meV. The second target station built at ISIS (TS2) uses one fifth of the created neutron pulses from the 50 Hz accelerator resulting in the following pulse sequence for TS1: ‘…1111011110…’ (pulse=1, break=0) for TS1. Running the tail chopper at a frequency of 10 Hz removes the slow neutrons from every fifth pulse, say pulse A. Consequently, there is no spectral overlap between this pulse, and the subsequent pulse B. When the pulse break follows after pulse B, the scattered neutrons from the full pulse B (including the slow low-energy-loss neutrons) can be collected during the pulse break without any spectral overlap. Only the full pulse is used, while the other three pulses having spectral overlap are discarded (Figure S1). In an argon-filled glove box, 5.3 g of H-MOF-5 was loaded into a 6.0 cm long cylinder with inner and outer diameters of 1.5 and 1.7 cm, respectively. The can was mounted on a stick, and thermocouples and resistance heaters were attached to the sample can prior to placing it in a stationary closed-cycle refrigerator on TOSCA. INS data were collected under vacuum and at a helium pressure of 175 bar, both at 20 K and 100 K. Data were binned using a built-in function in the plotting program Origin to reduce noise in the data. 1.8 MD Simulations
MD simulations of one unit-cell of MOF-5 with cyclic boundary conditions were calculated to provide vibrational spectra for the guest-free framework using the program VASP.19 The program input was timeand position-averaged MOF-5 atomic coordinates (obtained by diffraction) described in P1 symmetry. Vibrations in the structure were studied over a time scale of 10 ps, which corresponds to a resolution of 0.25 meV (2 cm-1). As a result from the 10 ps simulation, 8800 snap-shots of the non-averaged structure were calculated. The gives a picture of the vibrational motions in the structure with a femtosecond time resolution. As a consequence of the 2 cm-1 resolution, structural vibrations with frequencies lower than 2 cm-1 were not observed in the simulation.
7
Electronic Supplementary Material (ESI) for Dalton Transactions This journal is © The Royal Society of Chemistry 2012
2. SUPPORTING RESULTS 2.1 Powder Neutron Diffraction
The D-MOF-5 PND data contain Bragg peaks with high intensities to very high angles. In Figure S2 is shown a Rietveld fit to the 20 K D-MOF-5 PND data (566 reflections). The data fit has an RF value of 5.9 %.
Figure S2. Powder neutron data collected on D-MOF-5 at 20 K. The intense low-angle peak was omitted from the data refinement (and this figure) due to pronounced asymmetry of the reflection.
The refined PND data of D-MOF-5 point to an apparent decrease of the Zn-O2 bonds with increasing temperature, but no clear evolution of the Zn-O1 bond length is observed (Table S1, see the atomic labels in the manuscript or in Figure S6). An overall contraction with increasing temperature is indicated across the zinc clusters as well as across the aromatic ring suggesting that both vibrations within the metal cluster and motion of the aromatic ring contribute to the NTE. The C1-C2 distance is suggested to increase with temperature, and the carbon-carbon distances in the aromatic ring decrease to unphysical low values. The PND data refinement should only be considered a guideline for structural changes as a function of temperature. Comprehensive investigations were carried out using single-crystal diffraction experiments, which determines interatomic distances and atomic displacement parameters (ADPs) with higher accuracy. Selected Bond Distances in D-MOF-5 20 K
50 K
100 K
200 K
300 K
400 K
d(Zn-O1) (Å) d(Zn-O2) (Å)
2.05(1) 1.87(4)
2.06(1) 1.87(4)
2.07(1) 1.85(4)
2.08(1) 1.84(4)
2.06(1) 1.79(4)
2.01(1) 1.76(4)
d(C1-C2) (Å) d(C2-C3) (Å)
1.53(1) 1.43(1)
1.51(1) 1.42(1)
1.56(1) 1.36(1)
1.59(1) 1.28(1)
1.67(1) 1.17(1)
1.76(1) 1.03(1)
Table S1. Selected bond distances for D-MOF-5 determined by powder neutron diffraction.
8
Electronic Supplementary Material (ESI) for Dalton Transactions This journal is © The Royal Society of Chemistry 2012
2.2 Single-Crystal Diffraction
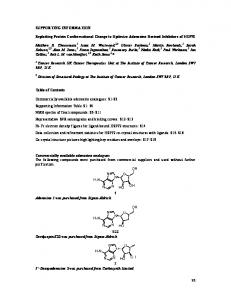
In diffraction experiments the coordinates (and hence interatomic distances) of atoms vibrating about their mean positions, , are averaged over time and space when determined by diffraction methods. It is important to distinguish between the true bond length and the apparent bond length. Diffraction methods determine the distance between two atoms as the distance between mean positions of the involved atoms - = , that is, the apparent distance.20 The true or physical bond length is the distance , which is always longer than the apparent bond length. Figure S3 shows that diffraction based techniques (powder and single crystal) suggest that both the M-X bond length and the M-M’ interatomic distance decrease with increasing population of the transverse vibration. Analogously to bond distances, the apparent and the true bond angles may be different due to averaging.
Figure S3. (a) Three snapshots of a transverse vibration at the times t1, t2, and t3. The instant atomic positions r1 and r2 and the true bond length r2-r1 is indicated at time t1; these parameters are defined analogously for t2 and t3. (b) The time and position averaged picture of the transverse vibration as observed by diffraction. The apparent distance - is shorter than the true M-X bond distance. The larger the vibrational amplitude, the smaller the apparent distance i.e. the average next-neighbor distance decreases with increasing thermal population of the transverse vibration. M and M’ are metal atoms linked by the bridge X.
Different weighting schemes and data resolutions were tested for the single-crystal diffraction data; however, these do not deviate. The results presented herein correspond to applying the default data weight (WGHT) parameter of 0.1 for the KOALA data and a 0.026 weight for the VIVALDI data. Figure S4 shows an example of changing the data resolution of the 50 K KOALA data. Even though small differences are observed by changing the resolution, most differences are within errors of the refinement, and the choice of resolution for the neutron data does not change any of the conclusions drawn in the manuscript.
9
Electronic Supplementary Material (ESI) for Dalton Transactions This journal is © The Royal Society of Chemistry 2012
Figure S4. MOF-5 structures from KOALA data at 50 K with different data resolutions are shown (50% probability ellipsoids). (a) (sin/)max=0.50, the number of reflections (merged) used in the refinement is 390, and the R-values R1a/R1b=6.65%/13.0%, where R1=Fobs-Fcalc/Fobs; a: Fobs > 4(Fobs); b: all data. (b) (sin/)max=0.59, the number of reflections (merged) used in the refinement is 606, and the R-values R1a/R1b = 7.73%/19.3%. The larger Rvalues are due to including a larger number of weak high-order reflections in the refinements.
10
Electronic Supplementary Material (ESI) for Dalton Transactions This journal is © The Royal Society of Chemistry 2012
Table S2 shows details for the highly redundant single-crystal diffraction data as they are presented in this paper. Reasonable R-values were obtained for the X-ray and neutron refinements. Laue data often results in higher R-values than those obtained by refinement of monochromatic data. Different data collection strategies and exposure times were used for the VIVALDI and KOALA experiments (see the experimental section herein). Therefore, direct comparison of the 100 and 200 K data from the two instruments is not possible. Single-Crystal Diffraction Data T (K)
a (Å)
(sin/)max (Å-1)
Measured refl.
Unique Refl.
R1a (%)
R1b (%)
X-ray diffraction
100 125 150 175 200 225 250 275 300
25.8941(1) 25.8925(1) 25.8862(1) 25.8856(1) 25.8710(2) 25.8660(2) 25.8557(1) 25.8503(1) 25.8340(1)
0.91 0.91 0.92 0.92 0.91 0.91 0.88 0.88 0.88
38536 38514 38569 38515 38405 38092 37512 37465 37420
2721 2721 2742 2743 2740 2660 2469 2462 2458
3.05 3.09 3.18 3.42 3.58 3.60 3.79 4.01 4.00
5.78 6.20 6.68 7.16 7.64 7.86 7.91 8.62 8.73
Neutron diffraction KOALA
4 20 50 100 200
-----------
0.50 0.50 0.50 0.45 0.41
17782 18970 31018 24058 8531
379 389 390 298 234
9.97 7.11 6.65 6.44 6.86
15.4 13.2 13.0 11.8 15.9
Neutron diffraction VIVALDI
100 200 300
-------
0.59 0.59 0.53
17223 5792 5981
615 595 444
8.05 14.7 8.80
17.5 32.1 22.9
R1=Fobs-Fcalc/Fobs; a: Fobs > 4(Fobs); b: all data Table S2. The table gives a summary of the single-crystal X-ray and neutron diffraction data. For the neutron data, the number of reflections corresponds to the number of reflections extracted within the resolution limit chosen for the data extraction. The unit-cell parameters were not determined by single-crystal Laue diffraction.
Table S3 shows the result of the Hirshfeld rigid-body test21 of the single-crystal X-ray and neutron diffraction data. The test was performed using the program PLATON.22 The rigid-body test implies that the differences between the mean-square displacements of the bonding atoms U in the direction of the bonds should attain low values (less than ~0.001 Å2) for the ADPs to be considered physically realistic.23 For the X-ray data most bonds pass the Hirshfeld test, and only the C1-O2 distance has slightly higher values at 200 K and 225 K. For the neutron data, in contrast, almost all bonds have U values above 0.001 Å2, and this suggests somewhat limited reliability of the neutron ADPs. However, it should be remembered that the 11
Electronic Supplementary Material (ESI) for Dalton Transactions This journal is © The Royal Society of Chemistry 2012
present study was highly challenging since it was performed on a small porous crystal using a white neutron beam. This is touching the limit of what is currently possible by neutron diffraction. Therefore, the data quality is not expected to be comparable with bench-mark studies. For C1-C2 and C2-C3 at low temperatures the U values are some of the lowest observed for the neutron data. The ADPs for these atoms have been used to suggest the relative energies of different vibrational motions in the structure (see manuscript). A statistical analysis of the ADPs for all atoms except hydrogen was carried out in the program UIJXN to compare the 100 K X-ray and neutron data24 (Table S4). Hirshfeld Rigid-Body Test of Single-Crystal Diffraction Data T (K)
(UZn-O1) (Å2)
(UZn-O2) (Å2)
(UC1-O2) (Å2)
(UC1-C2) (Å2)
(UC2-C3) (Å2)
X-ray diffraction
100 125 150 175 200 225 250 275 300
0.00056 0.00054 0.00030 0.00082 0.00085 0.00014 0.00053 0.00018 0.00049
0.00086 0.00063 0.00078 0.00084 0.00008 0.00029 0.00019 0.00054 0.00058
0.00103 0.00080 0.00068 0.00087 0.00183 0.00208 0.00110 0.00033 0.00082
0.00025 0.00000 0.00090 0.00068 0.00016 0.00000 0.00034 0.00107 0.00132
0.00073 0.00054 0.00006 0.00004 0.00009 0.00051 0.00114 0.00072 0.00060
Neutron diffraction KOALA
4 20 50 100 200
Zn isotropic Zn isotropic 0.00274 0.00947 0.01381
Zn isotropic Zn isotropic 0.00148 0.00812 0.00206
C1 isotropic 0.00530 0.00279 0.00653 0.00299
C1 isotropic 0.00869 0.00349 0.01865 0.00258
0.00072 0.00306 0.00745 0.01194 0.00841
Neutron diffraction VIVALDI
100 200 300
0.00933 0.00748 0.00797
0.00150 0.00352 0.01484
0.00668 0.01012 0.00740
0.00537 0.00094 0.01163
0.00318 0.00932 0.00378
Table S3. Rigid-Body test of single-crystal diffraction data.
UIJXN Test of Single Crystal Diffraction Data
(Å2)
Urms/(U)
KOALA (100 K) VIVALDI (100 K)
0.0048(27) 0.0024(17)
1.61 1.97
1.22(58) 1.07(19)
Table S4. Results of the UIJXN test. The first column shows the values of the mean ratio between all Uii. The second column gives the average difference between X-ray and neutron data for 29 Uijs corresponding to all 6 Uijs for each atom, which are not 0 due to symmetry reasons. The third column shows the root-mean-square (rms) difference divided by the error on U.
12
Electronic Supplementary Material (ESI) for Dalton Transactions This journal is © The Royal Society of Chemistry 2012
Figure S5 shows neutron ADPs plotted against the corresponding X-ray ADPs.
Figure S5. 100 K Uii(neutron), left: KOALA, right: VIVALDI, are plotted as a function of Uii(X-ray) (Uii = U11(Zn), U11(O1), U11(O2), U33(O2), U11(C1), U33(C1), U11(C2), U33(C2), U11(C3), and U33(C3)).
Figure S6 displays temperature-dependent atomic displacement parameters based on single-crystal diffraction data. There is a general agreement that the out-of-plane thermal vibrations are larger than the in-plane components in agreement with previous studies,1 and the agreement between all 100 K data is good.
13
Electronic Supplementary Material (ESI) for Dalton Transactions This journal is © The Royal Society of Chemistry 2012
Figure S6. 50% probability thermal ellipsoids are displayed for all single-crystal neutron data and for selected single-crystal X-ray diffraction data.
14
Electronic Supplementary Material (ESI) for Dalton Transactions This journal is © The Royal Society of Chemistry 2012
Plots of temperature dependent atomic displacement parameters based on single-crystal diffraction data are shown in Figure S7. The atomic labeling is shown in Figure S6. There is an overall good agreement between the atomic displacement parameters (ADPs) obtained from the different experiments. In combination, the X-ray, KOALA and VIVALDI ADPs uniformly contribute to a picture of the NTE mechanism. However, there are differences between the neutron data and X-ray data e.g. the neutron data at low temperature point to larger dU/dT than the X-ray data.
Figure S7. Atomic displacement parameters (single-crystal X-ray and neutron diffraction). Note: different scales are used for the different plots to highlight details.
The different dU/dT slopes may be explained by absorption effects. The neutron data were not absorption corrected, while a spherical correction was applied to the X-ray data. The MOF-5 crystal with a calculated pore volume fraction of 79% is a weak absorber, so serious absorption effects for the crystal alone are
15
Electronic Supplementary Material (ESI) for Dalton Transactions This journal is © The Royal Society of Chemistry 2012
considered unlikely. However, in addition to the crystal, the glass capillary and glass wool also contribute to the absorption. Selected interatomic distances based on single-crystal diffraction data are shown in Figure S8. The atomic labeling is shown in Figure S6. Plots of other interatomic distances are found in the manuscript (Figure 6). Information on the metal-center geometry is based on the X-ray data alone due to the high X-ray scattering power of zinc.
Figure S8. Interatomic distances based on single-crystal X-ray and neutron diffraction data. The Zn-O distances are based on Xray data alone.
2.3 Extended X-Ray Absorption Spectroscopy
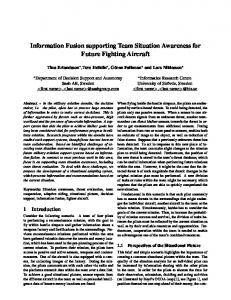
Figure S9a shows an example of the EXAFS raw data (100 K). Figure S9b and S9c show the isolated EXAFS signal corresponding to the two inner coordination shells, and the Fourier transformation of this
16
Electronic Supplementary Material (ESI) for Dalton Transactions This journal is © The Royal Society of Chemistry 2012
signal. The starting model for the refinement was atomic scattering paths generated from a 100 K MOF-5 crystallographic information file (CIF) from our single-crystal X-ray diffraction. The inner shell consists of contributions from the Zn-O1 (coordination number 1) and Zn-O2 (coordination number 3) scattering paths. These two bond lengths were fitted as one distance with fixed coordination number 4. The second peak consists of several scattering contributions, whose atomic scattering paths and spectral weights are listed in Table S5. Due to potential correlation between parameters by introducing several scattering paths, only the first coordination shell was used for data refinement. One Zn-O distance (d(Zn-O)), one vibrational parameter (2), the energy shift (E0), and as a last parameter the amplitude factor (S02) were refined, while keeping the coordination number (N) fixed to four. F-tests were performed in WinXAS14 after the refinements to check for correlations between the refined parameters. All parameters were found to be independent at all temperatures.
Figure S9. (a) 100 K merged raw data of MOF-5. (b) The EXAFS signal corresponding to the first two coordination shells, to which several scattering paths contribute. (c) Fourier transform of the EXAFS spectrum in (b). The distances in (c) are not phase corrected and are therefore shorter than the actual distances.
The Zn-O bond length increases linearly with temperature for the data at 200, 250 and 300 K data points. There are three arguments for disregarding the obtained data at 100 and 150 K (see manuscript Figure 7): (1) A linear extrapolation of the 200-300 K d(Zn-O) to 100 K, gives a bond distance of 1.944(1) Å at 100 K. This bond length corresponds exactly to the Zn-O2 distance determined by X-ray diffraction at 100 K (Figure S8). The agreement gives confidence that the EXAFS d(Zn-O) at 200-300 K are reliable. The 100 K diffraction and EXAFS distances are not expected to be exactly identical as Bragg averaging of the diffraction data also occurs at 100 K. However, the difference between the EXAFS and diffraction d(Zn-O) at low temperature is expected to be substantially smaller than at higher temperatures due less pronounced thermal vibration. Consequently, the diffraction and EXAFS d(Zn-O) are expected to be similar. (2) The
17
Electronic Supplementary Material (ESI) for Dalton Transactions This journal is © The Royal Society of Chemistry 2012
reliability of the 200-300 K data are supported by the 2 parameter, which shows a linear trend, and extrapolation to 0 K gives a mean-square displacement of 0.0014(2) Å2. This value is reasonable, even though thermal vibration is not exactly linear at very low temperatures.25 (3) The R-values also confirms better refinements for the three high-temperature data sets with significantly lower values of 1.4% (200 K), 1.6% (250 K), and 1.7% (300 K) compared to the low-temperature data refinements for which R-values of 2.4% (100 K) and 3.9% (150 K) were obtained. Scattering Paths Path
Deg.
Ratio (%)
n-leg
Reff (Å)
Zna-O1
1
100.0
2
1.93
Zna-O2a
3
100.0
2
1.95
Zna-C1a Zna-C1a-O2a Zna-Znb Zna-O2a-C1a-O2a
3 6 3 3
33.2 37.4 33.8 13.7
2 3 2 4
2.93 3.08 3.15 3.22
Zna-O2b Zna-Znb-O1 Zna-O2a-O2b Zna-O2a-O1
3 6 6 6
28.7 7.2 7.3 9.2
2 3 3 3
3.30 3.50 3.52 3.55
Table S5. Scattering paths contributing to the first and second shells for Zna as absorber. The degeneration (Deg.) is the number of equivalent scattering paths and corresponds to the coordination number for single scattering events. ‘Ratio’ is the amplitude ratio with respect to the first path i.e. the probability for the scattering event to occur in comparison with the first path. ‘n-leg’ is the number of atoms in the path, and ‘Reff’ is the effective path length, that is, half of the scattering-loop length, which for single scattering is equivalent to the interatomic distance. The 2-leg scattering paths are shown in grey. The top right figure shows two Fourier-filtered peaks (red line) and the positions of the contributing paths (green lines). The data are not phase corrected; therefore the tabulated Reff values and the abscissa are not directly comparable. The bottom-left figure is a section of the MOF-5 structure with atomic labels.
18
Electronic Supplementary Material (ESI) for Dalton Transactions This journal is © The Royal Society of Chemistry 2012
2.4 Inelastic Neutron Scattering and Molecular-Dynamics Simulations
The most distinct features in the INS spectra collected at TOSCA, ISIS, appear below 150 meV. A spectrum is shown for the 20 K/vacuum data in the spectral range 0-150 meV in Figure S10.
Figure S10. The 0-150 meV range of the collected INS spectrum for the 20 K/vacuum sample.
The effect of temperature and pressure on MOF-5 phonons in the intermediate-energy region 25-60 meV is shown in Figure S11.
Figure S11. INS spectra of MOF-5 in the intermediate-energy interval 25-60 meV. (a) MOF-5 under vacuum at 20 K (blue line) and 100 K (red line), (b) MOF-5 at 175 bar He pressure at 20 K (dark red line) and 100 K (dark-blue line). Figure S11a corresponds to Figure 8 in the manuscript.
The energies of three spectral lines of approximately 46, 50 and 57 meV were determined by fitting with a Gaussian function (Table S6). The pressure and temperature effects on the spectral-line position in this energy region are negligible.
19
Electronic Supplementary Material (ESI) for Dalton Transactions This journal is © The Royal Society of Chemistry 2012
Vibrational Frequencies E(peak45)/meV 20 K vacuum 45.5(1) 20 K 175 bar 45.5(1) 100 K vacuum 45.4(1) 100 K 175 bar 45.5(1)
E(peak50)/meV 50.2(1) 50.4(1) 50.2(1) 50.4(1)
E(peak57)/meV 56.7(1) 56.8(1) 56.6(1) 56.7(1)
Table S6. Energy of three intense spectral lines in the intermediate-energy range as determined by Gaussian fitting.
Calculated vibrational spectra for one unit-cell of MOF-5 with circular boundary conditions are compared with the experimental INS data at 20 K and 100 K in Figure S12. There is a good agreement between the modeling results and the INS data (see further discussion in the manuscript).
Figure S12. Low-energy INS data are shown along with spectra calculated from the MD simulations at (a) 20 K (INS data: blue line, MD simulation: black line) and (b) 100 K (INS data: red line, MD simulation: black line). The data shown in Figure S12b are also shown in the manuscript Figure 10a.
Anisotropic atomic displacement parameters were obtained from the 30 K MD simulation for the structure (one unit-cell, Zn32O18(C148C248C396O296H96) in P1 symmetry. Due to this choice of space group no symmetry restrictions apply to the ADPs, i.e. U11, U22, and U33 attain different values for all atoms. The isotropic thermal parameter, Uiso, was calculated for all atoms and histograms for the Uiso parameters are shown in Figure S13. The distributions for O2, C1, C2, C3, and H appear to be log-normal. The vertical red line shows the average value and the vertical blue lines show estimated Uiso values extracted from the KOALA data.
20
Electronic Supplementary Material (ESI) for Dalton Transactions This journal is © The Royal Society of Chemistry 2012
Figure S13. Histograms of Uiso obtained from MD simulations in P1 symmetry. The red line is the average value of the MD Uiso values. The blue line is the Uiso value estimated from neutron diffraction. Note the different scales on the abscissa. The -3 2 -3 2 -3 2 -3 2 interval size is 0.210 Å for Zn and O1, 1.010 Å for C1 and C2, 2.010 Å for O2 and C3, and 5.010 Å for D.
The experimental 30 K ADPs were estimated by fitting a linear curve to the 20 K and 50 K U11 and U33 parameters. Subsequently, the 30 K values were calculated from these linear curves. Figure S13 shows that
21
Electronic Supplementary Material (ESI) for Dalton Transactions This journal is © The Royal Society of Chemistry 2012
the ADPs obtained from MD simulations are lower than all the experimental values. However, it is important to note that MD never reaches all low-frequency translational motions, so the contributions of these motions to the ADPs are missing. The ADPs are inversely proportional to the frequency squared, and the low-frequency phonons therefore contribute significantly. This may explain for the difference between the calculated and the experimental values. Overall, the agreement between the MD simulations and experimental data is therefore quite good. Examination of the benzene position relative to a plane perpendicular to the OZn4-C6-OZn4 direction (see also manuscript Figure 11) at 30 K shows that benzene predominantly remains on the +z-y side of linear within the time frame of the simulation (Figure S14). The coordinate system refers to the P1 unit-cell of MOF-5. Such population reflects a BDC linker motion which is not harmonic. For comparison, the 100 K simulation shows that the benzene does indeed transit across linearly, but that its residence is highly bimodal in nature, and not harmonic either (Figure S14). The displacement of the aromatic ring from linear appears large in comparison with the ADPs at 30 K and 100 K (Figure S7 and S13).
Figure S14. Analysis of motion groups from the 30 K MD simulation. The benzene position relative to a plane perpendicular to the O1Zn4-C6-O1Zn4 direction.
22
Electronic Supplementary Material (ESI) for Dalton Transactions This journal is © The Royal Society of Chemistry 2012
REFERENCES 1 N. Lock, Y. Wu, M. Christensen, L. J. Cameron, V. K. Peterson, A. J. Bridgeman, C. J. Kepert and B. B. Iversen, J. Phys. Chem. C, 2010, 114, 16181. 2 J. A. Greathouse and M. D. Allendorf, J. Am. Chem. Soc., 2006, 128, 10678. 3 P. J. Chupas, K. W. Chapman, C. Kurtz, J. C. Hanson, P. L. Lee and C. P. Grey, J. Appl. Cryst., 2008, 41, 822. 4 A. P. Hammersley, S. O. Svensson, M. Hanfland, A. N. Fitch and D. Hausermann, High Press. Res., 1996, 14, 235. 5 J. Rodriguez-Carvajal, Physica B, 1993, 192, 55. 6 Bruker AXS Inc., APEXII v2.1-4, SAINT v7.34A and SADABS 2004/1, Madison, WI, USA. 7 G. M. Sheldrick, Acta Cryst. A, 2008, A64, 112. 8 L. J. Farrugia, J. Appl. Cryst., 1999, 32, 837. 9 G. J. McIntyre, M.-H. Lemée-Cailleau and C. Wilkinson, Physica B, 2006, 385-386, 1055. 10 J. W. Campbell, Q. Hao, M. M. Harding, N. D. Nguti and C. Wilkinson, J. Appl. Cryst., 1998, 31, 496. 11 C. Wilkinson, H. W. Khamis, R. F. D. Stansfield and G. J. McIntyre, J. Appl. Cryst., 1988, 21, 471. 12 R. Piltz, Acta Cryst., 2011, A67, C155. 13 B. Ravel and M. Newville, J. Synchrotron Rad., 2005, 12, 537. 14 T. Ressler, J. Synchrotron Rad., 1998, 5, 118. 15 B. Ravel, J. Synchrotron Rad., 2001, 8, 314. 16 J. J. Rehr and R. C. Albers, Rev. Mod. Phys., 2000, 72, 621. 17 D. Colognesi, M. Celli, F. Cilloco, R. J. Newport, S. F. Parker, V. Rossi-Albertini, F. Sacchetti, J. Tomkinson and M. Zoppi, Appl. Phys. A, 2002, 74, S64. 18 W. Zhou, H. Wu, T. Yildirim, J. R. Simpson and A. R. Hight Walker, Phys. Rev. B, 2008, 78, 054114. 19 G. Kresse and J. Furthmüller, Phys. Rev. B, 1996, 54, 11169. 20 G. D. Barrera, J. A. O. Bruno, T. H. K. Barron and N. L. Allan, J. Phys.: Condens. Matter., 2005, 17, R217. 21 F. L. Hirshfeld, Acta Cryst. A, 1976, A32, 239. 22 A. L. Spek, Acta Cryst. D, 2009, D65, 148. 23 A. Ø. Madsen, S. Mason and S. Larsen, Acta Cryst. B, 2003, B59, 653. 24 R. H. Blessing, Acta Cryst. B, 1995, B51, 816. 25 B. T. M. Willis and A. W. Pryor, Thermal Vibrations in Crystallography, Cambridge University Press, 1975.
23