Computers in Human Behavior Computers in Human Behavior 23 (2007) 1072–1088 www.elsevier.com/locate/comphumbeh
Supporting interactive argumentation: Influence of representational tools on discussing a wicked problem Lisette Munneke *, Jerry Andriessen, Gellof Kanselaar, Paul Kirschner Research Centre Learning in Interaction, Utrecht University, P.O. Box 80140, 3508 TC Utrecht, The Netherlands Available online 21 November 2006
Abstract This study describes difficulties students can encounter when discussing a wicked problem and in what way two different representational tools can support interactive argumentation between students. About 55 pairs discussed in chat and wrote about genetically modified organisms in a groupware environment, supported by a text-outline or an argumentative diagram. The expectation was that students who were constructing a diagram would argue in a more thorough way, which is called the broadening and deepening in the space of debate. The expectations were partially confirmed. Diagrams help students to argue in a more thorough way, but only in the diagrams itself and not, as expected, in the discussion. This article shows the difficulties of supporting interactive argumentation with representational tools, because of the great amount of other variables in task and learning environment that effect the way students broaden and deepen an argument. Ó 2006 Elsevier Ltd. All rights reserved. Keywords: Interactive argumentation; Computer-supported collaborative learning; Representational tools; Argumentative tasks
1. Introduction The status of argumentation for learning can currently be described as controversial. On the one hand, research has shown that people reason better and make more progress *
Corresponding author. E-mail address:
[email protected] (L. Munneke).
0747-5632/$ - see front matter Ó 2006 Elsevier Ltd. All rights reserved. doi:10.1016/j.chb.2006.10.003
L. Munneke et al. / Computers in Human Behavior 23 (2007) 1072–1088
1073
in the construction of knowledge when they argue collaboratively (e.g., Billig, 1987; Leita˜o, 2000; Pontecorvo & Girardet, 1993; Voss & Means, 1991). Main idea is that students can mutually consider different sides and viewpoints about a topic, question each other, and clarify and explain issues. In this way they achieve a broader and deeper understanding of the topic being debated (e.g., Baker, 2003; Petraglia, 1998). On the other hand, it is quite possible that arguing does not lead to more understanding of the issue, for example when people stick to their own viewpoints, or do not advance very strong arguments (Andriessen, 2006; Kuhn, 1991). Next to this Veerman (2000) found that the relationships between argumentation and collaborative learning processes are neither simple nor predictable and thorough consideration of task characteristics and learning tools is necessary to provoke and support argumentation in the context of collaborative learning. This article is concerned with the question in which way argumentation during collaborative learning can be supported by different tools in a computer-supported collaborative learning (CSCL) environment in such a way that people really explore a complex issue and achieve a broader and deeper understanding of the topic at stake. 1.1. Interactive argumentation: broadening and deepening in the space of debate In formal models, argumentation basically is seen as dialectical. Opponents attempt to establish the validity of two positions by convincing each other and trying to win points in the debate (Stein & Albro, 2001). Contrary to this approach, Chinn and Anderson (1998) define the aim of argumentative discourse in a collaborative learning situation as collective searching for reasons and evidence for different positions in the form of a conversation. They call this kind of argumentative discourse interactive argumentation. Following Chinn and Anderson interactive argumentation is defined in this article as at least two participants engaging in an argumentative discussion, whereby participants more or less equally contribute reasons and evidence for different viewpoints in order to build up a shared understanding of the issue of stake. Leita˜o (2000) describes interactive argumentation as having a potential to set of processes of knowledge building and distinguishes two important argumentative processes that can promote learning, namely the justification of claims and counter argumentation. Theoretically, Baker (2003) compares the justification of claims to cognitive processes related to learning such as elaboration and self-explaining. Counter argumentation of opponents can stimulate participants in discussions to examine their views more thoroughly and rethink their initial arguments. Looking for quantitative measurements of the way students elaborate, explain and examine topics during interactive argumentation Chinn and Anderson (1998) propose, among other things, to measure breadth and depth of the conversations. They describe breadth as the extensiveness of the argument or discussion, the number of different positions people consider and the number of distinct individual arguments advanced for and against these positions. Depth is described as how extensively people elaborate distinct individual arguments. In this research these processes are called the broadening and deepening in the space of debate. (Munneke, 2002). Trying to grasp the macrostructure of interactive argumentation with the measurement of the breadth and depth, rises the question in what way the microstructure of interactive argumentation can be analysed. Because of the focus on the interactions, argumentation analysis cannot simply be carried out on the basis of established frameworks like Toulmin’s model (1958). This model is the most frequently applied model for analyzing argu-
1074
L. Munneke et al. / Computers in Human Behavior 23 (2007) 1072–1088
mentative elements and consists of six basic concepts: data, claim, warrant, backing, qualifier, and rebuttal. Leita˜o (2000), however, argues that the model concentrates on describing the side of the proponent and assigns only a minor role to the opponent. The model becomes problematic when studying interactive argumentation as a learning process in which opponent and proponent are equally important and interdependent because it does not take into account the dialogical nature of interactive argumentation. Along with this, Kirschner, Van Bruggen, and Duffy (2003) argue that the ontology of the problem being argued is critical for determining both the method of support for and the method of analysis of the argumentation. A design problem is radically different from an empirically solvable problem and thus requires different argumentation elements and thus different argumentation categories for their analysis. In her book on the skills of argument Kuhn (1991) focuses on specific argumentative skills instead of Toulmin’s (1958) basic concepts. In her opinion this skill approach makes it possible to study argument as thinking. She proposes five elementary skills of argument which entail the ability of reasoning namely, (1) the skill to offer causal theories which support claims (supportive theories), (2) the skill to offer arguments for supportive theories, which is called generating evidence, (3) the skill to generate alternative theories, that might be held by opponents, (4) the skill to envision conditions that would contrast with a supportive theory, which are called counterarguments, and (5) the skill to rebut an opposing line of reasoning, which is expressed in giving rebuttals to alternative theories or counterarguments. This study uses these skills as basic argumentative elements in analysis. Fig. 1 shows the way this research models interactive argumentation. The model consists of the different skills Kuhn (1991) distinguishes and the possible sequences in interactive argumentation. Broadening the space of debate can be seen in Fig. 1 as giving many theories to support or oppose a claim (i.e., a vertical slice of the figure). Deepening the space of debate can be seen as elaborating and supporting theories with evidence, giving
Fig. 1. Skills of argument: broadening and deepening in the space of debate.
L. Munneke et al. / Computers in Human Behavior 23 (2007) 1072–1088
1075
counter arguments for supportive theories and oppose the counter arguments and alternative theories with rebuttals (i.e., a horizontal slice of the figure). The further people travel in a sequence the deeper the exploration of the space of debate. This study tries to determine if students broaden and deepen the space of debate in different ways when using supporting tools in a CSCL environment. 1.2. Difficulties in interactive argumentation Although the assertion of this study is that argumentation leads to broadening and deepening in the space of debate by stimulating cognitive processes like elaboration, self-explaining, and rethinking concepts, several studies by Kuhn and colleagues (Felton & Kuhn, 2001; Kuhn, 1991; Kuhn & Udell, 2003) show the difficulties that people have in arguing. Kuhn studied the way people reason when they are asked to generate opinions and arguments about topics that are important for their own lives (e.g., causes of criminal recidivism or children’s school failure). She encountered three problems. The first problem was related to the level of informal reasoning, namely that people take the correctness of their supportive theories for granted. The second was that most evidence given is not really evidence, but rather pseudo evidence, examples and descriptions that elaborate a theory, instead of genuine evidence that really supports a theory. Finally, she noted that thinking about alternative theories, counterarguments for supportive theories, and rebuttals is very difficult. In later studies on the development of argumentative skills in childhood and adolescent years (Felton & Kuhn, 2001; Kuhn & Udell, 2003), the results showed the same picture. Students easily generate supportive theories and pseudo evidence; but alternative theories, counterarguments, and telling why the other is wrong by giving rebuttals was very difficult for them. These findings are in line with the findings of other researchers (e.g., Bennet & Dunne, 1991; Chan, 2001; Hightower & Sayeed, 1995) and point to the necessity of taking the way people argue into account, when designing tasks and tools to provoke broad and deep interactive argumentation. Collaborative tasks and tools for argumentation need certain characteristics to support justifying along with opposing of arguments and to stimulate students towards real engagement in the discussion. 1.3. Supporting interactive argumentation In a review of different software for interactive argumentation, Veerman and TreasureJones (1999) describe several task characteristics and ways to structure the interaction between people that appear to provoke and support argumentation. First, it seems important to offer a task in which multiple acceptable solutions exist. Serious argumentation can only emerge when serious problems are encountered. In this context Van Bruggen, Boshuizen, and Kirschner (2003) after Rittel and Webber (1973) talk about wicked problems. Wicked problems are a subset of ill-structured problems with two unique features. First, wicked problems have no right or wrong solutions that can be tested and revised. Second, they are problems which have many stakeholders who have their own views on both the problem and the solutions. These two features distinguish arguing about a wicked problem from arguing about a more structured or even a traditional ill-structured problem. Second, Veerman and Treasure-Jones (1999) recommend asking students to produce an individual or a joint product as the goal of a discussion to motivate them to evaluate argu-
1076
L. Munneke et al. / Computers in Human Behavior 23 (2007) 1072–1088
ments in a thorough way. Because writing tasks can deepen students’ knowledge and understanding many research ask students to write an essay as final product. (e.g., Erkens, Prangsma, Jaspers, & Kanselaar, 2002; Reznitkskaya et al., 2001; Schwarz, Neuman, Gil, & Ilya, 2003). Third, Veerman and Treasure-Jones (1999) stress the importance of instructions that encourage students to be critical, use multiple perspectives, and be elaborative. They recommend an individual work-stage in which students construct or explicate their own stance or solution along with splitting the information required for carrying out the task between group members to stimulate positive interdependence. Finally, Veerman and Treasure-Jones (1999) suggest to structure argumentative interaction by providing representational tools in a CSCL environment. Several researchers tried to support interactive argumentation with representational tools such as Belve´de`re (Paolucci, Suthers, & Weiner, 1995), SenseMaker (Bell, 2004), Drew (Baker, Quignard, Lund, & Se´journe´, 2003), pro–con tables (Schwarz et al., 2003), and matrices (Suthers & Hundhausen, 2003). Most of these representational tools are integrated in CSCL environments where students communicate through chat. The main reason for using these tools is that they make thinking and arguing visible and thus could stimulate the collaborative exchange of ideas (Bell, 2004; Van Bruggen et al., 2003). They can force students to make their claims and arguments explicit and promote students consideration of all the evidence, because it becomes salient when units are missing or are in contrast (Suthers & Hundhausen, 2003). However, the precise ways in which representations actually support interactive argumentation, depend on the format they use to display information and the representational notations (Suthers & Hundhausen, 2003; Van Bruggen et al., 2003). So, representations with different formats can support broadening and deepening in a different way. 1.4. Representational tools to support broadening and deepening Empirical research in which different representations are compared are relatively scarce. Suthers (2003) compared the effect of using a matrix, diagram, and text representation on the content and structure of participant’s discussions. The matrix representation led to more talk about evidential relations because the empty cells triggered discussing missing information. However, the analysis of interactions was mainly on the topics and references to topics, which reveals little about the depth of the interactive argumentation. Schwarz et al. (2003) compared an argumentative map with a pro–con table and measured the type of arguments given in individual questionnaires and collaborative essays. It was hypothesised that an argumentative map would lead students to use counter arguments, and rebuttals and would foster discourse among students. A pro–con table would only help to sum up the supporting and opposing reasons without further elaboration. Schwarz et al., however, only compared the content of argumentative maps and pro–con tables without looking at the interactions. They found no significant differences between the two representations. So, it still remains the question in what way different representational tools can support interactive argumentation in terms of broadening and deepening. Main aim of this research is to compare the support of a graphical representation with a non-graphical representation for interactive argumentation. A graphical representation like an argumentative diagram gives a two-dimensional format in which students can visualise their argument with boxes for arguments pro and contra and arrows for relations
L. Munneke et al. / Computers in Human Behavior 23 (2007) 1072–1088
1077
between arguments. This kind of representation is thought to support argumentation because visualising an argument stimulate to include evidential relations, to keep a balance between pro and contra arguments, to relate arguments, and to see inconsistencies and conflicts (Schwarz et al., 2003; Suthers & Hundhausen, 2003; Van Bruggen et al., 2003). A non-graphical representation like a pro–con table offers a linear format in which students can list their arguments pro and contra. In these kind of representations it is possible to organise different arguments, but they discourage putting relations between arguments (Schwarz et al; Suthers and Hundhausen). By comparing an argumentative diagram with a textual outline this research tries to get more insight in how these two different representational tools support the broadening and deepening of argumentation in the space of debate. It is expected that a collaborative use of an argumentative diagram will trigger students to use more evidence, counterarguments and rebuttals, because the externalization of supportive and alternative theories shows whether the argument is in balance and whether all theories are supported with evidence. Along with this, the collaborative construction will stimulate students in their discussion to explicate unbalance and conflicts they see in their diagrams. Looking at Fig. 1 this means the expectation is that students will both broaden and deepen their argument in the interactions as well as in the products (i.e., diagrams and final texts). When using a text-outline, the expectations are that students will gather supportive and alternative theories (i.e., broadening the discussion), but will elaborate less in their interactions as well as in the products (i.e., outlines and final texts) on their theories because the representation does not allow to link theories to evidences, counterarguments and rebuttals. 2. Method 2.1. Participants Participants in this study were 175 pre-university students aged 15–17 (M = 15.6, SD = 0.61) from five classes in two different secondary schools. The study took place at the schools and lasted for six lessons during two weeks. The lessons were part of the standard curriculum and took place in either Dutch language or General Science classes. Students were randomly assigned to dyads and the dyads were randomly assigned to experimental conditions. Students worked behind their own computer, in most cases without being able to see their partner. All dyads in which one of the students missed a lesson were excluded from analysis, leaving 55 dyads for analysis. Because analyses were very time-consuming 40 dyads were randomly chosen and further analysed. 2.2. Task and procedure 2.2.1. Domain The task was to discuss and write an argumentative text about genetically modified organisms (GMOs). This topic is part of the curriculum of the Dutch pre-university education and was chosen in collaboration with the teachers involved. The topic matched the research requirements because GMOs has the characteristics described for a wicked problem. There is no true or false or right or wrong answer for the question as to whether GMOs are a valuable biological development. There are many stakeholders with divergent views on the problem (e.g., Greenpeace, government, farmers, and consumers) and many
1078
L. Munneke et al. / Computers in Human Behavior 23 (2007) 1072–1088
different and acceptable solutions, though probably none which would satisfy all stakeholders. 2.2.2. Conditions The dyads were placed in two different experimental conditions based upon the computer tool available to them to support their discussion. In the outline-condition the students could make use of a text-outline tool to help them organise and structure a text. In the diagram-condition the students could make use of an argumentative diagram tool to help them visualise their discussion. 2.2.3. Task characteristics The task used was developed according to Veerman and Treasure-Jones’ guidelines (1999) and consisted of two collaborative phases preceded by a class introduction and individual preparation. In the first lesson (50 min) students were introduced to the task. After this they carried out an individual take-home assignment of approximately 40 min in which they had to read eight information sources on GMOs. These sources were popular, easy-to-read texts of between 100 and 350 words each and were written by different stakeholders, for example the government, Greenpeace, and an alliance of companies that produces genetically modified products. Within a dyad, students read a different set of eight information sources (thus, for each dyad a total of 16 information sources) which were complementary and contradictory, so they needed each other to get an overall picture of the problem. The sources were taken from the Internet and Dutch newspapers. After the preparation students entered the first collaborative task-phase, consisting of two 50min lessons in which they were asked to discuss the topic of GMOs in a chatbox and to use the tool they were provided when doing this. This phase will be referred to as the discussion phase. Students were instructed to discuss the topic and try to reach consensus (i.e., a joint opinion) about GMOs with help of the diagram or outline tool. During discussion they could enter the provided tool and put their arguments in it. They were explicitly instructed to use genuine evidence to support their theories, to think about what people who disagree with them might say, and how they would respond to these opponents. In addition they were explicitly told only to discuss the topic and not to start writing the final argumentative text. The writing was done in the second task-phase which lasted for three lessons (approximately 150 min). This phase will be referred to as the writing phase. Students were asked to collaboratively write an argumentative text of 1000 words in the same computer environment as they worked in during the discussion phase. Communication was still carried out via chat and the diagram or outline constructed during discussion phase (depending on the experimental condition) was still available. Students were told that the text would not only be judged on the soundness of their argument and the originality of their ideas, but also on their contributions in the chat during the earlier discussion phase. 2.3. CSCL tool 2.3.1. TC3 The computer environment used during the task was TC3 (Text Composer, Computersupported, and Collaborative), an earlier version of VCRI (Virtual Collaborative Research Institutes), which is developed by Jaspers and Erkens (2002). TC3 was adjusted
L. Munneke et al. / Computers in Human Behavior 23 (2007) 1072–1088
1079
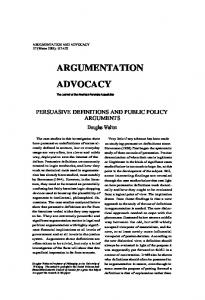
for the goals of this study and consisted of three main windows (see Fig. 2); the left window was used for chatting and thus conveyed the communication carried out. The upper-right window was used for presenting information about the task and the topic. The lower-right window was used for the collaborative writing of a text. Only one of the students could work in the diagram, outline or text window at a time and students could take turns by using the traffic light at the lower right-hand corner of the text window. 2.3.2. Diagram and outline tool At the bottom of the chat window (see Fig. 2) were two buttons ‘diagram’ and ‘outline’. Clicking one of these buttons produced a pop-up window with either the diagram or the outline tool. Students could click on both of the buttons, but were clearly instructed and controlled by the experimenter on using only the tool of the assigned condition. So, all students used only the tool of the condition they were assigned to. With the diagram (see Fig. 3) students could construct an overview of their claim and their arguments with the boxes ‘claim’ and ‘argument’. The arrows ‘supports’ (plus sign) and ‘opposes’ (minus sign) could be used to indicate whether an argument supports or opposes a claim. The design of the diagram was kept simple because research of Suthers (2003) indicates that a complex tool may distract students from the content of discussion. Fig. 4 shows the out-
Fig. 2. Screen capture of the main screen of the TC3 tool.
1080
L. Munneke et al. / Computers in Human Behavior 23 (2007) 1072–1088
Fig. 3. Screen capture of the diagram tool.
Fig. 4. Screen capture of the outline tool.
line tool. In this tool students could plan the structure and argumentative content of the text at the paragraph level. 2.4. Analyses 2.4.1. Data To collect the data, every click in TC3 was recorded. This resulted in integrated activity protocols in which all chat communication, tool and source use, tool content (i.e., the outlines and diagrams produced), turn-taking, and the writing of the text was registered. For the analyses four spaces in which utterances and actions could take place were distinguished, namely the (1) chat-space during discussion, (2) tool-space during discussion, (3) chat-space during writing, and (4) text-space during writing. The chat-space consists of all utterances in chat. The tool-space consists of all of the content of the diagram or
L. Munneke et al. / Computers in Human Behavior 23 (2007) 1072–1088
1081
the outline, as well as all actions that were necessary to use the diagram and outline tools (e.g., putting boxes in the diagram and drawing arrows). The text-space contains all the content of the written text and all of the actions necessary for writing a text in TC3, such as the counting of words. In addition to these four spaces, a category of using sources and the traffic-light was also distinguished. Essentially, the unit of analysis in the chat-space consisted of every separate utterance in chat, marked by clicking ‘enter’ or turn-taking. When an utterance required more than one code, the utterance was split. For example, when a student wrote ‘‘I am against GMOs, because it threatens the environment’’, the utterance was split into ‘‘I am against’’ and ‘‘because it threatens the environment’’. Also, when students clicked ‘enter’ before ending their message, the two chat utterances were merged. The utterances and actions in the tool-space and text-space, were coded when they were registered in the protocols and they were treated in the same way as utterances in chat. The coding of utterances and actions in the protocols was executed with MEPA, a computer program for Multiple Episode Protocol Analysis (Erkens, 2002). 2.4.2. Task acts To make sense of the long protocols, a first analysis of task acts was necessary. Based on the Rainbow method (Baker et al., 2003) a coding scheme was developed of which the main coding categories are shown in Table 1. The categories Interaction Management and Task Management were coded in subcategories. To define reliability, ten protocols of dyads that were excluded from analysis because of missing data were coded by two raters. Inter-rater agreement on ten protocols for this coding system of task acts was .80 (Cohen’s Kappa). 2.4.3. Argumentative activity The task act Argumentative Activity was coded separately from the coding system of task acts. Based on the work of Kuhn (1991), every argumentative activity was coded with the categories shown in Fig. 1. The place of one argumentative activity within a sequence of argumentative activities defined whether it was a claim, supportive theory, alternative theory, evidence, counterargument, or rebuttal. All codes were accompanied by the label
Table 1 Main codes for task acts Categories of codes
Description
Outside Activity
Utterances and actions that are not constitutive of the interactive space imposed by the researcher Utterances about the students’ interpersonal relation that relate directly to their carrying out of the task and collaboration Utterances and actions to manage the communicative interaction itself such as checking presence, turn-taking and grounding Remarks and actions concerned with managing different aspects of the task such as the use of TC3 and tools, the use of information sources, argumentation, and the writing of the text Utterances and actions concerning claims and supporting and opposing those claims
Social Relation Interaction Management Task Management
Argumentative Activity Conceptual Activity
Utterances and actions concerning the concepts in GMOs
1082
L. Munneke et al. / Computers in Human Behavior 23 (2007) 1072–1088
‘asking’ or ‘giving’ denoting whether for example a claim or evidence is asked for or given by a student. Again ten protocols were coded by two raters to define reliability. The interrater agreement on ten protocols was .82 (Cohen‘s Kappa), which can be considered fairly high. 2.4.4. Breadth and depth of interactive argumentation The coding system of the task acts and argumentative activity constituted the basis for a more extended analysis of the breadth and depth of interactive argumentation. The breadth of the space of debate was defined as the number of argumentative sequences counted, including all single utterances which were not followed by argumentative elaboration. To define the depth of an elaboration the number of arguments in a sequence of related argumentative activities was calculated. For example, when students gave a claim, a supportive theory and evidence for this supportive theory, the sequence was Claim–Supportive–Evidence. The score on depth is three. In this way all sequences of elaboration on arguments are counted with respect to their depth. 3. Results 3.1. Performance of the task in general The mean length of the protocols was 717.43 events, but varied greatly between dyads (SD = 186.90). A considerable percentage of the protocols consisted of task acts in chatspace (63.75), percentages for the chat-space of discussion and chat-space of writing were almost equal, 30.75 and 33.00 respectively. In discussion phase the percentages for the task acts Outside Activity, Social Relation, Interaction Management, Task Management, Argumentative Activity, and Conceptual Activity were 4.64, 5.93, 19.81, 55.24, 12.85, and 1.18, respectively. In writing phase the percentages were 4.54, 5.28, 18.65, 62.40, 7.07, and 1.63, respectively. A paired-sample t-test showed significant more Argumentative Activity during the discussion phase (M = 40.68, SD = 26.16) compared to the writing phase (M = 29.13, SD = 12.55), t(39) = 3.23, p = .00 (two-tailed), d = .56. 3.2. Comparing conditions on task acts 3.2.1. Task acts in chat-space during discussion To detect differences between the diagram and outline condition in the chat-space during discussion multivariate analyses of variance (MANOVA) was conducted with the task acts as dependent variables. There were no significant differences between the two conditions on the main categories of task acts, F(7, 32) = 0.78, p = .61, g2 = 0.15. A separate MANOVA was run for the subcategories of Task Management which revealed several statistical significant differences. There was an overall significant difference between outline and diagram condition, F(6, 33) = 2.99, p = .01, g2 = 0.39. Inspection of Table 2 shows that this effect is due to significant differences on the subcategories Task in General, Information and Text. Students asked to write a text-outline during discussion talked significantly more about the overall task that had to be carried out, the text that had to be written and about the given information sources than students asked to construct an argumentative diagram.
L. Munneke et al. / Computers in Human Behavior 23 (2007) 1072–1088
1083
Table 2 Subcategories of Task Management in chat-space Task acts
Task in general Information TC3 Argumentation Text Tools * **
Outline (n = 20)
Diagram (n = 20)
F(1, 38)
M
SD
M
SD
50.80 10.40 12.55 15.25 1.70 35.85
19.71 9.06 8.92 15.14 0.30 23.39
36.25 4.90 17.40 19.40 0.92 21.75
14.73 8.08 17.08 13.01 3.35 12.48
7.23** 5.01* 0.51 1.023 3.35* 2.40
p < .05. p < .01.
3.2.2. Task acts in tool-space during discussion Because only the categories Task Management Argumentative Activity, and Conceptual Activity were used for coding the task acts in tool-space during discussion MANOVA on the main categories Task Management (only consisting of Task Management Tools) and Argumentative Activity was performed. This showed an overall difference, F(3, 36) = 28.54, p = .00, g2 = 0.71 Students discussing with support of a diagram needed more actions to construct the diagram (M = 49.10, SD = 5.47) than students who wrote an outline (M = 4.40, SD = 0.98), F(1, 38) = 64.69, p = .00, g2 = 0.63. However, the content of the diagrams consisted of more argumentative acts (M = 16.65, SD = 5.04) than the content of the outlines (M = 7.65, SD = 6.20), F(1, 38) = 25.37, p = .00, g2 = 0.40. Looking more specifically at the Argumentative Activity MANOVA was performed on the subcategories of Argumentative Activity. There was a significant difference between the diagram and outline condition, F(6, 33) = 5.09, p = .00, g2 = 0.41. Table 3 shows the univariate effects of the different Argumentative Activities. Students who constructed a diagram used more argumentative activities reflecting the other side of a claim like alternative theories and rebuttals. Next to this they used more supportive theories and evidences in the diagram compared to students who wrote a text-outline. 3.2.3. Task acts in text-space during writing MANOVA showed a main effect of experimental conditions on the actions students performed during writing the text, F(4, 35) = 5.06, p = .00, g2 = 0.37. This was due to a Table 3 Argumentative Activities in tool-space Argumentative Activity
Outline (n = 20) M
SD
M
SD
Claim Supportive theory Alternative theory Evidence Counterargument Rebuttal
0.80 2.85 1.75 1.15 0.30 0.80
0.90 2.01 1.89 2.08 1.13 1.58
1.70 5.50 2.75 3.30 0.90 1.90
0.87 2.14 1.89 2.77 2.05 1.65
* **
p < .05. p < .01.
Diagram (n = 20)
F(1, 38) 10.47** 15.93** 2.80* 7.68** 1.32 4.64*
1084
L. Munneke et al. / Computers in Human Behavior 23 (2007) 1072–1088
significant difference on the main category Conceptual Activity. Students who constructed a diagram during the discussion phase wrote less about concepts (M = 1.55, SD = 0.22) than students who wrote an outline (M = 3.60, SD = 0.62), F(1, 38) = 9.64, p = .00, g2 = 0.20. 3.2.4. Argumentative activity through all spaces For both conditions correlations were calculated between Argumentative Activity in chat-space, tool-space and text-space. It appeared that there was a higher moderate correlation between the argumentative activity in outline and text-space (r = .63, p = .00) compared to the correlation between the argumentative activity in diagram and text-space (r = .57, p = .01). 3.3. Breadth and depth of argumentative activity The means and standard deviations of the breadth and depth for each condition as well as the student actions in the different spaces of discussion and writing phase are shown in Table 4. Separate MANOVAs on breadth and depth revealed significant main effects of conditions for both breadth, F(4, 35) = 5.46, p = .00, g2 = 0.38 and depth, F(4, 35) = 2.78, p = .04, g2 = 0.24. 3.3.1. Breadth The effect of conditions on the breadth of arguing was due to a significant difference in the tool-space during discussion. The students who constructed a diagram were more broad in their argumentation in the diagrams than students who wrote an outline, F(1, 38) = 17.12, p = .00, g2 = 0.31. Also there was a notable, but non-significant effect found for students using an outline. In the chat-space these students tend to talk more broadly about GMO’s than students using a diagram, F(1, 38) = 2.46, p = .06, g2 = 0.06. 3.3.2. Depth The difference between conditions on the depth of arguing was caused by the fact that students who were asked to write an outline in chat-space argued more in depth, than students asked to construct a diagram, F(1, 38) = 3.35, p = .04, g2 = 0.12. However, although students in the diagram group have shorter argumentative sequences in chat they have dee-
Table 4 Breadth and depth of argumentative sequences Argumentative sequences in:
Discussion phase Chat-space Tool-space Writing phase Chat-space Text-space
Breadth
Depth
Outline (n = 20)
Diagram (n = 20)
Outline (n = 20)
Diagram (n = 20)
M
SD
M
SD
M
SD
M
SD
9.20 4.85
1.22 0.77
6.90 8.85
0.81 0.59
2.54 1.34
0.17 0.19
2.09 1.85
0.17 0.09
1.45 10.65
0.36 1.01
1.45 9.25
0.37 0.93
1.03 2.19
0.23 0.15
0.92 2.13
0.20 0.16
L. Munneke et al. / Computers in Human Behavior 23 (2007) 1072–1088
1085
per argumentative sequences in their diagrams compared to the outline group, F(1, 38) = 5.93, p = .01, g2 = 0.14. 3.4. Interactive argumentation? The last question to answer is whether the argumentative sequences were really interactive in nature. Results showed that of the total amount of argumentative activity in chat during discussion, 44% was interactive argumentation. 10% of the total argumentative activity in chat-space consisted of asking support or verifying arguments. In tool-space 21% of the argumentation was interactive and in text-space 18%. Two-tailed t-tests revealed that interactively constructed sequences during chatting in the discussion phase (M = 3.07, SD = 1.41) and using the tool-space (M = 2.00, SD = 1.59) in that same phase were longer (that is to say were deeper) than individually constructed argumentative sequences (M = 1.24, SD = 0.59; M = 1.30, SD = 0.09, respectively), t(39) = 7.65, p = .00; t(39) = 3.06, p = .00, respectively. 4. Discussion In this study, students who participated in a discussion about a wicked problem supported by an argumentative diagram, constructed diagrams that contained significantly more claims, supportive theories, evidence, alternative theories and rebuttals than the outlines of students supported by a text-outline. In addition, the group supported by a diagram argued more in depth and breadth about the topic of GMOs. Thus, it can be concluded that diagrams support students in the elaboration of their arguments and are stimulated to think about their opponents’ views. However, we also expected the diagram group to have more argumentative activity in their chats and texts, because of the support by a diagram. Visualising and explicating the argumentation was thought to stimulate students to see inconsistencies and incomplete arguments. The data did not confirm this hypothesis. Students using an outline during discussion were more broad and deep in their arguments than students using a diagram. It seems that broadening and deepening in the space of debate in a diagram restrains the broadening and deepening in chatting. These findings are consistent with recent research on the effect of argumentative diagrams on how students discuss concepts and accomplish collaborative writing tasks (Erkens, Jaspers, Prangsma, & Kanselaar, 2005; Van Amelsvoort, Andriessen, & Kanselaar, 2006; Van Drie, Van Boxtel, Jaspers, & Kanselaar, 2005). Using a diagram seems to have some effects on argumentation, but often not the expected influence on chat discussions between students. Erkens et al. (2005) remark in this context: ‘‘Further analysis of the protocols showed that the diagram often functions as a visual representation, and not as a basis for discussion or a tool for idea generation.’’ (p. 486) The above mentioned researchers postulate that students lack experience with such tools and need specially adapted instruction to learn to use them. We agree with this, but based upon our results add that students can interpreter the function of tools in a different way than intended by the designer. They do not see the different tools as specific and shape them for their own use and misuse. Returning to the results of this study, the results related to task acts showed that the task was very complex. Questions arise here whether the task of discussing, constructing tools, and writing a text is not to complex for students. Construction of diagram interfered
1086
L. Munneke et al. / Computers in Human Behavior 23 (2007) 1072–1088
with chat and while writing a text, the interactive argumentation in chat-space was almost absent. Writing a text requires complex skills and this may be too complicated for students to achieve together with the goal of broadening and deepening in the space of debate during discussion (Huk & Steinke, 2006; Seufert, Ja¨nen, & Bru¨nken, 2006). Results also showed that students saw the discussion phase and writing phase as two separate tasks and not as consecutive with discussion being a prerequisite to writing. Differences between the diagram and outline condition during discussion did not translate to the breadth and depth of argumentation in the texts. The same results were found by Janssen, Erkens, and Kanselaar (2006), were students using a ‘shared space’ tool had higher performance scores in the part of task were discussion played the main role. In the writing part of the task scores of the students using the tool were equal with student in the control group. It can be concluded that the instruction to students to be critical, to use multiple perspectives and to be elaborative did not really have the expected outcome for the chats. Students rarely question and overall they show the problems described by Kuhn (1991), namely that they use a lot of evidence and supporting theories, but have less attention for the opponents’ view. Especially counter argumentation (i.e., thinking about what an opponent would say against their supportive theory) seems very difficult to achieve. Though, the instruction aimed at students arguing in a broad and deep way it remains the question as to whether students interpreter the instruction in the intended way. Nussbaum (2005) investigated the effects of goal instruction on the nature of students’ interactive argumentation. Nussbaum points out that an instruction must trigger the appropriate argument frame. An argument frame represents a particular type of argumentative discourse (e.g., persuasive dialogues, inquiries, deliberations, negotiations). In this study the goal of argumentation was the exploration of the space of debate. It is possible that students used more adversarial frames, which can inhibit the exploration of the topic because the main goal is to persuade the other instead of explore together. The results also showed that much argumentative activity was not really interactive. Students produced many sequences on their own especially in tool-space and text-space. A possible explanation may be that students are used to more traditional school tasks and to working for grades. They may have interpreted the wicked problem as a problem to solve quickly; aimed at a product (i.e., a text, a diagram, an outline), instead of understanding the space of GMOs. In context of this, Kirschner, Martens, and Strijbos (2004) note: ‘‘it is not always clear to whom and to what extent an authentic task is really ‘authentic’. (. . .) Is the problem that needs to be solved really ‘our’ problem or rather ‘yours, hers or theirs’?’’ (p. 22) Students in our research were asked to discuss GMOs, a problem which may not really be authentic or interesting for 16/17 year old. Along with this, it can be noticed that we used a CSCL task in a traditional school environment, which is not used to this kind of collaborative argumentative tasks. This study adds to a growing body of work on arguing to learn (e.g., Andriessen, 2006). It shows that using a representational format like a diagram supports the argumentative processes, but does not optimally provoke discussion between students. In addition, students appeared not to take full advantage of the collaborative setting. Possible causes can be sought in a lack of experience with tools and different interpretations of the intended way to use the tools. Along with this, it was noted that the task at hand seemed very complex and that students could interpret the task in different ways. Continued research is necessary to learn more about why students do not broaden and deepen arguments in their discussions and in what way they can be stimulated by representational
L. Munneke et al. / Computers in Human Behavior 23 (2007) 1072–1088
1087
tools, task instruction and learning environments to really engage in interactive argumentation in a broad and deep way. References Andriessen, J. E. B. (2006). Arguing to learn. In R. K. Sawyer (Ed.), The Cambridge handbook of the learning sciences (pp. 443–460). New York: Cambridge University Press. Baker, M. J. (2003). Computer-mediated argumentative interactions for the co-elaboration of scientific notions. In J. Andriessen, M. Baker, & D. Suthers (Eds.), Confronting cognitions: Arguing to learn (pp. 1–17). Dordrecht, The Netherlands: Kluwer Academic Publishers. Baker, M. J., Quignard, M., Lund, K., & Se´journe´, A. (2003). Computer-supported collaborative learning in the space of debate. In B. Wasson, S. Ludvigsen, & U. Hoppe (Eds.), Designing for change in networked learning environments: Proceedings of the international conference on computer support for collaborative learning (pp. 11–20). Dordrecht, The Netherlands: Kluwer Academic Publishers. Bell, P. (2004). Promoting students’ argument construction and collaborative debate in the science classroom. In M. C. Linn, E. A. Davis, & P. Bell (Eds.), Internet environments for science education (pp. 115–143). Mahwah, NJ: Lawrence Erlbaum Associates. Bennet, N., & Dunne, E. (1991). The nature of quality of talk in co-operative classroom groups. Learning and Instruction, 1, 103–118. Billig, M. (1987). Arguing and thinking: a rhetorical approach to social psychology (2nd ed.). Cambridge, UK: Cambridge University Press [Original work published 1987]. Chan, C. K. K. (2001). Peer collaboration and discourse patterns in learning from incompatible information. Instructional Science, 29, 443–479. Chinn, C. A., & Anderson, R. C. (1998). The structure of discussion that promote reasoning. Teacher College Record, 100, 315–368. Erkens, G. (2002). MEPA. Multiple episode protocol analysis (Version 4.8) [computer software]. Utrecht, The Netherlands: Utrecht University. Erkens, G., Jaspers, J., Prangsma, M., & Kanselaar, G. (2005). Coordination processes in computer supported writing. Computers in Human Behavior, 21, 463–486. Erkens, G., Prangsma, M. E., Jaspers, J. G. M., & Kanselaar, G. (2002). Computer support for collaborative and argumentative writing (Rep. No. 02.01). Utrecht: Utrecht University, ICO-ISOR Onderwijsresearch. Felton, M., & Kuhn, D. (2001). The development of argumentative discourse skill. Discourse Processes, 32, 135–153. Hightower, R., & Sayeed, L. (1995). The impact of computer-mediated communication systems on biased group discussion. Computers in Human Behavior, 11, 33–44. Huk, T., & Steinke, M. (2006). Learning cell biology with close-up views or connecting lines: evidences for the structure mapping effect. Computers in Human Behavior, doi:10.1016/j.chb.2006.10.004. Janssen, J., Erkens, G., & Kanselaar, G. (2006). Visualization of agreement and discussion processes during Computer-supported Collaborative Learning. Computers in Human Behavior, doi:10.1016/j.chb.2006.10.005. Jaspers, J., & Erkens, G. (2002). VCRI. Virtual collaborative research institute (Version 1.0) [Computer software]. Utrecht, The Netherlands: Utrecht University. Kirschner, P. A., Martens, R. L., & Strijbos, J.-W. (2004). CSCL in higher education? A framework for designing multiple collaborative environments. In J. W. Strijbos, P. A. Kirschner, & R. L. Martens (Eds.), What we know about CSCL and implementing it in higher education (pp. 3–30). Boston, MA: Kluwer Academic Publishers. Kirschner, P. A., Van Bruggen, J., & Duffy, T. (2003). Validating a representational notation for collaborative problem solving. In B. Wasson, S. Ludvigsen, & U. Hoppe (Eds.), Designing for change in networked learning environment (pp. 163–172). Dordrecht: Kluwer Academic Publishers. Kuhn, D. (1991). The skills of argument. Cambridge: University Press. Kuhn, D., & Udell, W. (2003). The development of argument skills. Child Development, 74, 1245–1260. Leita˜o, S. (2000). The potential of argument in knowledge building. Human Development, 43, 332–360. Munneke, L. (2002). Twins project: the quality of collaborative interactions in CSCL environments. Paper presented at the summerschool meeting of the Interuniversity Centre for Educational Research, Rethymnon, Crete. Nussbaum, E. M. (2005). The effect of goal instructions and need for cognition on interactive argumentation. Contemporary Educational Psychology, 30, 286–313.
1088
L. Munneke et al. / Computers in Human Behavior 23 (2007) 1072–1088
Paolucci, M., Suthers, D. D., & Weiner, A. (1995). Belve´de`re: stimulating students’ critical discussion. In I. Katz, R. Mack, & L. Marks (Eds.), Proceedings of the conference companion on human factors in computing systems (pp. 123–124). New York, NY: ACM Press. Petraglia, J. (1998). Reality by design: the rhetoric and technology of authenticity in education. Mahwah, NJ: Lawrence Erlbaum Associates. Pontecorvo, C., & Girardet, H. (1993). Arguing and reasoning in understanding historical topics. Cognition and Instruction, 11, 365–395. Reznitkskaya, A., Anderson, R. C., McNurlen, B., Nguyen-Jahiel, K., Archodidou, A., & Kim, S. (2001). Influence of oral discussion on written argument. Discourse Processes, 32, 155–175. Rittel, H. W. J., & Webber, M. M. (1973). Dilemmas in a general theory of planning. Policy Sciences, 4, 155–169. Schwarz, B. B., Neuman, Y., Gil, J., & Ilya, M. (2003). Construction of collective and individual knowledge in argumentative activity. The Journal of the Learning Sciences, 12, 219–256. Seufert, T., Ja¨nen, I., & Bru¨nken, R. (2006). The impact of intrinsic cognitive load on the effectiveness of graphical help for coherence formation. Computers in Human Behavior, doi:10.1016/j.chb.2006.10.002. Stein, N. L., & Albro, E. R. (2001). The origins and nature of arguments: studies in conflict understanding, emotion, and negotiation. Discourse Processes, 32, 113–133. Suthers, D. D. (2003). Representational guidance for collaborative inquiry. In J. Andriessen, M. Baker, & D. Suthers (Eds.), Confronting cognitions: Arguing to learn (pp. 1–17). Dordrecht, The Netherlands: Kluwer Academic Publishers. Suthers, D. D., & Hundhausen, C. D. (2003). An experimental study of the effect of representational guidance on collaborative learning processes. The Journal of The Learning Sciences, 12, 183–218. Toulmin, S. (1958). The uses of argument. New York: Cambridge University Press. Van Amelsvoort, M., Andriessen, J., & Kanselaar, G. (2006). Representational tools in computer-supported collaborative argumentation-based learning. How dyads work with constructed and inspected argumentative diagrams. Manuscript submitted for publication. Van Bruggen, J. M., Boshuizen, H. P., & Kirschner, P. A. (2003). A cognitive framework for cooperative problem solving with argument visualization. In P. A. Kirschner, S. J. Buckingham Shum, & C. S. Carr (Eds.), Visualizing argumentation: Software tools for collaborative and educational sense-making. London: Springer. Van Drie, J., Van Boxtel, C., Jaspers, J., & Kanselaar, G. (2005). Effects of representational guidance on domain specific reasoning in CSCL. Computer in Human Behavior, 21, 575–602. Veerman, A. (2000). Computer-supported collaborative learning through argumentation. Unpublished doctoral dissertation, Utrecht University, The Netherlands. Veerman, A., & Treasure-Jones, T. (1999). Software for problem solving through collaborative argumentation. In G. Rijlaarsdam & E. Espe´ret (Eds.). In J. E. B. Andriessen & P. Courier (Eds.). Studies in writing 5: Foundations of argumentative text processing (pp. 203–229). Amsterdam: Amsterdam University Press. Voss, J. F., & Means, M. L. (1991). Learning to reason via instruction in argumentation. Learning and Instruction, 1, 337–350.