in the adoption of Software Project and Product Measures for addressing the project size of projects performed during a. Mobile Application Development course ...
Supporting Mobile Development Project-Based learning by Software Project and Product Measures Rita Francese1 , Carmine Gravino1 , Michele Risi1 , Giuseppe Scanniello2 and Genoveffa Tortora1 requirements according to this suggestion. In particular, we exploited the results we got in [2], where we demonstrated that requirement analysis measures can effectively employed to estimate software project and product measures of a mobile app and estimations can be done early in the software development process. The metrics extracted from the projects of academic year 2013/14 have been used in the successive year to intervene on the requirements to adjust the project size. The paper is structured as follows: in Section II we discuss the background concerning PBL and Software Estimation; Section III describes the learning experience related to the considered Mobile Application Development course; Section IV summarizes the effort estimation model we adopted and Section V describes how it is used to estimate student efforts and the results from its application. Finally, Section VI concludes the paper.
Abstract— Project-based learning is a kind of learning activity which has great educative effect, but which presents also several issues. In particular, if we consider an university course that requires the design and the implementation of a software project, may be difficult to estimate the number of hours that a team of students has to take to accomplish that project. There is the risk to underestimate the project (too difficult) or to overestimate it (too easy) with respect to the other projects of the same course and the amount of foreseen work hours. In this paper, we present the experience we gained in the adoption of Software Project and Product Measures for addressing the project size of projects performed during a Mobile Application Development course for Computer Science students at the University of Salerno. The course foresaw a project work conducted by students organized in teams. The goal of the project work was to design and develop an Android-based application with back-end for smart devices. Software estimation project measures are applied to some metrics extracted in the requirement analysis phase to get an estimation of the effort in terms of man/hours and consequently to adjust the project size by adding/reducing requirements. The metrics extracted from the projects of academic year 2013/14 have been used in the successive year for estimating the project effort and intervene on the project size variables.
II. BACKGROUND
Project-Based Learning (PBL) is a learning approach that structures learning around projects [3]. It involves both conI. I NTRODUCTION structivisme [4], a learning theory in which learners actively Software development projects may often be late and construct their knowledge, and team-based learning [5], in overrun time and cost [1]. These can have a dramatic impact which the learning activity is conducted by a team of people in case of Project-Based-Learning (PBL) activities, where it which collaborate to pursuit a common objective. may occur that a student project is late or requires much more In particular, Vigotsky [6] puts in evidence the relevance work with respect to the estimation. Effort understimation of the social context and the interaction among pairs to may produce the failure of the project and the team members learn when problems have to be solved. This overcomes risk to not pass the exam, while effort overstimation may the idea of learning activity where students passively absorb produce a project not corresponding to the teacher expec- knowledge from their instructor. When student are motivated tations. The final evaluation can be excessive if the teacher to cooperate they can be successful team member in real does not correctly evaluate the project size, or students can industry environments [7]. However, team work is not only have poor results, while they could have produced more with work together, it requires the team members to plan their appropriate requirements. projects activities, to monitor the project progress, and to Software estimation problems have been largely investi- disciplinarly manage their work [8]. gated in the literature. In particular, in [2] the problem of prePBL let students cooperate to solve together problems dicting software project and product measures in the domain typical of the job world. The involvement of students is in of Android development has been addressed considering as general higher than traditional classroom activities. sample mobile applications produced by students during a The adoption of PBL in Computer Science courses is mobile application development course. growing [9], [10], [11], [12], [13] because it enables the In this paper, we try to reduce the gap between the amount students to acquire soft skills such as to be able to work of hours required to develop a project and the real project in group as a team, to respect deadline, to take ones own effort in the domain of PBL for Android app development. responsibility, to be able to communicate. All these skills We decided to try to estimate in the earlier phases of are considered very relevant for organizations. PBL prothe projects the required effort and to resize the project motes principles, methods and procedures similar to the ones adopted for developing real software products [14]. During 1 University of Salerno, Italy {francese, gravino, mrisi, the various project phases documentation is produced, foltortora}@unisa.it 2 University of Basilicata {giuseppe.scanniello}@unibas.it lowing specific standards. This implies that students do not DOI reference number: 10.18293/DMS2016-045
41
have to perform only coding activity, but also to acquire analysis and writing skills [10]. In [15] we described the learning experience related to the Mobile Application Development course, summarized in Section III. During this experience we collected several product and process metrics useful to assess the project and process quality. From this experience we gained the conviction that there was the need of following a project management approach which takes into account effort estimation for assigning correctly dimensioned projects to students’ teams. In the literature, estimation approaches have been classified in different way, see for example [16]. Generally, they belong to one of this types: (i) expert estimation, as software experts provides an estimate on the base of his experience; (ii) formal estimation model, a mathematical model is created on the base of historical data to quantify the effort; and (iii) a combination of the other two approaches. The estimation produces software measures which can be exploited for project management purpose. Research studies put in evidence that the best approach does not exist, but the goodness of the results often depend on the context and the application domain [17], [18]. Also the development technology may influence the estimation accuracy [19]. Software estimation effort has been adopted in [20] for adjusting the size of database-oriented student projects, which followed a traditional waterfall development model. The prediction approach exploited a modified function point counting tables and use cases. In this paper we apply the effort estimation model for mobile application development presented in [2], which is based on the metrics extracted from the projects of academic year 2013/14. This model has been conceived using the dataset of the experience presented in [15] and is detailed and discussed in Section IV.
non-functional requirements were provided. In particular, the teacher imposed the following non-functional requirements: the operating system is Android, the app had to interact with a remote server, communicating data through JSON; native device functionalities have to be exploited, including maps, GPS, sensors, phone call and SMS. Also the device rotation has to be managed and the app has to use SQLite to store data on the device. Games were admitted if they exposed backend functionalities, such as account management, multiuser support, bonus management, and the upgrade of the app. The team composition was freely chosen by students. We did not decide to assign randomly team members because the students had previous experience of project work in several courses and, at the last term, they know which were the classmates more appropriate for them. The students were asked to use GitHub1 for the management activities. The lecturer created a GitHub account for each team of students. The templates of documents to be released at the end of the various development activities were made available in the GitHub repository of each team. We established a schedule for each team of students. They were informed about deadlines and deliverables. The first deliverable was the project proposal, while the second the Requirement Analysis Document (RAD). Successively, the participants had to deliver the different releases of their mobile app and the final version of this app. To write the RAD, participants were asked to follow the template by Bruegge and Dutoit [21]. A RAD is used to document requirements elicitation and analysis. As for requirements elicitation, the software engineer specifies functional and non-functional requirements. Functional requirements are expressed as free-form text (a summary of functionality to be implemented) and then in terms of use cases narratives and use case diagrams. As for requirements analysis, the software engineer specifies object and dynamic models of the software. Each identified object of the problem domain is textually described, while relationships among objects are illustrated with class diagrams. Attributes and operations of problem domain objects are detailed only if needed. The behavior of these objects is documented in terms of sequence diagrams and state machine diagrams. These kinds of diagrams are exploited to specify complex behaviors of either use case or single objects, respectively. We asked the students to follow an incremental prototyping development approach. The students were also asked to show app prototypes to the MAD lecturer before the conclusion of their project. At the end of the course a competition named App Challenge was conducted to whom participated members of International IT industries. This produced a good competition spirit among participants. The IT managers judged the final products of good quality and very near to real apps available on the market. More detail on the teaching experience of the first edition are described in [15].
III. T HE L EARNING EXPERIENCE The Mobile Application Development (MAD) course is given at the University of Salerno since the academic year 2011/12. The course focus on the design and development of Android mobile applications. The course lasts 48 hours, divided in 24h lectures and 24h laboratory. It is estimated that for each hour of lab students have to perform at home two hours of study to implement their project. In this paper we refer to two successive edition of the course: the first occurring in the spring of 2014 (described in [15]), and the second in the spring of 2015. The data got from the first edition have been used to develop an effort prediction model for the development of mobile applications, while in the second one we used the model to address the work of the student trying to get a balanced project work. When the course begins, the project work is accurately motivated by each team by providing a Project Proposal document. The teacher evaluates this document, in which the objective of the project, the analysis of existing similar application, and a preliminary description of functional and
1 https://github.com
42
TABLE I
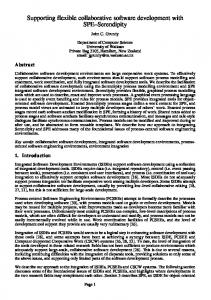
user’s position and interests. Weather information is shown on demand. The number of functional requirements (FR) of Archeotour is 8. It is obtained by counting requirements listed in the functional requirement section of the RAD. As an example, ”Select the site on the map and show its description, history and pictures” is a functional requirement. A functional requirement can correspond to more than one use cases (UC). For example, the mentioned functional requirement is associated to the use cases Show Site and Show Map in Figure 1 showing one of the use case diagrams of the project. In this diagram, the number of use cases is 6, while the number of actors is 2. The number of actors (Act) is computed by counting the different actors that appear in all use case diagrams in the RAD. Similarly, the number of classes (Cla) is computed by counting classes in the class diagram of the same RAD. For example, the class diagram of Archeotour shown in Figure 2 is composed of 24 classes. The number of sequence diagrams (SD) is obtained by counting how many of this kind of diagrams have been specified in the RAD. Some descriptive statistics (i.e., minimum, maximum, mean, median, and standard deviation values) of the independent variables are shown in Table III. For the dependent variables, descriptive statistics are also reported. We have also graphically shown the values for our dependent variables by the boxplots in Figure 3.
VARIABLES DENOTING INFORMATION FROM RAD S
Measure FR Act UC Cla SD
Number Number Number Number Number
of of of of of
Description functional requirements use case actors use cases classes sequence diagrams
TABLE II VARIABLES DENOTING INFORMATION FROM SOURCE CODE OBTAINED BY THE U NDERSTAND TOOL
Measure McB Classes Files Methods NL LOC CLOC STM DIT
Description McCabe Cyclomatic complexity Number of classes Number of files Number of methods, including inherited ones Number of all lines Number of lines containing source code Number of lines containing comment Number of statements Depth of inheritance
IV. T HE E STIMATION MODEL The estimation model has been created by analyzing the projects of the academic year 2013/14. In particular, we have considered the projects performed by students during the MAD course for Computer Science at the University of Salerno. Participants were originally 57 and were arranged in 27 teams. Data for 4 teams have been discarded due to incompleteness issues (e.g., lack of class diagrams or functional requirements) in the RADs the members of these teams produced. In the following of this section we describe how the model was built.
B. Estimation technique The estimation technique adopted in [2] is StepWise Linear Regression (SWLR) technique [22], which explores the relationship between a dependent variable and one or more independent variables, providing a prediction model described by a linear equation: y = b1 x1 + b2 x2 + ... + bn xn + c
A. Variables
where y is the dependent variable, x1 , x2 , ..., xn are the independent variables, bi is the coefficient that represents
The dependent variable of interest for this discussion is the Effort, and can be computed as the total effort to develop a mobile app expressed in terms of person/hour. In [2] initially were proposed two sets of independent variables. The first set, reported and described in Table I, collects variable obtained from the RAD or from the requirements, while the second set in Table II, collects variables from the source code gathered by exploiting the Understand2 tool. These two sets of variables are useful to compare prediction accuracy of software measures obtained from RADs (RAD or requirements measures, from here on) against the accuracy of predictions obtained with measures gathered from source code (simply SC measures, from here on). To explain how metrics have been collected, we provide an example of a project among those considered in our data analysis, Archeotour. Students of Archeotour team developed an Android application that provides information on archaeological sites and suggests tours considering the
Fig. 1.
2 https://scitools.com
43
A use case diagram of the Archeotur project.
Fig. 2.
The class diagram of the Archeotur project.
TABLE III D ESCRIPTIVE STATISTICS OF THE DEPENDENT AND INDEPENDENT VARIABLES CONSIDERED FOR THE ANALYSIS
Variable FR Act UC Cla SD McB Classes Files Methods NL LOC CLOC STM DIT Effort
Min 4 1 4 10 3 48 12 5 192 534 258 12 163 2 30
Max 23 4 26 57 16 4030 967 273 15222 42287 29456 3108 21369 4 113
Mean 8.48 1.59 10.78 21.78 7.07 517.52 89.22 34.19 1510.07 5134.56 3599.93 393.56 2714.44 2.44 58.82
the amount variable y changes when variables xi changes 1 unit, and c is the intercept. SWLR allows computing an equation in stages in which the choice of the independent variables is carried out by an automatic procedure. These variables can be chosen applying three approaches: forward, backward, or a combination of both [23]. The forward approach starts with no variables
Median 8 1 8 19 6 282 54 23 943 2740 2037 258 1464 2 55
Standard Deviation 4.29 0.8 5.8 12.1 3.025 747.91 178.62 50.16 2795.71 7854.72 5455.17 591.7 3969.11 0.58 21.04
in the model. It tries out the variables one by one and includes them in the model if they are statistically significantly correlated with the dependent variable. The backward approach starts with all the variables and test them one by one. We remove the variables that are not statistically significant correlated with the dependent variable. We used here a combination of forward and backward approaches.
44
(a) RAD measures.
(b) SC measures. Fig. 3.
The boxplots of (a) RAD measure values, (b) and SC measure values.
At each step, this combined approach includes or removes variables one by one if they are or not statistically significant correlated with the dependent variable. We employed SWLR because this technique allows computing linear regression in stages and because it is widely used in the context of software prediction with appreciable results [17], [24], [25], [26]. To evaluate the goodness of fit of a model, we exploited the square of the linear correlation coefficient (i.e., R2 ). This coefficient shows the amount of variance of the dependent variable explained by the model related to an independent variable. A good model should be characterized by a high R2 value. We also considered the F value indicators and the corresponding p-value (denoted by Sign. F), whose high and low values, respectively, denote a high degree of confidence for the prediction.
of the input variables because the RAD measures were not normally distributed according to the results of a Shapiro test [27]. Furthermore, we performed the analysis of outliers, exploiting the Cook’s distance and performed a stability analysis to eliminate influential observations [28]. The results of performed SWLR are summarized in Table IV. We can observe that the model built by RAD measures are characterized by a Sig. F value less than 0.05, thus the resulted model is significant. However, the obtained R2 and F values are not so high. In particular, the results revealed that best effort predictors include Cla, the number of classes in the RAD, and Act, the TABLE IV R ESULTS OF SWLR FOR EACH DEPENDENT VARIABLE USING THE RAD
C. The obtained effort prediction model Before applying SWLR, we verified the following assumptions: (linearity) the existence of a linear relationship between independent and dependent variables; (homoscedasticity) the constant variance of error terms for all the values of independent variables; and (normality) the normal distribution of the error terms. We performed a log transformation
MEASURES
Dependent variable Effort
45
Independent variables Act Cla Intercept
R2
F
Sign. F (p-value)
0.233
3.65
0.041
TABLE V E FFORT PREDICTED
ID P1 P2 P3 P4 P5 P6
Number of participants 4 4 3 4 4 3
Act 2 2 1 1 2 3
Cla 31 9 7 45 22 23
Effort 56.53 43.01 49.13 74.13 52.40 47.39
Effort for participant 14.13 10.75 16.38 18.53 13.10 15.80
TABLE VI R EAL MEASURES AND E FFORT RESULTS
ID P1 P2 P3 P4 P5 P6
Number of participants 4 4 3 4 4 3
Act 2 2 1 1 2 3
Cla 31 35 7 30 44 23
Effort 56.53 58.06 49.13 67.77 61.080 47.39
number of use case actors, enabling the instantiation of the equation as follows: Ln(Effort) =
The final estimation model, when transformed back to the raw data scale, gives the following equation: 0.272
Real effort for participant 11.25 24.75 13.67 17.25 15.00 16.33
have to be augmented to reach the required effort, while P4 has to be reduced. The new versions of the RAD of these 4 projects have been analyzed and the results are in Table VI, together with the real effort. As it is possible to note, projects P4 and P5 reached a real effort near 16, while P2 dramatically exceed the estimation. Except P2, the other 5 projects respected the established time constraints.
0.272 ⇤ Ln(Act) + 0.221 ⇤ Ln(Cla) + 3.465
Effort = Act
Effort for participant 14.13 14.52 16.38 16.94 15.27 15.80
⇤ Cla0.221 ⇤ 31.96
VI. C ONCLUSION AND D ISCUSSION In this paper we proposed to apply software estimation methods to the assignment of project works in mobile app development learning activities, specifically for Android application using a back-end server. The model has been created considering the data of the projects of year 2015 and has been applied to the RAD measures of the projects of year 2016. On the base of these measures, some adjustment of the project requirements have been done. The final estimation results on six projects were good for five of them, except for project P2, which doubled the required time to accomplish it. To better understand the reason why P2 was out of time we examined the type of the various applications. While P2 was a game with synchronization features, the others were dynamic web applications with Android interface and access to native features, e.g., an app which provides locationbased search on swimming pools and events related to sea competitions. The servers-side of P2 was more complicated because of the need of connecting two players together in a single game session and transfer data messages between connected players. Thus, the metric values reported in this paper seems not to be effective for application with synchronization needs, considering the background of the students. This approach may be useful to a teacher when it conducts the same type of course over the years. May be that when the project dataset grows collecting the data from different years the prevision may become more accurate. These considerations have to be confirmed by further work performed by
A plausible justification for this outcome is that the number of classes in a RAD represents the basis for the next phases of the development process. That is, a developer uses these classes as starting point for implementation. Therefore, it seems reasonable that Cla provides useful information for an accurate prediction of the effort to implement apps. Furthermore, the number of use case actors give an indication of those interacting with the app, which is a crucial aspect for this kind of software. V. M ODEL APPLICATION The successive edition of the MAD course was conducted with the same approach. Participants were 22. They were grouped in six teams. The data from the RAD have been collected as described in Section IV-A. We examined them and on the basis of the effort prediction measures, we proposed some little adjustments to the requirements concerning functionalities to be implemented as new classes. The number of participants for each team is reported in Table V, together with the number of actors and classes taken from the RAD and the estimated effort required for the project and for each participant. Let us assume that students work consecutively for three hours. This assumption is due to the fact that students follow also other courses and have only the afternoon free. Thus, the number of days to dedicate to the project implementation is 16. From these results it is possible to see that P1, P3 and P6 effort predictions are near to 16 days and we decided to leave them as they are; P2 and P5
46
collecting data of the successive MAD courses. In addition, a much deeper analysis and setting of groups’ composition should also be part of a larger, extended and deeper experiment which may consider also different variables, such as the composition of programmers’ teams, gender, previous background and motivation. These could be other factors affecting final results which can be examined in future investigations.
[17] B. A. Kitchenham, E. Mendes, and G. H. Travassos, “Cross versus Within-Company Cost Estimation Studies: A Systematic Review,” IEEE Transaction on Software Engineering, vol. 33, no. 5, pp. 316– 329, 2007. [18] M. J. Shepperd and G. F. Kadoda, “Comparing Software Prediction Techniques Using Simulation,” IEEE Transaction on Software Engineering, vol. 27, no. 11, pp. 1014–1022, 2001. [19] E. Mendes and N. Mosley, “Bayesian Network Models for Web Effort Prediction: A Comparative Study,” IEEE Transaction on Software Engineering, vol. 34, no. 6, pp. 723–737, 2008. [20] J. Ceddia and M. Dick, “Automating the Estimation of Project Size from Software Design Tools using Modified Function Points,” in Proceedings of the Sixth Australasian Conference on Computing Education, vol. 30, pp. 33–39, Australian Computer Society, Inc., 2004. [21] B. Bruegge and A. H. Dutoit, Object-Oriented Software Engineering: Using UML, Patterns and Java, 2nd edition. Prentice-Hall, 2003. [22] C. Harpham and R. L. Wilby, “Multi-site Downscaling of Heavy Daily Precipitation Occurrence and Amounts,” Journal of Hydrology, vol. 312, no. 1, pp. 235–255, 2005. [23] T. J. Hastie and D. Pregibon, Generalized Linear Models. Wadsworth and Brooks/Cole, 1992. [24] V. R. Basili, L. C. Briand, and W. L. Melo, “A Validation of ObjectOriented Design Metrics as Quality Indicators,” IEEE Transaction on Software Engineering, vol. 22, no. 10, pp. 751–761, 1996. [25] T. Gyim´othy, R. Ferenc, and I. Siket, “Empirical Validation of ObjectOriented Metrics on Open Source Software for Fault Prediction,” IEEE Transaction on Software Engineering, vol. 31, no. 10, pp. 897–910, 2005. [26] G. Scanniello, C. Gravino, A. Marcus, and T. Menzies, “Class Level Fault Prediction Using Software Clustering,” in Proceedings of the International Conference on Automated Software Engineering (ASE), pp. 640–645, IEEE Computer Society, 2013. [27] S. S. Shapiro and M. B. Wilk, “An Analysis of Variance Test for Normality,” Biometrika, vol. 3, no. 52, 1965. [28] E. Mendes and B. Kitchenham, “Further Comparison of Crosscompany and Within-company Effort Estimation Models for Web Applications,” in Proceedings of the International Software Metrics Symposium, pp. 348–357, IEEE press, 2004.
ACKNOWLEDGMENT We thank all the students to the two courses and the IT managers, who judged the apps these students developed. R EFERENCES [1] K. Molokken and M. Jorgensen, “A Review of Software Surveys on Software Effort Estimation,” in Proceedings of the International Symposium on Empirical Software Engineering (ISESE), pp. 223–230, 2003. [2] R. Francese, C. Gravino, M. Risi, G. Scanniello, and G. Tortora, “On the Use of Requirements Measures to Predict Software Project and Product Measures in the Context of Android Mobile Apps: A Preliminary Study,” in Proceedings of the 41st Euromicro Conference on Software Engineering and Advanced Applications (EUROMICROSEAA), pp. 357–364, 2015. [3] P. C. Blumenfeld, E. Soloway, R. W. Marx, J. S. Krajcik, M. Guzdial, and A. Palincsar, “Motivating Project-Based Learning: Sustaining the Doing, Supporting the Learning,” Educational psychologist, vol. 26, no. 3-4, pp. 369–398, 1991. [4] J. R. Savery and T. M. Duffy, “Problem Based Learning: An Instructional Model and its Constructivist Framework,” Educational technology, vol. 35, no. 5, pp. 31–38, 1995. [5] L. K. Michaelsen, A. B. Knight, and L. D. Fink, Team-Based Learning: A Transformative Use of Small Groups. Greenwood publishing group, 2002. [6] L. Vygotsky, Thought and Language. MIT Press, 2012. [7] M. Bielikov´a, “Experiences with Designing a Team Project Module for Teaching Teamwork to Students,” Journal of computing and information technology, vol. 13, no. 1, pp. 1–10, 2005. [8] W. Humphrey and J. Over, Leadership, teamwork, and trust: Building a competitive software capability. Addison-Wesley Professional, 2010. [9] M. E. Joorabchi, A. Mesbah, and P. Kruchten, “Real Challenges in Mobile App Development,” in Proceedings ACM / IEEE International Symposium on Empirical Software Engineering and Measurement (ESEM), pp. 15–24, ACM Press, 2013. [10] S. Kizaki, Y. Tahara, and A. Ohsuga, “Software Development PBL Focusing on Communication Using Scrum,” in Proceedeings of the IIAI 3rd International Conference on Advanced Applied Informatics (IIAIAAI), pp. 662–669, 2014. [11] B. Silva and P. Gir˜ao, “A Study and a Proposal of a Collaborative and Competitive Learning Methodology,” in Proceedings of the IEEE Education Engineering (EDUCON), pp. 1011–1018, 2010. [12] L. M. Regueras, E. Verd´u, M. J. Verd´u, and J. P. De Castro, “Design of a Competitive and Collaborative Learning Strategy in a Communication Networks Course,” IEEE Transactions on Education, vol. 54, no. 2, pp. 302–307, 2011. [13] J. C. Burguillo, “Using Game Theory and Competition-Based Learning to Stimulate Student Motivation and Performance,” Computers & Education, vol. 55, no. 2, pp. 566–575, 2010. [14] S. Yadav and J. Xiahou, “Integrated Project Based Learning in Software Engineering Education,” in Proceedings of the International Conference on Educational and Network Technology (ICENT), pp. 34– 36, 2010. [15] R. Francese, C. Gravino, M. Risi, G. Scanniello, and G. Tortora, “Using Project-Based-Learning in a Mobile Application Development Course - An Experience Report,” Journal of Visual Language and Computing, vol. 31, pp. 196–205, 2015. [16] L. Briand and I. Wieczorek, Resource Estimation in Software Engineering. Encyclopedia of Software Engineering, John Wiley & Sons, Inc. All, 2002.
47