Supporting the Design of an Inland Container Terminal through Visualization, Simulation and Gaming Wieke Bockstael-Blok*, Igor Mayer**, Edwin Valentin*** Faculty of Technology, Policy and Management, Delft University of Technology, PO BOX 5015, 2600 GA Delft, The Netherlands; *
[email protected] (+31)152786363; **
[email protected] (+31)152787185; ***
[email protected] , (+31)152783440
Abstract The planning and design of an inland container terminal is a complex task due to many interrelated design parameters and interdependent stakeholders. Design tools may support the optimization of technical, economic and logistical values, but this optimization is strongly inhibited by conflicting interests, political and environmental boundaries and strategic stakeholder behavior. The main research question in this contribution is: how can visualization-simulation tools be used in an early stage of complex inter-organizational decisionmaking on infrastructures in such a way that it enhances the quality and progress of this decision-making? A collaborative design environment was developed for the early phase of inter-organizational decision-making. In the gaming-simulation 'Containers a drift' a number of public and private stakeholders try to reach initial agreement on an inland container terminal. A team of process-managers facilitate a collaborative design process and set up a number of ground rules for negotiation. A visualization-simulation tool is used to explore the various technical, economic, political and spatial issues. While negotiating on issues such as location and size of the terminal, small groups of stakeholders interactively draw several terminal layouts. Logistical and economic data, e.g., on ships, containers and costs are entered in a database. The terminal's performance and its dynamic behavior is simulated and assessed. The game was played in three sessions with a total number of 77 students. The evaluation results indicate that the various tools are easy to work with, greatly contribute to the quality and process of negotiation and generate mutual understanding.
1. Introduction The planning and design of infrastructures, such as railroads, business parks and utility networks, is a complex task due to a large number of interrelated design parameters and mutually dependent public and private
stakeholders. Possible stakeholders such as local, regional and national public authorities, infrastructure operators, (potential) customers, logistical, transportation and shipping companies, residents and environmental associations, constitute an inter-organizational network. [1]. The actors are mutually dependent, but will most likely have different perceptions, interests, values and objectives. As a consequence the optimization of technical, economic and logistical values will strongly be inhibited by conflicting interests, political and external boundaries and strategic stakeholder behavior. Visualization and simulation can contribute to the initial design phase of complex infrastructures. Visualizations of a system, such as sketches or layouts, and simulation models, expressing a system’s dynamic characteristics, communicate the complexity of the system, show the consequences of options and place a design in its future environment. Important questions can be raised however, on how collaborative visualization and simulation can be embedded in an inter-organizational network and multi-actor negotiation process. Can visualization and simulation contribute to the quality and progress of negotiation for instance by facilitating the development of mutual understanding or a shared vision? In that case, what are the specific requirements and guidelines for using visualization-simulation tools in an inter-organizational context? What interactive procedures, programs and ground rules may guide such a collaborative vision development? The main research question in this contribution therefore is formulated as: how can visualizationsimulation tools be used in an early stage of complex inter-organizational decision-making on infrastructures in such a way that it enhances quality and progress of this decision-making? The structure of this paper is as follows: In section 2, we discuss the research approach. In section 3, the theoretical notions on decision-making in interorganizational decision-making are discussed in more detail. This leads to a number of general requirements for visualization-simulation tools used in such a setting.
Proceedings of the 36th Hawaii International Conference on System Sciences (HICSS’03)
0-7695-1874-5/03 $17.00 © 2002 IEEE
The gaming-simulation Containers a Drift and the visualization-simulation tool are detailed in section 4. In section 5, the results of three gaming experiments are discussed. The main conclusions are summarized in section 6.
2. Research approach To answer the aforementioned research question, a visualization-simulation tool and a gaming-simulation [2] were developed using the planning and design of a fictitious but realistic inland container terminal as a case. In the gaming-simulation Containers a Drift the participants play the role of stakeholders. They explore and negotiate on a container terminal design while using the visualization-simulation tool. Three gaming-simulation sessions were held with a total number of 77 participants. Participants were students who signed up for a voluntary part of a course in the faculty's third year curriculum. Students of the faculty of Technology, Policy and Management are relatively experienced in using computer software such as Excel and Arena but have much less experience with drawing in Visio, the drawing package used in the visualization tool. Only twelve percent of the students in the game indicated that they had no experience with simulation tools, but forty-three percent was not familiar with drawing in Visio. Students also follow theoretical courses in management and technological decisionmaking but have very little experience in management and facilitation combined with simulation. Each gaming-simulation session was evaluated extensively. Empirical data were gathered through: (1) observation of the group work during the game; (2) plenary debriefing after each game; (3) a written questionnaire filled out by the participants shortly after the game; (4) a written response by the participants to a few open questions. The participants were told that the experiences and results of the three pilot sessions are going to be used for further improvement of the game and tools. The students' positive or negative opinions about the game did not determine their grade. The response rate was 95%. The evaluation of the tool and the gaming-simulation sessions focuses on three main aspects: (1) the role of the visualization-simulation tool in an inter-organizational decision-making process; (2) the generation of some specific requirements for using such a tool; (3) some suggestions for refining the game and the visualizationsimulation tool for real life cases. The evaluation criteria regarding the visualization tool and the gamingsimulation were generally derived from notions on infrastructure design in inter-organizational settings (see below). In this contribution we will concentrate mainly on the requirements and performance of the tool in an inter-organizational setting.
3. Infrastructure design organizational networks
inter-
3.1 A process-oriented approach From a decision-making perspective, design situations can be characterized on two dimensions: (1) the degree of consensus on norms and values and (2) the degree of consensus on facts and causal relations [3]. Most commonly, the design and planning of complex infrastructures will score low on both dimensions, i.e., a strong disagreement between stakeholders on values and norms in combination with a great many uncertainties on facts and causal relations. These design situations are usually characterized as wicked or messy design problems [4]. The decision-making process under such conditions will most likely have a number of characteristics: (1) The planning and design process will be pluricentric in the sense that not one actor can dominate or monopolize the decision-making. (2) It will be dynamic in the sense that the perceptions of problems and solutions will change over time. Stakeholders will enter and exit the decision-making arena and the process will go by fits and starts. (3) Actors will behave strategically in order to optimize their own interests and values [1]. Whereas stringent project-management may become crucial in later stages of infrastructure design, the management of actor-relations and the negotiation process itself, is essential during the initial stages of the project. In order to avoid impasses and breach stalemates, an inter-organizational decision-making process must be carefully designed and managed. Such a processoriented approach to infrastructure design is based on four main design principles: (1) the process should be open for (participation by) the key stakeholders and the different perspectives on problems and solutions; (2) the core-values of these stakeholders, such as autonomy or commercial property rights, should be safeguarded and respected; (3) the design process should show progress and produce timely results; (4) the level of understanding and knowledge of the various stakeholders on the subject at hand should be raised by feeding information and analysis into the negotiation process [5]. In other words, during the early stages of infrastructure design an intricate balance is required between (1) the content of decision-making, for instance by providing the relevant factual information and assessments through analysis, and (2) the inter-organizational decision-making process, that can be characterized as participatory and safe, that shows progression, and integrates different sources of knowledge. An independent process-manager may design and facilitate the decision-making process, among others, by: (1) drawing up, in consultation with the stakeholders, a program with the various steps and rounds of decisionmaking; (2) drawing up, in consultation with the
Proceedings of the 36th Hawaii International Conference on System Sciences (HICSS’03)
0-7695-1874-5/03 $17.00 © 2002 IEEE
in
stakeholders, a number of ground rules, e.g., on conflict settlement or exiting the process, that will guide and control the interaction between the participants; (3) facilitating the process through constantly shifting from content to process and vice versa. Controversial issues can be put on an agenda via process rules that may formulate who, when and how the stakeholders are going to address these issues. When controversial issues are negotiated too early in the process it may easily lead to an impasse. It may turn out that when the issue is discussed later in the process, stakeholders have become more sensitive to the positions of other stakeholders, that the process provided interesting opportunities to make tradeoffs or even that the issue is no longer relevant. The process design and ground rules of course have to be managed continuously by the process-manager while the stakeholders negotiate and design [6]. But how could visualization-simulation play a part in such a process?
3.2 Coupling of decision-making process and visualization In our view, process-management and visualizationsimulation can be highly complementary. Visualization and simulation techniques can feedback information and analysis into an inter-organizational decision-making process. Process-management can provide guidelines and rules for a collaborative visualization and simulation setting. Collaborative visualization and simulation may contribute to openness among stakeholders for different perspectives and alternative solutions. At the same time, the simulation of alternative visions can constitute a 'reality check' and forces stakeholders to be explicit about their design choices and assumptions on causes and effects. The coupling of process-management and visualization-simulation for infrastructure design could lead to the following design procedure: (1) Process-managers draw up (in consultation with stakeholders) a program and a set of ground rules for the interactive design process; (2) Interacting groups of stakeholders draw visual representations of possible infrastructure designs; (3) Interacting groups of stakeholder negotiate on the important parameters for the design; (4) Interacting groups of stakeholders build and run the simulation model; (5) stakeholders assess the performance of the design; If deemed necessary, the stakeholders can go through the small cycle again from step 2 onwards, or go to the next stage (6) in which they identify the major decision points and controversies in the discussion. These issues can than be put on the common decision agenda. The stakeholders should further suggest procedural steps and rules for subsequent negotiation on these issues (going back to (1). If deemed necessary, stakeholders can go through the cycle again from step 2, now focusing on specific details or controversies in the negotiation.
Figure 1 portrays this cyclical decision-making and design process connecting the long cycle of process design and the short cycle of visualization-simulation for (infrastructure) design. 1. Draw up process structure and rules
6. Decision agenda
5. Assess design performance 3. Negotiate parameters
4. Build and run the simulation model
Figure 1. The cyclical decision-making and design process
3.3. Requirements for the tools In a study on a similar collaborative procedure, Maghnouji et al. [7] conclude that sketching, or visualization is an important element in stakeholder sessions. There is a high potential for using simulation building blocks for interactive modeling. However, the researchers also concluded that the amount of time that is needed to build, adjust and run a simulation model constitutes a major obstacle for collaborative stakeholder sessions. In real-life cases a short design cycle as sketched above, can take weeks or longer. The decision-making process then runs the risk of losing momentum. Stakeholders such as residents and environmental associations are likely to drop out. Specific requirements for the use of such tools in inter-organizational networks would therefore be that they are fast, easy to work with, can cope with information relevant to various stakeholders and support the negotiation process by generating mutual understanding about the issue. Faced with the challenge of increasing the speed and ease of the design cycle, we developed a visualizationsimulation tool that allows the stakeholders to go through the long cycle in about a day and several short cycles in half a day (cf. figure 1). A gaming-simulation environment provided us with a relatively safe but complex inter-organizational setting to test the workability and effectiveness of the approach and tools. In the next section the details of gamingsimulation and the tools will be presented.
Proceedings of the 36th Hawaii International Conference on System Sciences (HICSS’03)
0-7695-1874-5/03 $17.00 © 2002 IEEE
2. Draw visual representations
4. Gaming-simulation A gaming-simulation provides a safe environment, based on reality, in which participants can experiment with decisions and negotiations [2, 8]. At the heart of the game is a plot of events, called a scenario. The participants in a gaming-simulation play various ‘roles’ that are derived from existing organizations and individuals. In a number of rounds, the participants make decisions, form coalitions and make compromises based on their given and/or self-constructed goals and interests. One or more game moderators facilitate the game. A gaming-simulation is not primarily intended as a ‘game’ but rather as a serious, decision-oriented study, and is therefore also designated as a policy exercise [9]. Remarkably, gaming-simulation has characteristics of both an experimental research-design and interpretativeresearch and can be used for research as well as intervention and learning [8]. As a research design, a gamingsimulation has characteristics of an experiment: (semi) controlled conditions, repeatability of sessions, first hand observation and opportunities for pre-test/post-test measurements. In addition, it is an excellent stimulus for evaluative discussions with participants on the subject at hand. To explore and study the way visualizationsimulation tools can support the early phase of complex inter-organizational decision-making, we opted for the design of an inland container terminal as a case. A quick scan of the matter indicated that the issue of container terminal planning is high on the political agenda in The Netherlands and that it has sufficient complexity in terms of interdependent stakeholders and interrelated parameters. The characteristics of the important elements for a terminal design such as its location, the quays, roads, ships, trucks, cranes and containers, gave adequate opportunity to develop a sophisticated but usable visualization-simulation tool. The game design process largely followed the design steps as described by Duke [2]. A systems analysis of an inland container terminal was conducted by document studies, interviews and visits to existing container terminals. Technical, economic, financial and geographical data on container terminals were gathered and used for the game scenario, maps and tools. The gamingsimulation Containers a drift and the visualizationsimulation tool in it, are described in the following subsections.
4.1 Containers a Drift The game, Containers a drift, focuses on the early stage of decision-making about an inland container terminal to be located near the fictitious provincial town of Maaswijk. The objectives of Containers a drift as a training environment were defined as follows: (1) to provide a complex technical system design environment in which
participants - either students or real stakeholders - can experiment with a process-oriented management approach to a collaborative design process; (2) to provide a safe but complex social-political environment in which participants can learn and experiment with interactive and modular visualization-simulation tools; (3) to learn and reflect on the combination and integration of insights and techniques from process-management and systems design, both for academic research, teaching and support of real life design processes. Containers a drift can be played with 25-35 participants divided over 10 roles. The various stakeholders in the game are: the Ministry of Transportation, the container terminal operator Mega Container Terminal (MCT), the municipality of Maaswijk, the province of Noord-Brabant, a commercial bank, potential customers of the terminal such as Holland Food, an association of local residents, a local environmental group and various companies involved in shipping, logistics and transportation. Each role is played as a team by two to four participants. 4.1.1 The game scenario The game's scenario, or plot of events, describes the background of the case, the characteristics of the municipality of Maaswijk and gives an overview of the roles and the tasks and competencies of each role. By and large, the plot of the scenario is as follows. In recent years, a strong increase in the demand for transportation of goods has led to serious negative effects in terms of congestion and environmental damage. In its national freight policy, the Ministry of Transportation therefore enhances the development of inter-modal means of transportation. In the Netherlands this implies making optimal use of innovative combinations of waterway, railway and road transportation. Inland container terminals are an inevitable link in these inter-modal transportation chains. A policy-scan has shown that it is worth to explore the feasibility of an inland container terminal situated in a neglected harbor area near an important waterway and industrial zone in the town of Maaswijk. MCT, a large German container terminal operator, has showed interest in developing the project commercially. However, many local and regional actors are needed to realize the terminal. The terminal will have to be financed, it will have to meet customers demands, the municipality and province will have to approve and co-operate, local residents and environmentalists may obstruct and slow down the project by starting legal procedures. Task one: design of the decision-making process (the long cycle in figure 1) The Ministry of Transportation and MCT have therefore set up a joint project group. The process-managers of this project group are made responsible for the initial
Proceedings of the 36th Hawaii International Conference on System Sciences (HICSS’03)
0-7695-1874-5/03 $17.00 © 2002 IEEE
negotiation and information process with all important actors in the region. The process-managers are instructed in their role description that the general idea in this early stage of the project is to have a general and interorganizational exploration of the political, social, environmental, economic and logistical feasibility of the container terminal, so that a preliminary agreement - a go /no-go decision- can be reached among all actors for the next stage of design and decision-making. The process-managers are reminded that in this stage, the development of a shared vision of the container terminal and the identification of the items on the agenda, are crucial. Not all disagreements or problems have to be settled in this stage. No decisions on the definite design for the container terminal have to be made yet. Most main objectives for the process-managers are that conflicting interests and disagreements are recognized and put on a common agenda, that the various conditions for stakeholder cooperation are met, that stakeholders speak a common language and understand the basic implications for the design of a terminal, but, most of all that the necessary level of trust between stakeholders is reached. Task two: design and evaluate a terminal supported by the visualization-simulation tool (the short cycle in figure 1) The Ministry of Transportation will only subsidize the container terminal if a number of social, financial, economic and environmental criteria are met. At the end of the game therefore, the participants are required to present to the director-general of the Ministry of Transportation, a (few) design(s) of a container terminal, indicating its financial, logistical and environmental feasibility, as well as the level of support by the political and societal stakeholders. The designs of the container terminal are the result of a collaborative and interactive design process which takes place during the game using the visualization-simulation tool. In a covenant, the level of support for the container terminal and the continuation of the process has to be expressed by the stakeholders. The covenant specifies the agreements on procedure and project and sets the agenda for further negotiation. 4.1.2 The steps of play At the start of the game, the participants are briefed about the objectives and procedures of the game. The visualization-simulation tool they are going to use is demonstrated. The participants are given some time to read the manuals and role descriptions, prepare their role and discuss their stakes and interest with fellow team members.
Photo 1: Impression of the game The process-managers have the difficult task to draw up a process design for the negotiations and planning of the terminal. In this stage the emphasis lies on the procedure of the design - the how? - and not so much on the content of the decision - the what? In consultation with all actors the process-managers have to come up with a structure - or program - as well as some ground rules for the interactive design process of the terminal. Important questions for the process-managers in this stage are: Are all stakeholders actually going to use the visualizationsimulation tool or will only a few stakeholders use the tool, while others negotiate on other aspects without using it? Are the design teams going to be heterogeneous, i.e., mixing all sort of interests and stakeholders in a joint design session, or homogeneous, e.g., private companies in one team, residents and environmentalists in another team et cetera? How will small group sessions alternate with plenary sessions? How are the alternative designs of various design teams going to be compared? What ground rules between the players could be established to make sure: (1) that the design process safeguards important core-values of actors, e.g., confidential business information is protected; (2) that the process is open and transparent, e.g., that all stakeholders can participate fairly; (3) that the process shows progress, leading, for instance, to timely results; and (4) that the process is based on good information and knowledge, e.g., uses the right factual data and integrates various sources of information. In other words, the stakeholders in the game first have to agree on how they are going to design and use the visualization-simulation tools, i.e., design the decisionmaking and design process, rather than just start using the tool without careful deliberation. After initial consultation with all stakeholders, the process-managers present a draft process design. In a plenary session, the stakeholders may react and comment on this proposal and suggest adaptations. Only after the process design has been accorded, the participants proceed with the visualization and simulation of the con-
Proceedings of the 36th Hawaii International Conference on System Sciences (HICSS’03)
0-7695-1874-5/03 $17.00 © 2002 IEEE
tainer terminal design, following the accorded process structure and ground rules (see figure 1). The process design for this second part of the day varies from session to session but will likely be based on three to four design teams - each about eight participants - alternated with plenary discussions and presentations of intermediate results. In parallel, a covenant with agreements for the next stage - which will not be simulated during the gaming-simulation - is drafted. The designs and the covenant supported by the key stakeholders are presented to the director-general of the Ministry of Transportation. The game is than brought to an end, more or less at the start of a new decision-making and design cycle (see figure 1). The process and results are evaluated with the participants in a plenary discussion.
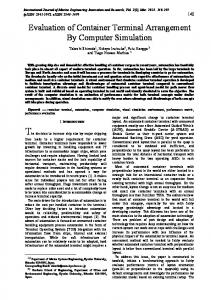
quay, cranes, storages, roads and parking lots for trucks. Through negotiations the stakeholders have to make trade-offs on the exact location of the terminal - in the north, middle of south of the search area - and the different options for all drawing blocks such as the type and number of cranes and the length of the quay. Figure 2, gives an example of a container terminal drawing.
4.2 The visualization and simulation design tool Two types of design tools are available during the game: (1) a Geographical Information System (GIS) containing all sorts of relevant data on the area of Maaswijk; (2) a visualization-simulation tool that is used to design and evaluate a design of a container terminal. 4.2.1 The geographical information system (GIS) Geographical maps and a GIS of an existing town situated along an important waterway in the south of the Netherlands, were used to make up the fictitious town of Maaswijk. The GIS and maps of Maaswijk can be consulted during the game in order to get relevant environmental and spatial data, such as on the depth of the harbor, land property, ecological or noise zones, housing areas, rules and standards, contaminated soils, et cetera. The map of Maaswijk was also used as background in the Visio drawing tool. 4.2.2 The visualization-simulation tool The visualization-simulation tool was tailor-made for the simulation game The tool was available for all roles on common laptops and at four modeling stations with fast computers and beamers. The decision when and how to deploy the tool was left to the players. The visualization-simulation tool consists of four parts: (1) a drawing tool for the general layout of the terminal; (2) a database containing information on essential building blocks; (3) a discrete event simulation tool for the evaluation of a terminal design on logistical parameters and (4) a spreadsheet for the presentation of performance indicators. (1) Drawing and sketching in Visio The participants start the design process by sketching the terminal lay-out in the computer software program VISIO 2000. The drawing tool contains a geographical map of the search-area where the terminal has to be located. Visio provides the participants with the following set of drawing blocks for a container terminal: a
Figure 2. Example of a terminal drawing (2) Making design choices in a database The next stage of the design process is the selection of preferences in the database. The database contains quantified information about vehicles, trucks, ships and customers. Through negotiations the stakeholders have to decide on important options for the design such as the type and number of vehicles, trucks and ships. Participants take into account their choices on cranes and the quay, made previously in the Visio-drawing. The participants have different preferences and need to make trade-offs, for instance, on their choice of ships taking into account that ships have different ship sizes and schedules. A ship schedule in combination with ship size, the number of cranes and storage capacity influence the maximum number of customers the container terminal will be able to handle. (3) Developing and running a discrete event simulation The computational model is based on interrelated logistical and operational processes which determine the terminal's performance. To give an example: when the number of trucks is not sufficient to transport the containers to a company, too many containers will stay in storage. New containers can not be moved out of a ship
Proceedings of the 36th Hawaii International Conference on System Sciences (HICSS’03)
0-7695-1874-5/03 $17.00 © 2002 IEEE
and therefore new ships cannot arrive. The lead time of river transport will strongly increase. The exact relation between decisions and effects is hard to predict, due to the dynamic character of the interaction. Discrete event simulation [10] is used to get insight into a terminal design's performance. Under normal conditions, the development of discrete event simulation model will take too much time for a gamingsimulation. Depending on the level of detail it may take several weeks [11]. The simulation building block approach used for the game should allow the stakeholders to develop a discrete event simulation model in about fifteen minutes. The simulation building blocks approach is based on objectoriented concepts and reusability of small model parts [12]. The simulation design tool for Containers a drift uses fifteen different simulation building blocks, exactly matching the Visio drawing blocks. Several control mechanisms organize the simulation process so that a simulation model is generated and executed more or less automatically. The model simulates about 22 days of the terminal in operation and subsequently generates information on a great many performance indicators such as lead times, waiting times, utilization of quays, queue length, but also information on emissions and noise. (4) Performance of the design in excel In the last stage of the visualization and simulation cycle, the outcomes of the simulation model are presented in a customized Excel-sheet. The indicators are grouped in financial, logistical and environmental indicators. The main financial indicators are costs, revenues and required investments. The logistical indicators show the level of utilization of vehicles, parking lots, storages, trucks, ships, quays and cranes. In addition it shows queue lengths, waiting times and lead times of various links in the inter-modal chain of container movements. The four different tools described above are connected together with the use of Visual Basic for Applications. The visualization and simulation design environment was tested prior to the game. It showed stable performance. In a single user version, it allowed us to go through the whole process of drawing, running and evaluating a simple container terminal design in about 5 minutes. We assumed that during the game, interacting groups of stakeholders would be able to make and run a simple design in a quarter of an hour.
4.3 Expectations about the use of the tool in the game It was assumed that the tool would be fast and easy to use and would speed up the early phase of the infrastructure design process. The tool should enable the participants to go through the long simulation cycle in
one day and several small cycles in half a day (Ctf figure 1). An important question was whether the participants would be able to structure these design cycles themselves and if so, what this structure would be. What rules of interaction would they formulate to facilitate this process? It was furthermore assumed that the use of the tool would enhance mutual understanding by the stakeholders about their different interests and perceptions. This should contribute to the development of mutual trust. It was further expected that the process structure and agreements in combination with the visualizationsimulation tool would lead to a number of tentative but high quality terminal designs. The evaluation of these alternative designs would lead to new insights about what the important decisions and possible impacts of a container terminal are. These decisions and impacts can than be put on a common decision agenda at the end of the game. The use of a visualization-simulation tool in interorganizational decision-making however can also have a number of reverse effects. Possible disturbing effects on the quality of the decision-making process are: (1) the model may over-dominate the negotiation process e.g., important issues that can not be simulated are pushed off the agenda; (2) the pre-fixed drawing and building blocks in the tool may limit creativity and inhibit (radical) innovations in the design; (3) actors may use the tool strategically, e.g., they may withhold or manipulate crucial information.
5. Results and discussion The most relevant findings regarding the use of the visualization tool in the inter-organizational gamingsimulation setting are presented and discussed in this section.
5.1 The process design It was expected that the process-managers would be able to facilitate the stakeholders to an agreement on the program and rules well before lunch. This proved a serious but interesting miscalculation of the game designers. In all three sessions, the process-managers needed a lot of time to reflect on how they were going to design the process. This may have been caused by the students' inexperience with facilitation and process-management. The process-managers however immediately adopted a very closed attitude towards the stakeholders. They strongly focused on content and details, instead of putting the big issues on the agenda. They seemed very reluctant to go and talk with the stakeholders about the process. While the process-managers hardly divided any tasks within the team and were internally oriented, many important stakeholders felt neglected and already started
Proceedings of the 36th Hawaii International Conference on System Sciences (HICSS’03)
0-7695-1874-5/03 $17.00 © 2002 IEEE
to explore their own container terminal design. In some cases, coalitions were about to be formed and dissenting stakeholders were already put aside. These actors started complaining to the process-managers. In all three sessions, the game moderators were forced to push the process-managers along. An hour before lunch, the process-managers were ready to present a draft process design with some rules for interaction. Subsequently, the draft proposals in all three sessions led to fierce debate and resistance by the stakeholders. In a plenary session they raised many objections to the process design for instance on the compositions of the design teams, the type of designs they were going to make and how these design would be assessed. At some times, the process-managers were drowning and were struggling to stay in charge. The plenary session before lunch however greatly contributed to the understanding of the participants on what they were doing and how they could best use the visualization-simulation tool. In all three games, a workable and effective process design was accorded. The process designs of the three sessions differ with regard to the grouping of stakeholders, homogenous groups versus heterogeneous groups, and in the design themes given to the various groups. During the afternoon, parallel subgroup sessions were organized in which most participants took part, following the accorded process design. At the end of the day, the various results were presented. Due to time pressure, in none of the three gaming sessions, the stakeholders were able to draft a covenant. The process-managers in stead asked the participants to go back to their 'office' and answer in their team one of the following questions: 'Yes, we will support and co-operate in the next phase on the condition that....!' or: 'No, we will not support and co-operate in the next phase because...'. The processmanagers were asked by the game moderators to think about what they could do if one or more stakeholders would indicate that he/she would not accord with the terminal plans and exit the process. When all participants had presented their 'conditional yes' or their 'argued no', the process-managers formulated their conclusion to the group. In all three sessions, the participants agreed to support the terminal and participate in the next stage of design.
5.2 The use of the tools During the morning part of the gaming sessions, many participants already started to negotiate and design. Due to ineffective process-management the discus-
sions in the morning appeared unstructured and unfocused. The level of information in these discussions was low. After the process-managers regained their grip on the process, the discussions in the afternoon were centered around the visualization-simulation tool in multiactor teams. Following the order of the tool, the stakeholders discussed and negotiated on the location of the terminal, the length of the quay, the amount and type of cranes, the size and height of the container-stacks, the location of the parking spots, the number of ships, the type of vehicles and, finally, the customers and the financial values. Other points of discussion such as the width of the ships lock, noise-levels, the ecological zone and the yacht harbor were identified and put on the agenda. It was expected that the tool would enable the design teams to make a general design of a container terminal in about a quarter of an hour. In the afternoon session each design team would have time to go through several design cycles (cf. figure 1) thereby enhancing learning. The respondents afterwards estimated that the design cycle time had been between 60 and 90 minutes for the first session, and just below 60 minutes for the later sessions because more powerful computers were used. Two factors slowed down the short design cycle considerably: (1) actors, rightfully, needed much time to negotiate and make compromises, but they were also (2) reluctant to experiment with the tool by first going through a short design cycle, test some assumptions and see what would happen. Most groups tried to optimize every stage and decision before going to the next stage. This usually did not contribute to the duration and the quality of the discussions. At the end of all three gaming sessions, all design teams were able to present a container terminal lay-out with detailed assessments of its performance and consequences. The final comparison of the container terminal designs was done in a plenary discussion facilitated by the process-managers. The discussions usually ended in interesting and in depth debriefing discussions on process-management and the role of visualization and simulation tools.
5.3 Findings of the evaluation By and large, the questionnaires confirmed many of our positive observations on the use of the tool. Table One below presents the responses on a number of relevant questions of the evaluation questionnaire.
Proceedings of the 36th Hawaii International Conference on System Sciences (HICSS’03)
0-7695-1874-5/03 $17.00 © 2002 IEEE
Statement
n
1
2
3
4
0
Avg
Std
1.
72
64
26
8
1
-
1.5.
0.7
65
62
32
3
2
2
1.4
0.6
73
25
43
20
4
7
1.9
0.8
72
11
26
31
22
10
2.5
0.9
73
51
34
12
1
1
1.6
0.8
73
41
40
16
3
-
1.8
0.8
73
40
34
21
6
-
1.9
0.9
50 47 55
54 53 40
30 34 46
12 11 15
4 2 0
0 0
1.7 1.6 1.8
0.7 0.6 0.6
55
36
40
24
0
0
1.9
0.7
The Visualization-simulation tool as a whole was a good support in making a terminal design. 2. Working together with persons from other roles on making the layouts and entering logistic data with the tool contributed to generating mutual understanding. 3. The tool had a positive effect on the quality of the terminal design that was the outcome of negotiations at the end of the day. 4. The pre-set selections when entering logistic data in the database tool and the limited set of drawing elements in the drawing tool, limited me in making the design of the terminal the way I wanted. 5. The evaluation of terminal performance of various designs was well supported by the visualization-simulation tool. 6. The use of the visualization-simulation tool sped up the design process that took place during the day. 7. Making designs (consisting of layout, logistic data and output on terminal performance) with the tool went fast enough in relation to the progress of the game. 8. It was easy to work with the drawing tool. 9. It was easy to work with the database tool 10. It was easy to understand how to work with the output files in the spreadsheet tool. 11. The presentation of terminal performance in the output files in the spreadsheet tool was clear.
Table 1. Responses of participants to statements in the questionnaire By and large the responses indicate the following (Ctf Table 1): −
− −
−
High participation. Seventy-eight percent of the respondents actively participated in making a design with the tool. The remaining students actively engaged in other activities such as facilitation of the process and discussions of external environmental - aspects of the terminal. Easy to work with. Eighty percent or more of the respondents found the drawing, database and the output files easy to work with (cf. Table 1). Mutual understanding. Eighty-nine percent of the respondents state that they worked together with people from other roles with the design tool. Ninety-four percent of the participants agreed (a little) that working together with persons from other roles contributed to mutual understanding. Short design cycle. About eighty percent of the respondents indicated that the tool sped up the design process and that the making of designs with the tool went fast enough for the game.
5.4 Limitations of the tool A number of expected reverse effects of the tool were also substantiated. Some respondents indicated that the tool had been too detailed and generated too much information on the terminal performance. Other participants however indicated that they needed more specific data on specific indicators to base their decision. Some respondents stated that the tool dominated the discussion, that the use of the tool was fun, but in fact less relevant for stakeholders such as environmentalists and residents. Moreover, a marked number of respondents (thirty-eight percent) seemed to indicate that the drawing elements in the drawing tool somewhat limited the making of a creative design (Ctf Table 1).
6 Conclusion The gaming-simulation Containers a drift proved a well balanced research and training environment for combining process-management and visualization and simulation. It confirmed that process-management is a highly complex activity requiring group facilitation skills, academic insights in inter-organizational decisionmaking and experience with appropriate visualizationsimulation tools [13]. In the early stage of infrastructure design, stakeholders easily fall into the trap of focusing on content before agreeing on process. This is likely to
Proceedings of the 36th Hawaii International Conference on System Sciences (HICSS’03)
0-7695-1874-5/03 $17.00 © 2002 IEEE
backfire in later stages of the project. Stakeholders should be consulted and included in setting the agenda and defining the rules and procedures. In all three sessions, the highly conflictual and confusing discussions of the morning sessions, eased down when consensus was reached about how they were going to design and explore the issues further (just before or after lunch). Through the conflicts the partcipants internalized the design process and some ground rules were established. The accordance reached on the process and the opportunity to discuss and visualize their conflicting interests with respect to the container terminal while using the fast and easy to use simulation tool, led to a more constructive exploration of the issues and solutions. In our view, the experiment confirmed that a processmanagement approach to decision-making processes needs analytic activities, such as visualization and simulation, to reach a higher level of mutual understanding. And vice versa that visualization-simulation needs reflective activities for instance on why, how, by whom and by what rules the tools are going to be used. Visualization-simulation tools are useful but should be flexible, robust, fast and open to different perceptions and interests. The visualization-simulation tools developed for the game Containers a drift was evaluated on a number of relevant characteristics for processmanagement. The evaluation results are promising and show that the tools are fast, easy to work with, contribute to the quality and process of negotiation and generate mutual understanding. The tools and the gaming-simulation were of course a pilot version. Using the many useful suggestions for improvement, the simulation game will next be used in our faculty's Master of Science course on general design methodology as well as for academic research and consultancy projects. An important point for discussion of course is whether a gaming-simulation can be an adequate representation of the real complexity and politics of interorganizational decision-making on infrastructures. This is a relevant question because the way of working and the tools used in the gaming-simulation should be transferable to real stakeholders and real design challenges. A similar representation question is whether the visualization-simulation tool can represent or model inland terminals in a sufficiently realistic way. The tool appeared to be sufficiently rich and realistic for the gaming-simulation when played with students. For future experiments with players that are professionally involved with inland container terminals or other infrastructures, the tools will have to be validated more extensively. The experiments of the gaming-simulation however provide a promising basis to improve and adapt the tools and try them out with real stakeholders and real problems.
Acknowledgements The authors want to thank Weiyu Du, Anne Elshout, Joost van Kempen and Bart van den Berg for the work they have done to make the game and tools a success. The authors are grateful to the IMAGO-Gymnasion project of the Technical University of Delft for funding the experiment. More information about Containers a Drift, a video-demo of the computer model and general information on gaming-simulation at Delft University of Technology can be found at www.gymnasion.tudelft.nl.
References 1. 2. 3.
4. 5.
6. 7. 8. 9. 10. 11. 12. 13.
De Bruijn, H., Heuvelhof, E. ten. (2000) Networks and Decision-making. Utrecht: Lemma. Duke, R (1980). A paradigm for game design. in: Simulation and Games, 11, 364-377 Hischemöller, M., Hoppe, R. (1996) Coping with intractable controversies: the case of problem structuring in policy design and analysis. Knowledge and Policy: The International Journal of Knowledge Transfer, 8,4: 40-60. Mason, R. & Mitroff, I. (1981) Challenging strategic planning assumptions. theory, cases and techniques. New York: John Wiley & Sons. De Bruijn, H., Heuvelhof, E. ten , In ‘t Veld, R. (2002) Process Management. Why Projectmanagement fails in complex decision-making processes. Kluwer Academic Publishers. Bockstael-Blok, W. (2001); Chains and networks in Multimodal Passenger Transport; exploring a design approach; PhD-thesis; Delft, DUP Science. Maghnouji, R., et al. (2001) ; Collaborative Simulation Modeling : Experiences and Lessons Learned, Proceedings HICSS 2001 Geurts, J. Joldersma, F. Roelofs, E. (eds.) (1998) Gaming/simulation for policy development and organizational change. Tilburg: TUP. Toth, F. (1998); Policy exercises, in Simulation and Gaming (19), pp235-276. Law, A.; D.W.Kelton (1999); Simulation Modeling and Analysis; McGraw-Hill, 3rd edition Banks, J. (1998); Handbook of simulation, Principles, Methodology, Advances, Applications and Practice; John Wiley & Sons. Valentin, E.C.& A.Verbraeck (2002); Simulation using building blocks in: F.J.Barros, N.Giambiasi Proceedings conference on AI, Simulation and Planning, pp65-71. Vennix, J. (1996); Group model building. facilitating team learning using system dynamics. Wiley Chichester.
Proceedings of the 36th Hawaii International Conference on System Sciences (HICSS’03)
0-7695-1874-5/03 $17.00 © 2002 IEEE