The algorithm re- lies on efficient baseband magnitude-based Doppler estima- tion, preventing the estimate from possible biases like azi- muth ambiguities and ...
SURFACE CURRENT RETRIEVAL FROM TERRASAR-X DATA USING DOPPLER MEASUREMENTS Cristian Rossi, Hartmut Runge, Helko Breit, Thomas Fritz Remote Sensing Institute, German Aerospace Center (DLR), Oberpfaffenhofen, Germany ABSTRACT The purpose of this paper is to investigate the estimation of surface currents directly on stripmap TerraSAR-X data, as an alternative to Along Track Interferometry. The algorithm relies on efficient baseband magnitude-based Doppler estimation, preventing the estimate from possible biases like azimuth ambiguities and strong target reflections. The validation of the algorithm is made with acquisitions over the Elbe estuary river in Germany and the Eyjafjallaj¨okull volcano in Iceland. Index Terms— Surface Currents, SAR, TerraSAR-X, Doppler Shift Processor, Eyjafjallaj¨okull glacier run
2. DOPPLER SHIFT RETRIEVAL FROM FOCUSED DATA
In Fig.1 the TerraSAR-X Doppler-Shift Processor block diagram is shown. It is composed by five processing blocks, providing as output the velocity map. Firstly, azimuth spectrum preserved focused data is generated (Sec. 2.1). Then, a cleaning processing, composed by an azimuth ambiguity filtering and a strong target rejection, is performed to preclude biases in the Doppler shift estimation (Sec. 2.2). Finally, the Doppler shift is estimated taking as possible input a water mask (Sec. 2.3).
1. INTRODUCTION Common techniques to measure surface currents are HF radars, acoustic Doppler profilers, surface drifters or satellite altimetry. It has also been demonstrated that spaceborne Synthetic Aperture Radar (SAR) data is suitable for this kind of measurements, providing a global coverage thus a high potential [1]. A current, as a moving ensemble of scatterers at the water surface, causes a Doppler frequency shift of the backscattered signal making straightforward a line-of-sight velocity retrieval; the Doppler velocity can then be related to the geophysical parameters describing the surface wave motion [2]. Two different techniques have been used for the estimation of the surface currents: direct Doppler measurements [3] and Along Track Interferometry (ATI) [2]. On the one hand, ATI is a powerful technique for the detection of moving targets in SAR images but it requires two separate antennas and two receiver channels. The operational unavailability of this mode in most of the SAR satellites hampers the use of the ATI technique. On the other hand, Doppler shift can be estimated directly from any single channel data. In this paper a processor based on a spectral analysis of focused SAR data, opportunely pre-processed, is described. Section 2 deals with the algorithmic description of the novel processor; results from the Elbe estuary tidal currents and the Eyjafjallaj¨okull glacier run are shown in Section 3.
Fig. 1: Block diagram of the Doppler shift processor.
2.1. Spectral Preserving Azimuth Focusing The azimuth spectrum S (f ) of the target response after SAR data acquisition may be written as: ) ( πf 2 (1) S (f ) = G (f ) · R (f ) · exp − j fR where G (f ) represents the azimuth antenna pattern, fR the actual Doppler rate and R (f ) the scatterer reflectivity. The range migration term is not considered. The focused response is obtained applying to Eq. 1 the equivalent TerraSAR-X focusing term: ( ) W (f ) πf 2 · exp j H (f ) = (2) G (f ) fˆR where W (f ) is the azimuth processing window (a Hamming window) and fˆR the Doppler rate computed in the TerraSARX Multimode SAR Processor (TMSP). The focused azimuth spectrum U (f ) is then given by: ( �) � 1 1 2 (3) − U (f ) = R (f ) · W (f ) · exp jπf fR fˆR Although the azimuth spectrum in Eq. 3 completely fulfills the TerraSAR-X radar performance requirements (Peak Sidelobe Ratio, Integrated Sidelobe Ratio, etc.), it is not suitable for a Doppler analysis as the original spectrum (Eq. 1) is modified by the processing. An unweighted matched filter azimuth focusing transfer function is then applied to the range compressed data, for the preservation of the spectral properties: ( ) πf 2 H (f ) = exp j (4) fˆR The processor assumes the stationarity of targets during the acquisition yielding an uncompensated phase for moving targets, which line of sight velocity can be estimated through the caused Doppler shift. The new focused data has worse radar performances than standard data (Eq. 3) but it is suitable for a Doppler analysis. A drawback of this special processing is the increase of the azimuth ambiguities, a topic discussed in the next section. 2.2. Azimuth Ambiguities and Strong Target Rejection Azimuth ambiguities arise from finite sampling of the azimuth frequency spectrum at the pulse repetition frequency (P RF ). In our processing the Azimuth Ambiguity to Signal Ratio (AASR) is higher than the one measured in standard TerraSAR-X data due to the lack of the azimuth processing window, not considered in the azimuth focusing step for the
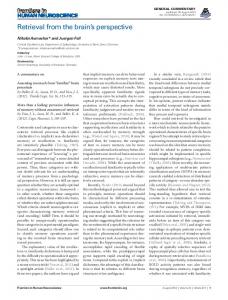
Fig. 2: Theoretical Azimuth Antenna Pattern (AAP) and first left and right replicas due to the sampling at P RF , assumed 4Khz. The Doppler centroid is 0 Hz; the shaded area is the processed bandwidth. The implemented filter reduces the ambiguities energy, which is maximum for this simulation at ±P RF/2.
preservation of the acquired raw spectrum. The effect of ambiguities on azimuth spectrum is an additional contribution depending on the system parameters (the ambiguity spectrum, see Fig. 2), impacting on the Doppler estimation with a bias. For this reason a filter is a key step, especially for estimations in coastal regions or in river areas, strongly affected by this phenomenon. For minimizing the impact of the filtering on the azimuth spectrum of the region to consider, a space varying filter, just on the ambiguity positions, is applied, with an approach similar to the one in [4]. The output of the filter is a cleaned image, with the only disturbing signatures recognized as ships or, generally, strong targets. Since the objective of the processor is the current speed trend, these targets are removed with a detection from a multi-looked image and a replacement with the median of the window used for the detection (about 100x100 meters). This processing is made only in water regions; to this end the detector ingests a water mask computed from an extern database [5]. The final output is an image suitable for a Doppler analysis. 2.3. Doppler Shift Estimation For the estimation of the Doppler centroid an approach that looks for the the frequency of the peak of the azimuth magnitude spectrum is used. The observed spectrum is averaged over a certain number of range cells: a window of (Naz , Nrg ) samples is exploited for the estimation at every data sample. The impact of the window size on the estimation is outlined in [6]: a large azimuth/range window provides better estimates, with the lowest variance, but it should not be too large in river areas since in a SAR image they don’t spread over so many pixels. A compromise is then needed and a window size has to be studied a-priori, depending on the scene properties. A 4th-order model is used for the spectrum fitting and the estimation is refined through a parabolic interpolation. The root
mean square error is an output parameter stating the goodness of the model; it can be seen as a ”quality parameter” of the estimation. The reference Doppler centroid is computed from the satellite orbit, attitude and beam steering: fDref = −
2vrel λ
(5)
where vrel is the difference between the satellite and target’s velocities, computed after their projection upon the the radar view vector. This measure is affected by pointing errors: any mispointing of the antenna may lead to a shift of the Doppler centroid. TerraSAR-X introduced a new method, named Total Zero Doppler Steering, for reducing the Doppler centroid to 0 Hz, with a nominal accuracy of ±100 Hz. The measured accuracy is however well beyond this value (about ±16 Hz), as demonstrated in [7]. In the processor, the variations of the centroid due to the attitude control loop are followed using the product annotations and the additional Doppler shift caused by mispointing errors is corrected with estimations over land (where Doppler shift should be zero). The line-of-sight velocity of surface currents projected on the water surface is easily derived from the Doppler shift definition: λ∆fDC (6) vg = 2 sin θ where ∆fDC is the estimated Doppler shift and θ is the radar look angle.
(a) MultiLook of the spectral preserved focused image.
(b) Azimuth ambiguities mask.
3. RESULTS The first test-site considered is the Elbe estuary, located in the north of Germany. It is chosen for its strong currents mostly caused by a mix of three phenomenons: tides, winds and river flow. The scene analyzed is a stripmap TerraSAR-X acquisition made on October 26th, 2008 over this area. This acquisition was made about two hours after the low tide, in a normal river flow condition without precipitations and, using the Beaufort wind scale classification, with a light breeze from South-West. What is easy to expect from this information is a surface river current from West to East, due primarily to the passage from low to high tide and strengthened by the wind. The wavelets moving from South-West are also visible from the multi-looked image. In Fig. 3 the results from the processor are shown; all the results are in slant-range coordinates. The second test-site covers the area of the Eyjafjallaj¨okull volcano on Island, which was monitored in cooperation with the Geographical Institute of the Ludwig Maximilians Universit¨at of Munich, Germany [8]. The aim of the activity was to investigate the possibilities for an early warning system for eruptions of volcanoes covered by glaciers by the use of spaceborne SAR. Triggered by the eruption of the Eyjafjallaj¨okull on April 14th, 2010 some glacier runs from melt water appeared in the valley Markarfljt north of the volcano. The
(c) Doppler velocity map.
Fig. 3: Results from the TerraSAR-X Doppler Shift Processor. On the top left the spectral preserved azimuth focused image is shown. It is an acquisition over the Elbe estuary made on the 26th October, 2008, after the low tide. The top right image is the azimuth ambiguities mask superimposed to the multi-looked. The ambiguities are shown in red: they spread over the whole data, and they are present also in the main river flow. On the bottom the Doppler speed projected on the river surface is shown just over the water areas. The mean current on the navigable channel is 0.85 m/s from West to East, varying sensibly probably due to the wind. Moving away from the estuary the current decreases its intensity.
Doppler measurement with the TerraSAR-X was performed on a stripmap scene acquired on April 15th, 2010 at 19:05h local time (Fig. 5). The Doppler shift appeared to be up to 260 Hz which corresponds to a ground surface velocity of 5.2 m/s (Fig. 5 and 6). Due to the high spatial resolution of
liable current estimations made with Doppler measurements. The TerraSAR-X Doppler-Shift Processor can be used also for less complex river scenes or ocean scenes and can be easily adapted to other sensors. 5. REFERENCES [1] Goldstein, R.M. and H.A. Zebker, ”Interferometric radar measurement of ocean surface currents”, Nature, vol. 328, pp. 707-709, 1987.
Fig. 4: TerraSAR-X acquisition over the Eyjafjallaj¨okull volcano on April 15th, 2010, multi-looked and ambiguity free.
[2] Romeiser, R. and D.R. Thompson, ”Numerical Study on the Along-Track Interferometric Radar Imaging Mechanism of Oceanic Surface Currents”, IEEE Trans. Geosci. Remote Sens, vol. 38, pp. 446-458, January 2000. [3] Chapron, B., F. Collard, and F. Ardhuin, ”Direct measurements of ocean surface velocity from space: Interpretation and validation”, J. Geophys. Res., 110, C07008, 2005 [4] Monti Guarnieri, A., ”Adaptive Removal of Azimuth Ambiguities in SAR Images”, IEEE Trans. Geosci. Remote Sens, vol. 43, pp. 625-633, March 2005. [5] Arino, O. et al., ”GlobCover: ESA service for global land cover from MERIS”, IEEE Geoscience and Remote Sensing Symposium, 2007. Proceedings.
Fig. 5: Estimated Doppler map superimposed to the multi-looked image for low SNR areas, in which the estimation is not reliable. The color scale is saturated at ±200 Hz, with a peak in the glacier run at 260 Hz.
[6] Bamler R., ”Doppler Frequency Estimation and the Cramer-Rao Bound”, IEEE Trans. Geosci. Remote Sens, vol. 29, pp.385-390, 1991. [7] Fiedler, H., T. Fritz, and R. Kahle, ”Verification of the Total Zero Doppler Steering” Radar, 2008 International Conference on , vol., no., pp.340-342, 2-5 Sept. 2008
Fig. 6: Detail of the surface velocity map of the glacier run, revealing a maximum velocity of 5.2 m/s.
TerraSAR-X such measurements are possible also over land. With a quick Doppler analysis of the radar data sudden water flows can be detected in remote areas which can be a sign of volcano activity. 4. CONCLUSIONS TerraSAR-X data was demonstrated suitable for surface currents retrieval and motion detection: its high resolution allows the estimation over small and complex areas like the one studied in this paper. The quality of the data and the accuracy of the geometric Doppler computation provide re-
[8] M¨unzer, U. et al, ”NRT-Monitoring am Vulkanausbruch Eyjafjallaj¨okull (Island) mit TerraSAR-X”, Photogrammetrie - Fernerkundung - Geoinformation (PFG), accepted, to be published