Siti A Ahmad BEng, MSc, Paul H. Chappell BSc, PhD, CEng, FIPEM, MIET, MIEEE, ... School of Electronics and Computer Science, University of Southampton, ...
From “MEC '08 Measuring Success in Upper Limb Prosthetics,” Proceedings of the 2008 MyoElectric Controls/Powered Prosthetics Symposium, held in Fredericton, New Brunswick, Canada, August 13–15, 2008.
SURFACE EMG CLASSIFICATION USING MOVING APPROXIMATE ENTROPY AND FUZZY LOGIC FOR PROSTHESIS CONTROL Siti A Ahmad BEng, MSc, Paul H. Chappell BSc, PhD, CEng, FIPEM, MIET, MIEEE, MInstP School of Electronics and Computer Science, University of Southampton, Southampton, UK 1.0 ABSTRACT Electromyographic control systems based on pattern recognition have become an established technique in upper limb prosthetic control application. This paper describes a use of fuzzy logic to discriminate different hand grip postures by processing the surface EMG from wrist muscles. A moving data window of two hundred values is applied to the SEMG data and a new method called moving approximate entropy is used to extract information from the signals. The analyses show differences at three states of contraction (start, middle and end) where significant dips can be observed at the start and end of a muscle contraction. Mean absolute value (MAV) and kurtosis are also used in the extraction process to increase the performance of the system. The extracted features are fed to a fuzzy logic system to be classified and select the output appropriately. The preliminary experimental result demonstrates the ability of the system to classify the features related to different grip postures. 2.0 INTRODUCTION Surface electromyography (SEMG) is used to evaluate and record the electrical activity of skeletal muscles. It is a non-invasive technique and has been applied to wide range of applications. Generally, it has been used in clinical neurological problems and now has become an established technique in prosthetic control application that is based on pattern recognition [1]. An electromyographic control system (ECS) is based on pattern recognition system (ECS) using pattern information extracted from the analysis of the SEMG signals and determines the control signal that will select the final output of the device operation. For example, Englehart and Hudgins used the pattern recognition ECS to investigate four channels of upper limbs’ SEMG signal to discriminate multiple classes of hand and wrist movement [2]. This paper describes the development of a control algorithm based on pattern recognition for prosthetic hand application. The objective is to design a system that should be able to select four different hand grip postures (e.g. spherical, lateral, tripod and power) by using two SEMG signals (wrist flexor and extensor muscles) as the control channel. A new approach called moving approximate entropy (mApEn) is the main method used to extract information from the SEMG signals with a fuzzy logic to classify the information. 3.0 EXPERIMENTS 3.1 Data Collection SEMG data were recorded from twenty normal healthy volunteers’ wrist muscles. Surface electrodes were placed on the flexor carpi ulnaris (FCU) and extensor carpi radialis (ECR) at the forearm with a reference electrode at the elbow. The volunteers were asked to do three different tasks related to the selected muscles which were wrist flexion/ extension, co-contraction and
Distributed under a Creative Commons Attribution-Noncommercial-No Derivative Works 3.0 United States License by UNB and the Institute of Biomedical Engineering, through a partnership with Duke University and the Open Prosthetics Project.
From “MEC '08 Measuring Success in Upper Limb Prosthetics,” Proceedings of the 2008 MyoElectric Controls/Powered Prosthetics Symposium, held in Fredericton, New Brunswick, Canada, August 13–15, 2008.
isometric contraction. Twelve contractions of ten seconds were recorded from each subject. Detail description of the procedures has been reported in a previous study [3]. 3.2 Signal Processing The recorded SEMG data was post processed where the whole data were divided into overlapping segment with a length 200 samples (130 ms duration) with a delay of one point to the next segment. Raw SEMG data was used and with this segmentation technique, the information in the signal could be preserved. For feature extraction, approximate entropy (ApEn) is used as the main method. ApEn is a method introduced by Pincus [4] to investigate the regularity/irregularity of a signal. It measures the repetition between two vectors m and m+1 within a tolerance range of r of the standard deviation of the data. With m=2, r =0.2; ApEn is obtained from the following equation: N − m +1 1 1 N −m m m +1 ln ( i ) ln C r (i ) (1) ∑ ∑ C r N − m + 1 i =1 N − m i =1 where N is the number of samples. The ApEn calculation returns a nonnegative number where higher value shows irregularity of the data and more regularity when lower value is obtained. Several other methods (mean absolute value (MAV), number of zero crossings, standard deviation, kurtosis and skewness) that had been reported in the literature [5, 6] had been investigated and only MAV and Kurtosis showed useful information. From the assessment, MAV and Kurtosis were selected to be used in the feature extraction process to increase the performance of the developed system. A moving data window was applied to the data sequence and three features (ApEn, MAV and Kurtosis) were extracted within the data is calculated repeatedly. Moving features were obtained as the windows moves point by point along the time axis. From visual inspection of the analysis from 20 subjects, a significant pattern from the three features can be observed at different states of contraction, namely start, middle and end of a contraction and detail descriptions can be referred to previous study [3]. The average at each state from each feature was calculated. Table 1 shows the summary of the analysis for average ApEn, average MAV and average kurtosis at three different states of a contraction: start, middle and end, also when the muscle is relaxed. The data from Table 1 is used as the placement of the fuzzy sets, discussed in the classification section
ApEn(m, r , N ) =
TABLE 1: Summary of the feature extraction process from FCU and ECR muscles STATE OF CONTRACTIONS START MIDDLE END RELAXED FCU ECR FCU ECR FCU ECR FCU ECR ApEn 0.45 0.5 0.75 0.75 0.4 0.45 0.9 0.85 MAV 10 40 50 110 20 30 5 10 Kurtosis 7 5 3 4 10 15 3 3.5 3.3 Classification A classifier’s function should be able to map different patterns and match them appropriately, in this case, able to select different hand grip postures. The extracted features were then fed into the fuzzy logic (FL) classifier for the developed control system. FL developed by Lofty Zadeh [7]
Distributed under a Creative Commons Attribution-Noncommercial-No Derivative Works 3.0 United States License by UNB and the Institute of Biomedical Engineering, through a partnership with Duke University and the Open Prosthetics Project.
From “MEC '08 Measuring Success in Upper Limb Prosthetics,” Proceedings of the 2008 MyoElectric Controls/Powered Prosthetics Symposium, held in Fredericton, New Brunswick, Canada, August 13–15, 2008.
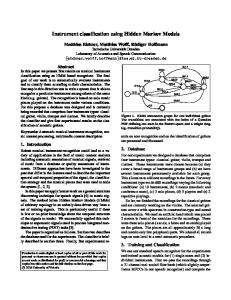
provides a simple way to arrive at a definite conclusion just based upon imprecise input information. For the FL classification analysis, triangular shape of the membership function (MF) for the inputs (Table 1) and output, and centroid method for the defuzzification are used. The rules are created based on the information from the states of contraction. For initial testing, the control system is tested with the recorded SEMG signal and implemented using MATLAB/Simulink. Figure 3 shows the flow diagram of the control system.
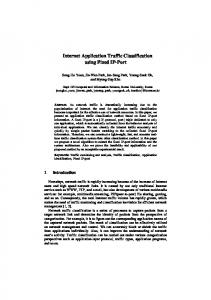
Figure 3: The flow diagram of the control system with FL classification components Figure 4 shows the result of the FL classification process from two SEMG signals (FCR and ECR) during wrist flexion (FCR active, ECR inactive). Two examples are given and each took about 650ms duration. For preliminary testing, the four hand grip postures are represented by STATE (S1, S2, S3 and S4) and its MF is shown in Fig. 4C. The final classification result shows that the system is able to select S1 to S3 according to the features. 4.0 CONCLUSION
With moving ApEn as the main method in the feature extraction process, the preliminary result obtained demonstrates the ability of the system to classify the features related to different grip postures. In the near future, further assessment of systems’ performance will be continued and the development of the control system for real time application will be carried out. References 1. 2. 3. 4.
Parker P.A., Scott R.N., “Myoelectric Control of Prosthesis”, Crit. Rev Biomed Eng., 12, 283-310, 1986. Hudgins B., Englehart K., “A robust, real-time control scheme for multifunction myoelectric control”, IEEE Trans. on Biomedical Engineering, 50(7), 848-854, 2003. Ahmad S.A., Chappell P.H., “Moving approximate entropy applied to surface electromyographic signals”, Jnl. of Biomed. Signal Processing and Control, 3(1), 88-93, 2008. Pincus, S.M., “Approximate entropy as measure of system complexity”, Proc. National Academic Science USA, 2297-2301, 1988.
Distributed under a Creative Commons Attribution-Noncommercial-No Derivative Works 3.0 United States License by UNB and the Institute of Biomedical Engineering, through a partnership with Duke University and the Open Prosthetics Project.
From “MEC '08 Measuring Success in Upper Limb Prosthetics,” Proceedings of the 2008 MyoElectric Controls/Powered Prosthetics Symposium, held in Fredericton, New Brunswick, Canada, August 13–15, 2008.
5. 6.
7.
Scott R.N., Hudgins B. and Parker P., “A new strategy for multifunction myoelectric control”, IEEE Trans. on Biomedical Eng., 40(1), 82-94, 1993. Nazarpour K.,Sharafat A.R., Firoozabadi S.M.P., “Surface EMG Signal Classification Using a Selective Mix of Higher Order Statistics”, Proc. 27th Annual International Conference of the Engineering in Medicine and Biology Society, 4208-4211, 2005. Zadeh L., “Fuzzy Sets”, Information and Control, 8(3), 338-353, 1965. (a) Contraction 1
(b) Contraction 2
1
1
2
3
2
3
A. EMG1 (FCR)
B. EMG2 (ECR)
C. FL Classification S1 S2 S3 S4
0
State
1
Figure 4: The extraction features from FCR (A) and ECR (B). (C) is the result of the classification based on the MF (S1: 0 – 0.35 ; S2: 0.2 – 0.55; S3: 0.4 – 0.8; S4: 0.65 – 1.0) assigned for the output. 1, 2 and 3 in the plots indicate start, middle and end of contraction respectively.
Distributed under a Creative Commons Attribution-Noncommercial-No Derivative Works 3.0 United States License by UNB and the Institute of Biomedical Engineering, through a partnership with Duke University and the Open Prosthetics Project.