695 Hypertens Res Vol.29 (2006) No.9 p.695-702
Original Article
A New Technique for Detecting Sleep Apnea– Related “Midnight” Surge of Blood Pressure Osamu SHIRASAKI1),2), Shingo YAMASHITA1), Shin-ichi KAWARA3), Kayoko TAGAMI3), Joji ISHIKAWA2), Kazuyuki SHIMADA2), and Kazuomi KARIO2) Patients with obstructive sleep apnea syndrome (OSAS) have been reported to be at greater risk for cardiovascular events, and midnight surge of blood pressure (BP) may be a mechanism of sleep apnea–related cardiovascular risk. However, there has been no accurate noninvasive technique to detect intermittent BP surge at the time of each sleep apnea episode. We therefore developed an experimental system to detect apnea-related short-term BP surge based on BP measurement triggered by peripheral (finger-tip) oxygen desaturation (a desaturation-triggered BP monitoring system). In 16 patients with OSAS, this new system successfully detected BP surges at the time of the sleep apnea, and the BP values were found to be significantly higher than those detected using a conventional fixed interval BP monitoring system (systolic BP [SBP] difference: 13 ± 5.8 mmHg, p = 0.039; diastolic BP [DBP] difference: 10 ± 6.8 mmHg, p = 0.032). The maximum SBP time rate (velocity of BP surge) showed a strong positive correlation with the apnea-hypopnea index (r = 0.855, p < 0.0001). In conclusion, we developed a noninvasive oxygen desaturation–triggered BP monitoring system that can successfully detect sleep apnea–related BP surge. The midnight BP surge detected by this new method was significantly associated with the severity of OSAS. (Hypertens Res 2006; 29: 695–702) Key Words: nocturnal hypertension, blood pressure surge, obstructive sleep apnea syndrome, oxygen
Introduction Obstructive sleep apnea syndrome (OSAS) is one of the strongest risk factors for cardiovascular events, including cardiac sudden death and stroke (1–5). Previous studies have demonstrated that, like hypertension (6, 7), OSAS tends to be accompanied by disrupted diurnal blood pressure (BP) variations such as those in non-dippers (less nocturnal BP fall) and risers (higher nocturnal BP than daytime BP) (8–12), which are associated with cardiovascular risk (13, 14). In addition, BP variations assessed by standard deviation (15–18) or time rate (TR) of BP change (19) are also reported to be associated with the risk for cardiovascular disease. Thus, not only higher
average BP level per se, but also exaggerated BP variation (20–24), especially at the moment of sleep apnea events, may one of the mechanisms involved in sleep apnea–related cardiovascular risk. However, there is currently no accurate noninvasive technique to detect intermittent BP surge at the time of each sleep apnea episode. Ambulatory BP monitoring (ABPM) has been most widely used to noninvasively assess BP variation both during waking and sleeping periods. However, regular ABPM devices that measure BPs at fixed intervals, e.g., every 15 or 30 min, do not seem useful for precisely detecting the sleep apnea– related short-term BP variation. And although ABPM with more frequent measurement might be better at detecting the apnea-related BP variation, frequent BP measurements would
From the 1)Business Development Center, Omron Healthcare, Co., Ltd., Kyoto, Japan; 2)Division of Cardiovascular Medicine, Jichi Medical University School of Medicine, Shimotsuke, Japan; and 3)Department of Clinical Laboratory, Washiya Hospital, Utsunomiya, Japan. Address for Reprints: Kazuomi Kario, M.D., COE (Center of Excellence) Program, Division of Cardiovascular Medicine, Jichi Medical University School of Medicine, 3311–1, Yakushiji, Shimotsuke 329–0498, Japan. E-mail:
[email protected] Received December 27, 2005; Accepted in revised form June 16, 2006.
696
Hypertens Res Vol. 29, No. 9 (2006)
Optical sensor
Pulse oximeter
S p O2 data
BP & PR data
BP cuff
PC Interface circuit
BP monitor
Memory BP trigger control
Trigger signal
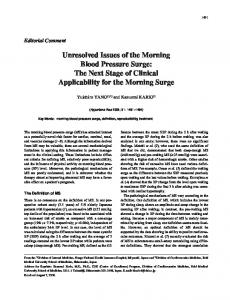
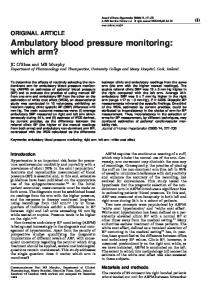
Fig. 1. Block diagram of the experimental system.
disturb patients’ sleep, resulting in BP levels higher than the real ones in a natural, unmonitored environment. Other noninvasive techniques that are capable of detecting sleep apnea– related BP variation are the arterial tonometry and arterial volume clamp method. However, it is difficult to precisely monitor absolute BP values using these techniques because of the frequent body movements during long sleep periods. We developed an experimental system to detect sleep apnea–related BP variation based on BP measurement triggered by peripheral (finger-tip) oxygen desaturation (an oxygen desaturation–triggered BP monitoring system), and used this system to evaluate sleep apnea–related BP surge.
BP measurements due to prolonged desaturation. The Omron HEM-770 was chosen to monitor BP because this device is capable of high speed measurement within 20 to 25 s in most readings and could complete a cycle of measurement 20% to 30% more quickly than conventional oscillometric devices, and therefore the BP readings made using this device could more accurately detect rapid changes in BP and PR. The cuff of the BP monitor was attached to the patient’s left upper arm. The PC program also stored SpO2, BP, and PR readings. In addition to the trigger method, a series of BP measurements with a fixed interval of 30 min were performed in order to compare the performance of our system with that of ABPM (regular method).
Methods Subjects Apparatus Figure 1 shows the experimental set-up for our study. The system consists of a pulse oximeter, OLV-3100 (Nihon Kohden, Co., Ltd., Tokyo, Japan), a cuff-oscillometric BP monitor, HEM-770 (Omron Healthcare, Co., Ltd., Kyoto, Japan), a personal computer (PC), and an electronic circuit unit functioning as an interface between the PC and pulse oximeter or BP monitor. The pulse oximeter was set to obtain optical pulse wave signals (wavelength: 660 and 940 nm) in the right index finger and to generate pulse oximetry (SpO2) readings every 5 s. A PC program newly developed for the study monitored the SpO2 continuously and triggered the BP measurement when either of the following conditions of SpO2 variation was met (trigger method): 1) when SpO2 crossed downward (moved from above to below) a threshold which was set as the average of 3 consecutive readings minus 4% in each subject just before going to bed; 2) when SpO2 decreased by 4% from the reading at the immediately previous BP measurement. Once triggered, the BP monitor repeated 3 times, with an interval of 15 s, the measurements of systolic (SBP) and diastolic BP (DBP), and pulse rate (PR) based on the cuff-oscillometric principle. After a trigger took place, the next trigger was interrupted for 10 min to avoid excessive succession of
We applied the technique to 16 patients (12 men and 4 women, 22–79 years of age) with OSAS (with apnea-hypopnea index [AHI]> 5) diagnosed by overnight polysomnography (PSG) in the sleep clinic at Washiya Hospital (Utsunomiya, Japan). A PS2 Plus Sleep Watcher system (Compumedics Limited, Inc., Melbourne, Australia) was used for the PSG measurements, which included SpO2, EEG, ECG, EMG, EOG (L, R), airflow, and thoracic and abdominal movement. We calculated AHI as the average number of apnea and hypopnea events per hour of sleep. Apnea was defined as complete or almost complete cessation of airflow, and hypopnea as a decrease in airflow or thoracoabdominal excursion of at least 50% of baseline for 10 s or longer, accompanied by a 3% or higher decrease in SpO2. Sleep depth was evaluated using the Rechtschaffen and Kales standard (25). The experimental protocol was approved by the ethics committee of the hospital. Informed consent for participation in this study was given by every participant. The patient group included 14 patients with hypertension (office SBP≥ 140 mmHg or DBP≥ 90 mmHg), 1 with diabetes mellitus, 11 with obesity (BMI≥ 25.0 kg/m2), and 3 with hyperlipidemia (low-density lipoprotein cholesterol [LDLC] ≥ 150 mg/dl).
Shirasaki et al: New Technique to Detect BP Surge of Sleep Apnea
A
697
SpO 2 [%]
100 90 80 70 60 200
200
BP [mmHg]
160
SBP (regular)
SBP (trigger)
D BP
PR
180 160
140
140
120
120
100
100
80
80
60
60
40
40
19:00 20:00 21:00 22:00 23:00
B
PR [bpm]
180
0:00
1:00
2:00
3:00
4:00
5:00
6:00
7:00
8:00
SpO2 [%]
100 90 80 70 60 160
160 D BP
SBP (trigger)
PR
140
140
120
120
100
100
80
80
60
60 40
40 4:00
C
PR [bpm]
BP [mmHg]
SBP (regular)
4:10
4:20
4:30
4:40
4:50
5:00
5:10
5:20
5:30
5:40
5:50
6:00
SpO2 [%]
100 90 80 70 60 200
200
BP [mmHg]
160
SBP (f ixed int.)
SBP (triggered)
D BP
PR
180 160
140
140
120
120
100
100
80
80
60
60
40
40
19:00 20:00 21:00 22:00 23:00
0:00
1:00
2:00
3:00
4:00
5:00
6:00
7:00
PR [bpm]
180
8:00
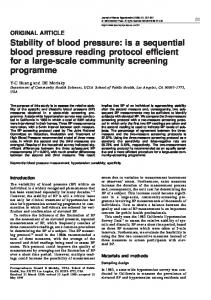
Fig. 2. A: Profiles of systolic BP (SBP) by the fixed interval method (thick gray line) and by the triggering method (thin line), and of diastolic BP (DBP) and pulse rate (PR) in Case 1 without CPAP treatment. B: Horizontally zoomed profiles in Case 1 without CPAP application. C: Profiles in Case 1 with CPAP treatment.
698
Hypertens Res Vol. 29, No. 9 (2006)
BP [mmHg] or PR [bpm]
30
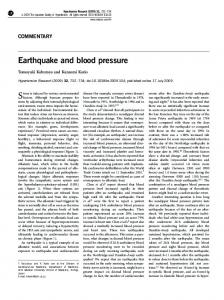
Results p=0.039 p=0.032
20
Overview of Nocturnal BP and PR Profiles NS
10
0 SBP
DBP
PR
Fig. 3. Mean differences between max-trigger and max-regular values for SBP, DBP, and PR.
Analysis For each patient, we calculated the average of the highest three readings of SBP, DBP, and PR recorded in one night by the trigger method (max-trigger) and those recorded by the regular method (max-regular). We also calculated the averages of the lowest three readings as the min-trigger value and the min-regular value, respectively. For the purpose of comparison with conventional ABPM, the average of all readings in the night also were calculated for SBP, DBP, and PR (mean-regular). We examined the correlation between AHI measured by PSG and the above values obtained by the three methods, i.e., max-trigger, max-regular, and mean-regular. The TR is a measure of the velocity of BP surge per normalized period of time, and is not affected by the irregularity of the time interval between consecutive BP readings (19). We used the following formula for the TR of SBP: TRi = [SBPi − SBPi − 1]/[Ti − Ti − 1], where, SBPi and SBPi − 1 are two consecutive SBP readings, and Ti and Ti − 1 are the corresponding times when the two SBPs were measured. TRs of DBP and PR were also calculated in the same manner. To investigate the association between the velocity of BP surge and the severity of OSAS, we calculated the averages of the highest three values of TR (TRMAX) for SBP, DBP, and PR.
Statistical Analysis The paired t-test was used to examine the significance of the difference between the max-trigger value and the max-regular value within the same patients. Pearson’s correlation coefficient (r) was used to measure correlations between continuous variables. Values of p< 0.05 (two-tailed) were considered statistically significant. All the statistical analyses were performed with Microsoft Excel 2000 Ver.9.0.6926.
Figure 2A, B, and C show representative records of SpO2, BP (SBP and DBP), and PR, respectively, obtained by the regular method and by the trigger method. As seen in the figures, the trigger was activated selectively by sleep apnea events that were seen as a series of steep decreases in SpO2. Some of the SBP readings obtained by the trigger method showed spikelike surges which could not have been detected by the regular method. Examination of an enlargement of the chart for the same patient over a single period (Fig. 2B) more clearly demonstrates the differences between the outcomes of the two methods. In three periods in the time range, i.e., 4:09 to 4:18 AM, 5:20 to 5:29 AM, and 5:32 to 5:39 AM, BP measurement was not triggered despite the considerable decrease in SpO2 because of the interruption period of 10 min. Figure 2C shows the results of standard continuous positive airway pressure (CPAP) titration in the same patient. CPAP was initiated by 4 cmH2O, and was increased by 1 to 2 cmH2O until respiratory events were controlled. A comparison between the records with and without CPAP (Fig. 2A) revealed that sleep apnea events were drastically reduced and, more importantly, far fewer BP measurements were triggered during the night with CPAP treatment.
Comparison of Maximum SBP, DBP, and PR Values by 3 Different Methods Figure 3 shows differences between the max-trigger and maxregular values of SBP, DBP, and PR. The max-trigger values were significantly higher than the max-regular values for SBP (difference: 13±5.8 mmHg, p= 0.039) and DBP (difference: 10±6.8 mmHg, p= 0.032), while the differences between the min-trigger BPs and the min-regular BPs were not significant (data not shown). There were no significant differences between the max-trigger PR and max-regular PR (difference: 7±5.1 bpm, p= 0.118) or between the min-trigger PR and the min-regular PR. The max-trigger values of SBP, DBP, and PR were significantly correlated with the max-regular values (Fig. 4).
Correlation between Max Values and AHI Figure 5 shows scattered plots of AHI with SBP, DBP, and PR values obtained by the mean-regular, max-regular, and max-trigger methods. The slope and r-value of max-trigger of SBP and DBP were the highest among the three different methods for SBP and DBP, and that of mean-regular was the highest for PR.
Shirasaki et al: New Technique to Detect BP Surge of Sleep Apnea
180 160 140 y = 1. 033x + 8. 7 r = 0. 949, p< 0. 0001
120 100
140
120
120
100
PR by max-trigger [bpm]
200
DBP by max-trigger [mmHg]
SBP by max-trigger [mmHg]
220
100
80 y = 0. 946x + 15. 0
120
140
160
180
200
80
60 y = 0. 934x + 12. 3
r = 0. 866, p< 0. 0001
r = 0. 919, p< 0. 0001
60 100
220
699
40 80
60
SBP by max-regular [ mmHg]
100
120
40
140
DBP by max-regular [ mmHg]
60
80
100
120
PR by max-regular [ bpm]
Fig. 4. Comparison between max-regular (horizontal) and max-trigger values for SBP, DBP, and PR.
220
220 y = 0. 4829x + 111. 3 r = 0. 453, p= 0. 078
180 160 140 120
0
10
20
30
40
50
60
140 120
10
20
30
40
50
60
120 100 80 60 0
10
20
30
40
50
60
y = 0. 4624x + 72. 3 r = 0. 523, p= 0. 038
140 120 100 80
10
20
30
40
50
60
100 80 60
y = 0. 4714x + 60. 4 r = 0. 518, p= 0. 040
120 100 80 60 40
40 0
10
20
30 40 AHI
50
60
70
30
40
50
60
70
40
50
60
70
50
60
70
120 100 80
0
10
20
30
140
PR by max-trigger [bpm]
PR by max-regular [bpm]
y = 0. 4958x + 48. 7 r = 0. 628, p= 0. 009
20
y = 0. 6422x + 77. 1 r = 0. 664, p= 0. 005
140
70
140
120
10
60 0
140
120
0
60
70
140
160
DBP by max-trigger [mmHg]
y = 0. 4153x + 61. 7 r = 0. 567, p= 0. 022
160
70
160
140
180
100 0
DBP by max-regular [mmHg]
DBP by mean-regular [mmHg]
160
70
160
PR by mean-regular [bpm]
180
100
100
y = 0. 6977x + 134. 1 r = 0. 532, p= 0. 034
200
SBP by max-trigger [mmHg]
200
SBP by max-regular [mmHg]
SBP by mean-regular [mmHg]
200
220 y = 0. 48x + 128. 1 r = 0. 398, p= 0. 126
y = 0. 5241x + 65. 9 r = 0. 567, p= 0. 022
120 100 80 60 40
0
10
20
30 40 AHI
50
60
70
0
10
20
30 40 AHI
Fig. 5. Correlation between AHI (horizontal) and mean-regular (left), max-regular (center), and max-trigger (right) values for SBP (top), DBP (mid), and PR (bottom).
700
Hypertens Res Vol. 29, No. 9 (2006)
60
60 y = 0. 6591x + 5. 4 r = 0. 855, p< 0. 0001
40 30 20 10 0
40 30 20 10 0
0
10
20
30 40 AHI
50
60
70
y = 0. 3128x + 3. 9 r = 0. 579, p= 0. 019
50
Timerate of PR [bpm/min]
50
Timerate of DBP [mmHg/min]
Timerate of SBP [mmHg/min]
50
60 y = 0. 5267x + 5. 0 r = 0. 741, p= 0. 001
40 30 20 10 0
0
10
20
30 40 AHI
50
60
70
0
10
20
30
40
50
60
70
AHI
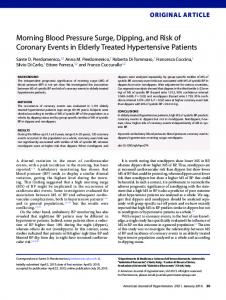
Fig. 6. Correlation between AHI and the time-rate of SBP, DBP, or PR.
Correlation between AHI and TRMAX Individual TRMAX values varied over a wide range of 12.4– 47.2 mmHg/min and 6.5–36.8 mmHg/min for SBP and DBP, and 3.9–30.5 bpm/min for PR, respectively. As shown in Fig. 6, AHI showed a marked positive correlation with TRMAX of SBP (r= 0.855, p< 0.0001). A similar association was also found for DBP (r= 0.741, p= 0.001) but not for PR (r= 0.579, p= 0.019). TRMAX values were defined as the average of the three highest values of time-normalized differences between adjacent BP or PR readings. As a result, in this study, all the TRMAX values were calculated from BP or PR changes within a cluster of triplicated measurements by one apnea event.
Discussion In the present study, we developed an experimental system that triggers BP measurement intermittently based on peripheral oxygen desaturation due to sleep apnea events. This BP monitoring system successfully detected apnea-related BP surges that could not be detected by conventional ABPM. The TR of the BP surge was highly correlated with the severity of sleep apnea. In the clinical setting, to study the impact of BP surge on the progression of hypertensive target organ damage and the triggering of cardiovascular events, a specific technique to measure BP in particular situations is required. There are various possible ideas for automatically triggering BP measurement based on physiological changes, such as alterations in heart rate, peripheral oxygen saturation, and cardiac status (ECG waveform analysis). In this study, we applied the “trigger technique” to detect the BP variability during sleep apnea events. To the best of our knowledge, no study has applied this technique to the observation of nocturnal BP variability associated with sleep apnea events. Continuous (beat-to-beat) BP monitoring is ideal for detecting dynamic BP changes during sleep apnea events.
There are 2 types of noninvasive techniques for such continuous BP monitoring; however, neither would be suitable for nocturnal BP monitoring. The first one is arterial tonometry, which continuously compresses the artery in the wrist (generally the radial artery) by a pressure transducer array and measures arterial pressure as interaction (counter pressure) from the arterial wall (26). However, the method requires periodic calibration with conventional BP measurement, e.g., the cuffoscillometric method, to cancel time-dependent reading errors (so-called “offset”). In addition, for long-term use, such as nocturnal monitoring, there is concern about out-positioning of the transducer, which needs to be attached exactly over the artery. The second possible technique for continuous BP monitoring is the arterial volume clamp method. In this method, a finger cuff pressure is controlled to keep the intraarterial volume constant over a heart beat cycle and BP is measured as the finger cuff pressure (27). This method also requires periodic calibration with conventional measurement. The other shortcomings of this technique are peripheral ischemia due to continuous venous occlusion and the difference of regional BP vs. general BP, which might be exacerbated during the acute physiological changes caused by sleep apnea events. Both of these noninvasive techniques for continuous monitoring require expensive instruments that may not be available for routine medicine and home healthcare. Thus, there are many technical and economic difficulties in using the currently available noninvasive techniques for continuous monitoring of nocturnal BP. Accordingly, we pursued the possibility of evaluating intermittent BP measurement based on a trigger method. A short interval between BP readings may affect the accuracy of the measurement in the case of auscultation because Korotkof sounds which are used to determine the auscultatory BP values are attenuated by peripheral blood congestion by successive arterial occlusion. However, the accuracy of the oscillometric method, which measures BP based on the equivalence between regional intraarterial volume and pres-
Shirasaki et al: New Technique to Detect BP Surge of Sleep Apnea
sure, has been proven not to be affected by the shortness of the interval as long as it is greater than 15 s (28). The present experimental BP monitoring system based on a combination of fixed-interval intermittent BP measurement and triggered BP measurement, could separately evaluate overall nighttime BP levels throughout the total sleep period and sleep apnea–related BP variation. Many reports have demonstrated that the average nighttime BP and nocturnal BP dipping status are significantly associated with cardiovascular disease and death (10, 14–18). In addition, nighttime BP variation is also associated with cardiovascular risk independently of the average nighttime BP level in elderly hypertensives (29). This nighttime BP variability may be partly explained by sleep apnea–related BP variability. In the present study, max-trigger SBP and DBP were both significantly higher than the mean-regular and max-regular ones. High-speed oscillometric measurement by the BP monitor (Omron HEM-770) seems to contribute to these results. The max-trigger SBP (r= 0.532, p= 0.034) and DBP (r= 0.664, p= 0.005) were more closely correlated with AHI than the mean-regular SBP (r= 0.453, p= 0.078) and DBP (r= 0.567, p= 0.022), or the max-regular SBP (r= 0.398, p= 0.126) and DBP (r= 0.523, p= 0.038). However, the min-trigger BPs were comparable to the min-regular BPs. These results suggest that BPs detected by our trigger method may more clearly reflect the components of sleep apnea–related BP surge. TRMAX, which measures the velocity of BP (or PR) surge per normalized period of time, could be applicable to BP measurements with irregular intervals between readings (19). In this study, the TRMAX of SBP showed a strong correlation with AHI (r= 0.855, p< 0.0001), suggesting that BP variability is augmented by the severity of sleep apnea in patients with sleep apnea. A question arises as to whether frequent triggering in patients with high AHI could have artificially increased the TRMAX-AHI correlation, since frequent triggering could have shortened the interval between the clusters of BP or PR readings, and increased the TR of the given change in BP or PR. However, since all the TRMAX values were of BP or PR changes within a cluster of 3 consecutive readings, not of those over different clusters, the frequency of the triggering would not have affected the results on the TRMAX values. The TRMAX of SBP, DBP and PR obtained by the max-trigger method varied up to 47 mmHg/min, 37 mmHg/min, and 31 bpm/min, respectively. These rapid physiological changes would never be captured by conventional ABPM with a fixed interval. Recently, it has been reported that the TR of BP variability in the morning was significantly higher in hypertensives than in normotensives and was independently associated with carotid atherosclerosis independently of the average BP level (19). The sleep apnea–related BP surge and its TR detected by this method may also be more closely associated with hypertensive target organ damage and cardiovascular events, particularly in hypertensive patients with sleep apnea.
701
A limitation of this study is that BP measurement was triggered immediately after an oxygen desaturation was detected and, therefore, the phase of the sleep apnea event when the BP was measured could not be controlled. More specifically, the present method could catch BP values that were close to but not always at the BP peak. Self-measured home BP monitoring has been increasingly recommended by various international guidelines for the management of hypertension (30–33). Our oxygen desaturation–triggered BP monitoring system using a pulse oximeter can be easily introduced to home BP monitoring devices. Further investigations will be necessary to test the clinical usefulness of the indices obtained from our trigger method in patients with sleep apnea.
References 1.
Gami AS, Howard DE, Olson EJ, Somers VK: Day-night pattern of sudden death in obstructive sleep apnea. N Engl J Med 2005; 352: 1206–1214. 2. Shahar E, Whitney CW, Redline S, et al: Sleep-disordered breathing and cardiovascular disease. Cross-sectional results of the Sleep Heart Health Study. Am J Respir Crit Care Med 2001; 163: 19–25. 3. Yaggi HK, Concato J, Kernan WN, Lichtman JH, Brass LM, Mohsenin V: Obstructive sleep apnea as a risk factor for stroke and death. N Engl J Med 2005; 353: 2070–2073. 4. Eguchi K, Kario K, Hoshide S, Ishikawa J, Morinari M, Shimada K: Nocturnal hypoxia is associated with silent cerebrovascular disease in a high-risk Japanese communitydwelling population. Am J Hypertens 2005; 18: 1489–1495. 5. Bradley TD, Floras JS: Sleep apnea and heart failure: Part I. Obstructive sleep apnea. Circulation 2003; 107: 1671– 1678. 6. Haas DC, Foster GL, Nieto FJ, et al: Age-dependent associations between sleep-disordered breathing and hypertension: importance of discriminating between systolic/ diastolic hypertension and isolated systolic hypertension in the Sleep Heart Health Study. Circulation 2005; 111: 614– 621. 7. Nieto FJ, Young TB, Lind BK, et al: Association of sleepdisordered breathing, sleep apnea, and hypertension in a large community-based study. Sleep Heart Health Study. JAMA 2000; 283: 1829–1836. 8. Moller DS, Lind P, Strunge B, Pedersen EB: Abnormal vasoactive hormones and 24-hour blood pressure in obstructive sleep apnea. Am J Hypertens 2003; 16: 274– 280. 9. Davies CWH, Crosby JH, Mullins RL, Barbour C, Davies RJO, Stradling JR: Case-control study of 24 hour ambulatory blood pressure in patients with obstructive sleep apnoea and normal matched control subjects. Thorax 2000; 55: 736–740. 10. Kario K, Shimada K, Pickering TG: Abnormal nocturnal blood pressure falls in elderly hypertension: clinical significance and determinants. J Cardiovasc Pharmacol 2003; 41 (Suppl 1): S61–S66. 11. Tanigawa T, Tachibana N, Yamagishi K, et al: Relationship
702
12.
13.
14.
15.
16.
17.
18.
19.
20.
21.
22.
Hypertens Res Vol. 29, No. 9 (2006)
between sleep-disordered breathing and blood pressure levels in community-based samples of Japanese men. Hypertens Res 2004; 27: 479–484. Akashiba T, Minemura H, Yamamoto H, Kosaka N, Saito O, Horie T: Nasal continuous positive airway pressure changes blood pressure “non-dippers” to “dippers” in patients with obstructive sleep apnea. Sleep 1999; 22: 849– 853. Shimada K, Kawamoto A, Matsubayashi K, Nishinaga M, Kimura S, Ozawa T: Diurnal blood pressure variations and silent cerebrovascular damage in elderly patients with hypertension. J Hypertens 1992; 10: 875–878. Kario K, Pickering TG, Matsuo T, Hoshide S, Schwartz JE, Shimada K: Stroke prognosis and abnormal nocturnal blood pressure falls in older hypertensives. Hypertension 2001; 38: 852–857. Roman MJ, Pickering TG, Schwartz JE, Pini R, Devereux RB: Relation of blood pressure variability to carotid atherosclerosis and carotid artery and left ventricular hypertrophy. Arterioscler Thromb Vasc Biol 2001; 21: 1507–1511. Kikuya M, Hozawa A, Ohokubo T, et al: Prognostic significance of blood pressure and heart rate variabilities: the Ohasama Study. Hypertension 2000; 36: 901–906. Sander D, Kukla C, Klingelhofer J, Winbeck K, Conrad B: Relationship between circadian blood pressure patterns and progression of early carotid atherosclerosis: a 3-year follow-up study. Circulation 2000; 102: 1536–1541. Sega R, Corrao G, Bombelli M, et al: Blood pressure variability and organ damage in a general population: results from the PAMELA Study. Hypertension 2002; 39: 710– 714. Zakopoulos NA, Tsivgoulis G, Barlas G, et al: Time rate of blood pressure variation is associated with increased common carotid artery intima-media thickness. Hypertension 2005; 45: 505–512. Pringle E, Phillips C, Thijs L, et al: Syst-Eur investigators. Systolic blood pressure variability as a risk factor for stroke and cardiovascular mortality in the elderly hypertensive population. J Hypertens 2003; 21: 2251–2257. Kario K, Pickering TG, Umeda Y, et al: Morning surge in blood pressure as a predictor of silent and clinical cerebrovascular disease in elderly hypertensives: a prospective study. Circulation 2003; 107: 1401–1406. Kario K: Time for focus on morning hypertension. Pitfall of
23. 24.
25.
26.
27.
28.
29.
30.
31.
32.
33.
current antihypertensive medication. Am J Hypertens 2005; 18: 149–151. Kario K: Morning surge and variability in blood pressure: a new therapeutic target? Hypertension 2005; 45: 485–486. Kario K: Blood pressure variability in hypertension: a possible cardiovascular risk factor. Am J Hypertens 2004; 17: 1075–1076. Rechtschaffen A, Kales A: A Manual if Standardized Terminology, Techniques and Scoring System for Sleep Stages of Human Subjects. Los Angeles, UCLA Brain Information Service/Brain Research Institute, 1968. Pressman G, Newgard P: A transducer for the continuous external measurement of arterial blood pressure. IEEE Trans Biomed Electro 1963; 10: 73–81. Yamakoshi K, Shimazu H, Togawa T: Indirect measurement of instantaneous arterial blood pressure in the human finger by the vascular unloading technique. IEEE Trans Biomed Electro 1980; 3: 150–155. Yarows SA, Patel K, Brook R: Rapid oscillometric blood pressure measurement compared to conventional oscillometric measurement. Blood Press Monit 2001; 6: 145–147. Pringle E, Phillips C, Thijs L, et al, Syst-Eur Investigators: Systolic blood pressure variability as a risk factor for stroke and cardiovascular mortality in the elderly hypertensive population. J Hypertens 2003; 21: 2251–2257. O’Brien E, Asmar R, Beilin L, et al: Practice guidelines of the European Society of Hypertension for clinic, ambulatory and self blood pressure measurement. J Hypertens 2005; 23: 697–701. Pickering TG, Hall JE, Appel LJ, et al: Recommendations for blood pressure measurement in humans and experimental animals: Part 1. Blood pressure measurement in humans: a statement for professionals from the subcommittee of professional and public education of the American Heart Association Council on high blood pressure research. Circulation 2005; 111: 697–716. Chobanian AV, Bakris GL, Black HR, et al: Seventh Report of the Joint National Committee on Prevention, Detection, Evaluation, and Treatment of High Blood Pressure. Hypertension 2003; 42: 1206–1252. Imai Y, Otsuka K, Kawano Y, et al: Japanese Society of Hypertension (JSH) guidelines for self-monitoring of blood pressure at home. Hypertens Res 2003; 26: 771–782.