AQUATIC BIOLOGY Aquat Biol
Vol. 9: 263–270, 2010 doi: 10.3354/ab00260
Published online June 10
OPEN ACCESS
Survival and progression rates of large European silver eel Anguilla anguilla in late freshwater and early marine phases Kim Aarestrup1,*, Eva B. Thorstad2, Anders Koed1, Jon C. Svendsen1, Niels Jepsen1, Michael I. Pedersen1, Finn Økland2 1
Technical University of Denmark, National Institute of Aquatic Resources, Vejlsøvej 39, 8600 Silkeborg, Denmark 2 Norwegian Institute for Nature Research, 7485 Trondheim, Norway
ABSTRACT: The population of European silver eel Anguilla anguilla has declined tremendously in the last decades. The cause of this decline is unknown, and it is necessary to investigate the migratory behaviour and survival rates of silver eels during the reproductive migration in order to understand if the decline is related to factors acting during that migration. We estimated survival and progression rates of European silver eel migrating in the lower part of the River Gudenaa and during the first phase of the marine migration in the Randers Fjord in Denmark. Fifty migrating silver eel (total body length: 56 to 84 cm) were captured, and each was equipped with an acoustic transmitter. Their migration was subsequently monitored using an array of automatic listening stations, and progression rate and mortality in the river, inner part of the fjord and outer part of the fjord were estimated. Survival was high in fresh water. However, 60% of eels were lost in the inner and outer fjord, supporting the hypothesis that mortality is large in the early phase of the marine migration and that fishing may be a major cause of mortality of silver eels. There was no indication that the slowest-migrating individuals were more prone to fishing mortality than the faster-migrating individuals. Progression rate increased as the eels proceeded downriver and out of the fjord. The migration was predominantly nocturnal, both in the river and fjord. Based on the available evidence, a considerable increase in eel survival in the river–fjord system will be needed in order to fulfil the goals in the European Union recovery plan for eels. KEY WORDS: Anguilla anguilla · Migration speed · Survival · Migration · Fishing mortality · Acoustic telemetry Resale or republication not permitted without written consent of the publisher
INTRODUCTION The European eel Anguilla anguilla (L.), with its fascinating lifecycle, is believed to spawn in the Sargasso Sea (Tesch 2003, van Ginneken & Maes 2005). Subsequently, the larvae drift via the sea currents to European waters, where they transform into so-called elvers. The elvers ascend into coastal, brackish and freshwater feeding habitats, change colouration and develop into the yellow eel stage. After several years, the eels transform again into the migratory silver eel stage and commence the migration back to the Sargasso Sea to reproduce (Tesch 2003, van Ginneken & Maes 2005).
The European eel has a continent-wide distribution and is heavily exploited throughout several life stages and, hence, is of high socio-economic value (Tesch 2003). However, the eel population is in precipitous decline, and in some areas the recruitment of larvae today is approaching ≤1% of the level of 40 yr ago (Dekker 2003). The cause of this decline is unknown, and it is necessary to investigate the migratory behaviour and survival rates of silver eels during the reproductive migration in order to understand whether the decline is related to factors acting during that part of the lifecycle. A number of causes for the population collapse have been suggested, including changes in
*Email:
[email protected]
© Inter-Research 2010 · www.int-res.com
264
Aquat Biol 9: 263–270, 2010
ocean currents, climate change, migration obstructions, habitat loss, parasites, virus infections, deteriorating reproductive capacities and over-fishing (Feunteun 2002, Dekker 2003, Knights 2003, Durif et al. 2006). As a consequence of the population collapse, the European Union (EU) has developed a management plan to help recover the eel stocks (COM 2005). One of the key parts of this plan is to set spawning escapement targets for silver eels. This emphasises the need for direct evidence documenting the survival of migrating silver eels in order to implement the EU management plan. Winter et al. (2006) studied downstream migrating silver eels in the River Meuse, The Netherlands and found that survival to the North Sea was only 37%, and that the most significant riverine mortality was associated with hydropower stations and fishing. Hence, the mortality of migrating silver eels may be high in the freshwater phase. Less is known about the marine phase, and there are few studies addressing the survival and progression rates of silver eels in estuaries and at sea. Potentially, migration timing and progression rates may impact survival, and such information may be crucial for the development of successful protective measures. The aim of the present study was to estimate survival and progression rates during migration in the lower part of a river and the first phase of the marine migration, using telemetry methods. In Northern Europe in autumn, there has traditionally been extensive fishing
for silver eels by commercial and recreational fishers using pound nets and fyke nets, especially in fjords and coastal areas. In recent decades, the intensity has declined, but fishing for silver eels still generates considerable income (Moriarty & Dekker 1997). We hypothesised that migrating silver eels would suffer high mortality rates in the fjord, and that progression rates may affect survival, with the slowest-migrating individuals being more prone to fishing mortality (as suggested by Aarestrup et al. 2008).
MATERIALS AND METHODS
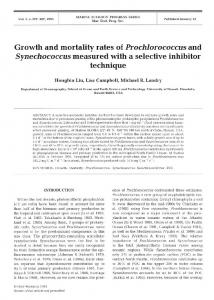
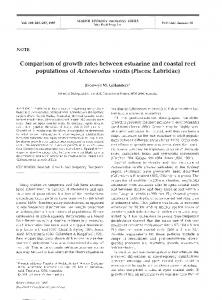
The River Gudenaa (Fig. 1, mean annual discharge of 32 m3 s–1) is the major freshwater source to the narrow Randers Fjord. The River Lilleaa (mean annual discharge of 2.6 m3 s–1), which is one of the most important tributaries to the River Gudenaa (Aarestrup & Jepsen 1998), drains into the River Gudenaa 15 km upstream of the river mouth. The Randers Fjord (30 km long) is principally divided into 2 parts: a narrow inner section and a wider outer section, which exits into the Kattegat. The salinity varies with water discharge in the River Gudenaa, but the fjord can generally be characterised as brackish, but salinity increases with depth and with increasing distance from the river mouth. Fifty downstream migrating silver eels were captured in the autumn of 2005 in a modified Wolf trap situated at the Vestbirk hydropower station in the upper part of the River Gudenaa, and were kept in a holding pen at the catch site for 0 to 6 d. On the 2 days of tagging and release (8 September and 4 October 2005, 10 and 13 d before full moon, respectively; 25 ind. on each date) the fish were transported in aerated 750 l tanks to the Department of Inland Fisheries in Silkeborg, where they were tagged immediDenmark Site 4 ately. They were tagged with VEMCO ALS model V8SC-2L individually coded Kattegat acoustic transmitters (9 × 29 mm, weight in air: 4.7 g, weight in water: 2.9 g, guaranteed life time > 294 d) using the surSite 2 Site 3 Randers Fjord gical implantation method described ALS ALS by Aarestrup et al. (1999). Total body length was measured to the nearest mm Site 1 Tidal limit and body weight to the nearest g. The ALS River Gudenaa largest tag-body weight ratio was 1.5%. Release site All fish were > 55 cm, indicating that they were all females. All individuals River Lilleaa were characterised as silver eels, based 0 5 10 km on the silvery appearance and enlarged eyes (Tesch 2003). After tagging, the eels were transported (travelling time Fig. 1. Release site of silver eels in the River Lilleaa during autumn 2005 and 4 1 h) to the River Lilleaa and released 2 sites with automatic listening stations (ALS) in the lower River Gudenaa and Randers Fjord km upstream of the confluence with the
±
Aarestrup et al.: Survival and progression rates of European silver eel
River Gudenaa at 14:00 h. The release in the River Lilleaa was chosen because of the absence of weirs downstream and because a total covering trap is situated just upstream, hindering migration in the upstream direction. Eight automatic listening stations (ALS; VR2, VEMCO) were deployed at 4 sites in the river and fjord (Fig. 1) and were continuously in operation until September 2006. The listening stations recorded and stored the code and time (to the nearest second) of passage for individual fish within their range. Two ALSs were moored at each site, separated by a few hundred metres in a longitudinal direction, to confirm detection and swimming direction. Detection ranges of each ALS varied between 130 and 400 m during range tests, and the width of the river or fjord varied between 50 and 240 m at the ALS sites. Hence, all tagged fish passing the ALS sites should be recorded. Correspondingly, none of the fish recorded at outward ALS sites had passed any inward ALS site without being recorded. Measured from the release site to the downstream ALS at each site, the 4 sites were located 2.4, 17.3, 29.6 and 46.0 km from the release site (Fig. 1). This design enabled comparison of the survival and behaviour of 4 compartments with different physical characteristics: (1) the small River Lilleaa from the release site to the confluence with the River Gudenaa (2.4 km stretch), (2) the lowest part of the River Gudenaa (14.9 km stretch), (3) the narrow inner section of the Randers Fjord (12.3 km stretch), and (4) the outer section of the Randers Fjord (16.3 km stretch; Fig. 1). Calculation of progression rates were based on the first recording on the downstream ALS at each site. Manual tracking by boat was performed in the fjord on 28 April 2006 to assess if there were any remaining fish/tags in the area. Daily measurements of water flow in the River Gudenaa were obtained from the County of Aarhus discharge gauging station at Ulstrup, a few km upstream of the confluence with the River Lilleaa. Statistical analysis. Progression speeds in the 2 river and 2 fjord compartments of the 17 surviving eels were compared by a repeated-measures analysis of variance (r-m ANOVA) with 1 within-subject factor (compartment) and time of tagging (September and October, fixed factor) as a between-subject factor. Body length and body weight were entered in the model as covariates. All interaction terms were included in the model. Non-significant interaction terms were removed by backwards elimination. R-m ANOVA was preferred to a profile analysis (MANOVA) that has lower power (Maxwell & Delaney 1990, Potvin et al. 1990). To compensate for violation of the sphericity assumption, the degrees of freedom were decreased by multiplication by the Huynh-Feldt epsilon, which is a less conservative adjustment than Greenhouse-Geisser and is rec-
265
ommended when sample sizes are small (von Ende 1993, SPSS 1997). The data were log (X + 1) transformed to meet the requirements of parametric analysis (i.e. normality and homoscedasticity). Tests of within-subject contrasts were achieved by a repeated design (von Ende 1993). Discharge could not be included in the r-m ANOVA because it was not constant across the compartments, e.g. eels in Compartment 1 experienced a different discharge than eels in Compartment 4. Hence there is a potential risk that that a statistically significant result of body size in the r-m ANOVA is a false positive. We therefore performed a multiple regression analysis with progression speed as the dependent variable and body length, body weight and discharge in the river at the time when entering Compartment 3 as independent variables. Two MANOVAs were conducted to test whether there was a difference in body length or body weight (dependent factors) between individuals entering the fjord and those lost at an earlier stage (fixed factor) and between individuals lost in the fjord and those surviving the fjord passage and entering the Kattegat (fixed factor). A Kendall Coefficient of Concordance test (Siegel & Castellan 1988) was performed to test whether individual progression rates (km h–1) of eels keep in similar ranks across the different river/fjord compartments (using the 17 eels that reached the Kattegat). Successively, a logistic regression was performed to test whether survival of eels in Compartment 4 was related to individual progression rates (km h–1) using progression rates in Compartment 3 of survived and lost eels. A constant rate of progression of eels along the entire migratory route combined with a survival independent of progression rate in Compartment 3 would indicate that survival was not dependent on progression rates. Progression speeds in different compartments were compared by the Wilcoxon signed ranks test for paired samples. Functional dependence of 1 variable on another variable was tested by linear and multiple regression analyses. Differences in the number of survived eels through the fjord to the Kattegat between September and October were tested by a Pearson chisquared test. All statistical analyses were performed using the Statistical Package for the Social Sciences (SPSS version 17.0 for Windows).
RESULTS Fish body size The mean body length and weight of the 2 groups of eels were 61.5 ± 1.2 cm (range 56.0 to 84.0 cm) and 441.3 ± 37.3 g (range 306 to 1279 g) and 65.7 ± 1.4 cm
266
Aquat Biol 9: 263–270, 2010
(range 57.2 to 80.6 cm) and 541.0 ± 37.1 g (range 342 to 1002 g) for September and October, respectively. Fish tagged in October were significantly longer, but not heavier, than fish tagged in September (two tailed t-test, body length; t = 2.06, p = 0.03, body weight; t = 2.05, p = 0.09).
Survival Five eels (2 tagged in September and 3 tagged in October) did not leave the River Lilleaa (Site 1), where they were released, and were therefore excluded from further analyses on survival and progression rates. Of the remaining 45 fish, 96% (n = 43) entered the Randers Fjord (inner part, Site 2), 84% (n = 38) entered the outer part of the Randers Fjord (Site 3) and 38% (n = 17) entered the Kattegat (Site 4). Hence, of the eels entering the Randers Fjord, 60% (n = 26) were lost in the fjord, of which 11% (n = 5) were lost in the inner part of the fjord and 49% (n = 21) in the outer part. There was no difference in body length or body weight between individuals entering the fjord and those lost at an earlier stage, with comparisons made both between those lost in the River Lilleaa (n = 5) and the remaining fish (n = 45; MANOVA, F = 0.373, p = 0.773), and between those lost in both river compartments (n = 7) and the remaining fish (n = 43; MANOVA, F = 0.399, p = 0.673). Similarly, there was no difference in body length or body weight between individuals lost in the fjord (n = 26) and those surviving the fjord passage and entering the Kattegat (n = 17) (MANOVA, F = 0.092, p = 0.912). The survival through the fjord to the Kattegat did not differ between fish tagged in September and October (Pearson chi-squared test with Yates’ continuity correction, χ2 = 0.56, p = 0.46). Nine of the eels lost in the fjord (21% of those entering the Randers Fjord) were reported recaptured by fishers in the Randers Fjord, and the transmitters were returned. Two of these fish could not be individually identified because the transmitter was returned after the battery had expired. There was no difference in body weight between eels with a known fate (reported
recaptured in the fjord or entering the Kattegat, n = 24) and those lost in the fjord with an unknown fate (n = 19; 2-tailed t-test, p = 0.387), indicating that fish with an unknown fate were not among the smallest fish selected as would be expected if they were predated by cormorants (see Discussion). No tagged eel was recorded during manual tracking in the inner and outer part of the Randers Fjord in April 2006. Furthermore, no eel was recorded by ALSs in the period from April until ALSs were removed in September 2006.
Progression rates The eels followed a 1-way route out of the river and fjord, with no individuals reversing their migration route, except 1 individual that was recorded at Site 2 after being recorded at Site 3. The eels stayed in the River Lilleaa for an average of 9 d before entering the River Gudenaa (i.e. passing Site 1; Table 1), with 62% leaving within the first 2 d. Further calculations of progression rates are based on time from entering the River Gudenaa to ensure that a possible handling- and tagging-induced delay at the release site was excluded. After entering the River Gudenaa (Site 1), the eels spent on average 7 d before entering the Randers Fjord, and on average 22 d before passing the entire fjord and entering the Kattegat . However, the individual variation was substantial, with the first and last individual entering the Kattegat 3 and 50 d after passing Site 1, respectively (Table 1). The first eel entered the Kattegat on 30 September and the last on 24 November. The r-m ANOVA revealed that the overall progression speed from passing Site 1 to entering the Kattegat was not statistically dependent on ‘body length’, ‘body weight’ or ‘release time’ (p > 0.188). However the within-subjects effects test showed a significant interaction between ‘compartment’ and ‘body length’ (p = 0.02). A post hoc test revealed that this arose from the fact that the progression speed was significantly negatively correlated with body length in Compartment 3 (p < 0.001) compared with Compartment 2 where no
Table 1. Anguilla anguilla. Time spent (mean ± SD; parentheses: range) by tagged silver eels in passing different compartments in the River Lilleaa, River Gudenaa and Randers Fjord. Overground progression rates (mean ± SD; parentheses: range) in the different compartments are also given. n: number of eels that entered a given compartment; bl: body length
Release site to Site 1 Site 1 to 2 Site 1 to 3 Site 1 to 4
Distance (km)
n
2.7 14.6 26.9 43.3
45 43 38 17
Time (h) 218 ± 14 (30–1135) 175 ± 225 (5–938) 461 ± 384 (29–1104) 524 ± 375 (68–1199)
Progression rate (km h–1)
Progression rate (bl s–1)
0.055 ± 0.036 (0.002–0.091) 0.666 ± 0.854 (0.016–2.780) 0.205 ± 0.263 (0.024–0.922) 0.166 ± 0.161 (0.036–0.639)
0.024 ± 0.016 (0.001–0.042) 0.284 ± 0.366 (0.008–1.195) 0.087 ± 0.113 (0.009–0.439) 0.070 ± 0.063 (0.012–0.244)
267
Aarestrup et al.: Survival and progression rates of European silver eel
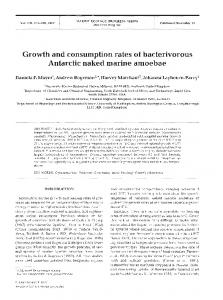
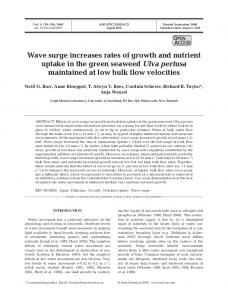
Environmental factors The water discharge in the River Gudenaa varied between 12 and 17 m3 s–1 (average 13 m3 s–1) on the day individuals entered the River Gudenaa, and between 12 and 20 m3 s–1 (average 15 m3 s–1) on the day they entered the Randers Fjord. The progression rate in the River Gudenaa (Compartment 2, km h–1) was not dependent on the water discharge (linear regression r2 = 0.024, p = 0.154), but the progression rate in the inner part of the Randers Fjord increased with increasing water discharge (r2 = 0.180, p = 0.009). The progression rate in the outer part of the fjord was neither dependent on the water discharge in the River Gudenaa on the day they entered the inner Randers Fjord, nor on the day they entered the outer part of the fjord, nor on the day before they entered the outer part of the fjord (r2 = 0.001–0.100, p = 0.21–0.89). The migration was predominantly nocturnal, with all individuals passing all ALS sites between 18:00 and 07:00 h, except 2 individuals passing Site 3 during daytime (Fig. 3).
DISCUSSION The eels were subjected to substantial mortality during the early marine phase, with 60% mortality in the Randers Fjord. Even though only 21% of the fish entering the Randers Fjord were confirmed caught by fishers, most or all the fish lost in the fjord were likely 12
1.2 15
Progression rate (bl s–1)
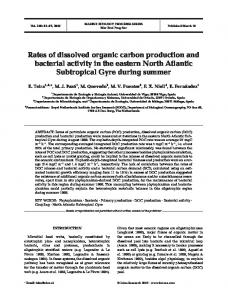
significant effect of length was observed (p = 0.181). Although not statistically significant, the interaction between ‘compartment’ and ‘body weight’ indicated similar pattern (p = 0.056). Thus, progression speed showed a dependence on body size in Compartment 3, unlike in the other compartments where no effects of body size were observed. Discharge was not included in the r-m ANOVA because it was not constant across the compartments, e.g. eels in Compartment 1 experienced a different discharge than eels in Compartment 4. To evaluate whether progression speed dependency on body size in Compartment 3 was a ‘false positive’ due to fact that discharge was not included in the model, a multiple regression was performed with progression speed as the dependent variable and body length, body weight and discharge at the time when entering Compartment 3 as independent variables. This test demonstrated that discharge significantly positively affected the progression speed in Compartment 3 (p = 0, 043, r2 = 0.2). There was no effect of either body length or weight (p > 0.05), thus demonstrating that the significant effect of these 2 factors in the r-m ANOVA was actually caused by discharge, i.e. a ‘false positive’. Progression rates between Site 1 and the entrance to the Kattegat (43 km stretch) was on average 0.17 km h–1, or 0.07 body lengths s–1 (Table 1). The fish entering the Kattegat spent on average 12 d (range 1 to 48 d, SD = 15 d) passing the entire Randers Fjord (Site 2 to Site 4, 28.6 km), corresponding to a mean progression rate of 0.44 km h–1, or 0.19 body lengths s–1 in the fjord. For the eels entering the Kattegat (n = 17), the progression rates relative to the ground differed among the different compartments (River Lilleaa, River Gudenaa and inner and outer part of the Randers Fjord, Friedman test, χ2 = 12.9, p = 0.005), with an increasing progression rate as they proceeded downriver and outwards through the fjord (Fig. 2). The progression rate in the outer part of the fjord was faster than in the inner part of the fjord (Wilcoxon signed ranks test, Z = –2.63, p = 0.009), whereas the progression rate in the inner part of the fjord did not differ from the progression rate in the River Gudenaa (Z = –0.21, p = 0.83). The progression rate in the River Gudenaa was faster than in the River Lilleaa (Z = –2.30, p = 0.022). The logistic regression demonstrated no effect of progression rate in Compartment 3 on survival of eels in Compartment 4. The Kendall Coefficient of Concordance test demonstrated a relatively low but significant inter-rater agreement (W = 0.253, p = 0.005). Thus, the progression of individual eels was relatively constant along the entire migratory route, supporting the conclusion that survival was not dependent on progression rates.
1.0 0.8 24 35 34
0.6 0.4 0.2 0.0 River Lilleaa
River Gudenaa
Inner fjord Outer fjord
Fig. 2. Anguilla anguilla. Progression rates relative to the ground in the 4 different compartments, for eels entering the Kattegat (n = 17). The boxes are divided at the median and the top and bottom of the boxes are drawn at the lower and upper quartiles. Whiskers: 90th percentile. All observations beyond these limits are plotted individually. Q,s: outliers >, < 3 times higher than box length, respectively. Progression speed was slowest in the River Lilleaa, faster in the River Gudenaa and inner fjord and fastest in the outer fjord (see Results for details). bl: body length
Aquat Biol 9: 263–270, 2010
caught by fishers. Based on interviews with fishers, it was confirmed that several tagged eels (exact number not known) had been caught in the fishery without being reported, even though fishers were aware of the tagging project and were rewarded for returning the transmitters. As a tagged eel did not carry any external mark enabling identification of a tagged individual, and since many eels are sold and exported alive, it is also possible that some tagged fish were not reported because the transmitter was not discovered. Since there were no transmitters detected in the fjord during manual tracking in April 2006, and since the hydroacoustic signals are not transmitted through air, the most plausible explanations for fish lost in the fjord without passing outward ALSs are that they were caught by fishers or potentially other mammalian or avian piscivores capable of carrying the rather large tagged eels out of the water. It is unlikely that the largest eels were removed from the fjord by predators, but the smaller eels may have fallen prey to great cormorants Phalacrocorax carbo, which are present in large numbers in the Randers Fjord (K. Aarestrup pers. obs.). Cormorants can prey heavily on smaller eels (mean prey size of eels: 322 g, Keller 1995). However, the tagged individuals that disappeared in the fjord were not smaller than those reported captured in the fishery or surviving and entering the Kattegat, which indicates that the fish disappearing in the fjord were not the smallest fish selected, which would be expected if they were predated by cormorants. Also since high fishing mortality (82%) in the fjord was estimated for even larger spring migrating silver eels (Aarestrup et al. 2008), it is likely that most of the fish disappearing in the present study were caught by fishers. There is a theoretical chance that some fish might have been lost due to transmitter dysfunction, but this seldom occurs with these transmitters (internal tests by the manufacturer have observed no tag failures once the tag is started; D. Webber pers. comm.) and this is therefore not a likely explanation for the major loss of eels in the fjord. When initiating migration, the eels quickly left the river and fjord, entering the Kattegat on average 22 d later (covering a 43 km stretch), although the individual variation in progression rate was large. However, if maintaining the same progression rate as observed in the outer part of the Randers Fjord, only few of the surviving eels would migrate fast enough to reach the Sargasso Sea during the spawning period the following spring (van Ginneken & Maes 2005). Based on the progression rates in the outer part of the Randers Fjord (mean 0.78 ± 0.66 km h–1, range 0.04 to 2.5 km h–1, or mean 0.34 ± 0.30 body lengths s–1, range 0.2 to 1.22 body lengths s–1), these eels would reach the spawning areas in the Sargasso Sea app. 6500 km away in 47 ± 75 mo (range 4 to 249 mo). Only
14
Site 1
12 10 8 6 4 2 0 7
Site 2
6 5 4
Frequency (no. of fish)
268
3 2 1 0 7
Site 3
6 5 4 3 2 1 0 7
Site 4
6 5 4 3 2 1 0 0
2
4
6
8
10
12
14
16
18
20
22
Time (h) Fig. 3. Time of day for passage of individual eels at the different automatic listening station (ALS) sites (note different y-axis scales)
the 3 fastest individuals (18%) would manage to reach the Sargasso Sea within 6 mo if maintaining the progression rates recorded in the outer part of the Randers Fjord. This indicates that the eels either increase their migration rate significantly in the ocean, or spend more than 1 winter to migrate to the Sargasso Sea. The eels showed an increasing progression rate as they proceeded downriver and through the fjord, and it is possible that they increase migration speeds further when they approach the open ocean. Considerably higher short-term individual progression rates have been documented (mean 0.7 m s–1, Tesch 1974; 0.35 to 0.58 m s–1, McCleave & Arnold 1999), but the progres-
Aarestrup et al.: Survival and progression rates of European silver eel
sion speed in the present study is in line with many other studies over longer migration distances (Tesch 2003) and also progression speeds in the ocean of European eel (Aarestrup et al. 2009) and longfinned eels Anguilla diffenbachii (Jellyman & Tsukamoto 2002, 2005). Eel migration seems to be influenced by different environmental factors (e.g. Vøllestad et al. 1986, Cullen & McCarthy 2003, van Ginneken & Maes 2005). In the present study, progression rate in the inner part of the fjord increased with increasing water discharge in the river, but with no effect of water discharge on progression rate in the outer part of the fjord or in the river. The increased progression rates in the inner part of the fjord with increased water discharge may be due to the eels benefiting from an increased current velocity in the narrow inner fjord, as suggested by Vøllestad et al. (1986), who found that high water discharge also increased the riverine migration speed, or may in some way be linked to orientation mechanisms. There was no effect of discharge in the outer fjord, probably because discharge effects are lowered by tidal effects and the larger volume of this part of the fjord. A hierarchy of sensory mechanisms and environmental clues are most likely used for estuarine orientation, but these are only partly understood (Barbin et al. 1998). The eels passed the listening station sites on nearly all occasions during the night, indicating that the migration was predominantly nocturnal, both in the river and fjord. This is in accordance with other studies also reporting mainly nocturnal migration of European eels (e.g. Vøllestad et al. 1986, Aarestrup et al. 2008). Transmitter implantation was not likely to affect eel behaviour over the long term, since eels have been successfully tagged with such transmitters in several studies (e.g Baras & Jeandrin 1998, Behrmann-Godel & Eckmann 2003). However, the faster progression rate in the River Gudenaa than in the River Lilleaa may be explained by the fish spending some time recovering after tagging and handling or by different physical properties of the 2 rivers. The 5 individuals not detected after release may have been caught by fishing in the River Lilleaa, where occasional fishing with fyke nets takes place in the autumn. Otters Lutra lutra also reside in this part of the river. Since this species has been shown to prey heavily on riverine fish (Aarestrup et al. 2005), it is possible that otters may have predated some of the newly released eels. However, it may also have been an effect of catch, transport, handling and tagging, and these fish were, therefore, excluded from analyses. Two of the eels also disappeared in the River Gudenaa. They may have stopped migrating, been predated (e.g. by pike Esox lucius), or caught by recreational fyke netting taking place to a limited extent in the river. However, it is not possible to determine
269
their exact fate, as no manual tracking was performed in the river.
Management implications In conclusion, the present study supported the hypothesis that substantial mortality of silver eels takes place in the fjord, and that fishing may be a major cause of the observed mortality in the early phase of the marine migration. This conclusion applies to large females, as this was the part of the population studied. This high mortality occurred in a relatively short fjord area (29 km) and even though the eels passed this stretch relatively fast (average 12 d). The hypothesis that the slowest-migrating individuals were more prone to fishing mortality than the faster-migrating individuals was not supported. At the included size range, there was no indication of size selection of eels in the fishery. Eel populations are declining worldwide, and the need for information is immense (Stone 2003). The recent EU recovery plan (COM 2005) has set an escapement goal for silver eels out of the foraging areas at 40% of the historic production. With only 38% survival in the lower river and fjord in the present study, the goal is not met when looking at only this part of the system. When considering that a high mortality may also occur during the freshwater migration phase (Winter et al. 2006), the spawning escapement of European silver eel may be very low. In combination with 23% survival related to hydropower production in the middle part of the river (M. Pedersen unpublished data), the overall survival of silver eel commencing migration from the upper and middle parts of the River Gudenaa to reaching the Kattegat may be