Sustaining Sustainability: Creating a Systems Science in a Fragmented Academy and Polarized World John D. Sterman
Abstract From climate change, deforestation, and depletion of fossil fuels to overexploited fisheries, species extinction, and poisons in our food and water, our society is unsustainable and it is getting worse fast. Many advocate that overcoming these problems requires the development of systems thinking. We have long been told that the unsustainability of our society arises because we treat the world as unlimited and problems unconnected when we live on a finite “spaceship Earth” in which “there is no away” and “everything is connected to everything else.” The challenge lies in moving from slogans to specific tools and processes that help us understand complexity, design better policies, facilitate individual and organizational learning, and catalyze the technical, economic, social, political, and personal changes we need to create a sustainable society. Here I outline a design for a systems science of sustainability that rises to this challenge. Where the dynamics of complex systems are conditioned by multiple feedbacks, time delays, accumulations, and nonlinearities, our mental models generally ignore these elements of dynamic complexity; where the consequences of our actions spill out across time and space and across disciplinary boundaries, our universities, corporations, and governments are organized in silos that focus on the short term and fragment knowledge. I describe how sustainability research, teaching, and engagement with the policy process can be organized to provide scientifically grounded, reliable knowledge that crosses disciplinary boundaries, that engages multiple stakeholders, that grapples with unavoidable issues of ethics, values, and purpose, and that leads to action. Keywords Sustainability • System dynamics • Limits to growth • Ecological footprint • Overconsumption • Mental models
J.D. Sterman (*) MIT Sloan School of Management, E62-436,100 Main Street, Cambridge, MA 02142, USA e-mail:
[email protected] M.P. Weinstein and R.E. Turner (eds.), Sustainability Science: The Emerging Paradigm and the Urban Environment, DOI 10.1007/978-1-4614-3188-6_2, © Springer Science+Business Media, LLC 2012
21
22
J.D. Sterman
The Challenge First, the bad news: our civilization is unsustainable and it’s getting worse fast. Humanity is overwhelmingly dependent on nonrenewable resources, especially fossil fuels, and the resulting greenhouse gas (GHG) emissions are rapidly changing the climate (IPCC 2007). Most of the world’s fisheries are overexploited, and world capture fishery production is falling (FAO 2008). Extinction rates “exceed normal background rates by two to three orders of magnitude” with one-fifth of tracked species “classified as Threatened” (Hoffman et al. 2010). The food we eat, water we drink, and products we consume expose us to carcinogens and endocrine disruptors (e.g., US EPA http://www.epa.gov/iris). Humanity’s total ecological footprint exceeds the global carrying capacity (Wackernagel et al. 2002). We have exceeded sustainable planetary boundaries for vital elements of the ecosystems upon which our lives depend, including GHGs, nitrogen, and biodiversity loss (Rockström et al. 2009). And the demands we place on those ecosystems are growing: world population, which reached 7 billion in 2011, is projected to exceed 9.3 billion by 2050 and 10.1 billion by 2100 (United Nations 2011). Real Gross World Product (GWP) is growing at an average rate of 3.5% y−1 (World Bank 2010). Billions in developing nations legitimately seek to rise out of poverty and live like those in the developed world, with the housing, refrigerators, air conditioners, flat screen TVs, cars, jet travel, vacations, and consumption that lifestyle entails, while those in the developed world seek even greater consumption than they enjoy today. The good news? After decades of false starts, “sustainability” is becoming mainstream. Most large corporations have programs promoting corporate social responsibility and environmental stewardship. Universities, including business schools, offer sustainability courses and programs. Scholarly papers and journals devoted to sustainability are growing. Store shelves in developed nations stock more and more eco-friendly products. EnergyStar, LEED, fair trade, and other certification programs abound. Toyota has sold over one million Priuses™ in the USA, and consumers can choose among efficient hybrid, plug in hybrid, and electric vehicles offered by a growing number of carmakers. Firms from GE to Walmart have committed themselves to sustainability, and even oil companies trumpet their devotion to the environment. To paraphrase fictional Wall Street profiteer Gordon Gecko, “green is good.” But is the burgeoning sustainability movement itself sustainable? And do current approaches to sustainability actually make a difference to the sustainability of human society? The answer to both questions is no. Despite notable successes and many important contributions, the current sustainability movement, in business, public policy, and education, is neither effective nor itself sustainable. Why not, and what can be done? Here I argue that the most efforts by firms, individuals and governments in the name of sustainability are directed at symptoms of unsustainability rather than causes. These include policies to reduce waste, cut energy and material use, reduce GHG emissions, promote green products and local consumption, and so on. Many
Sustaining Sustainability: Creating a Systems Science in a Fragmented Academy…
23
of these activities are necessary to create a more sustainable society and economy. But they are not sufficient. They fail to address the underlying source of the unsustainable world we have created. I argue that the focus on symptoms and lowleverage policies reflects a widespread failure of systems thinking. We have long been told that the unsustainability of our society arises because we treat the world as unlimited and problems unconnected when we live on a finite “spaceship Earth” in which “there is no away” and “everything is connected to everything else.” Many sustainability advocates argue that overcoming these problems requires the development of systems thinking (e.g., Suzuki 2007; McKibben 2010; Senge et al. 2008). If the world’s peoples developed a more holistic appreciation of the intricate interconnections binding us to one another and to nature, it is argued, we would internalize social and environmental externalities, consider the welfare of future generations in making decisions today, and act in consonance with our collective long-term best interests. I agree. The challenge lies in moving from slogans about systems to specific tools and processes that help us understand complexity, design better policies, facilitate individual and organizational learning, and catalyze the technical, economic, social, political, and personal changes we need to create a sustainable society. Here I outline a design for a systems science of sustainability that rises to this challenge. First, I describe the characteristics of complex systems that lead to policy resistance—the tendency for our attempts to solve problems to be defeated by unintended reactions of the system to these interventions. Policy resistance arises from the gap between the complexity of the systems in which we live and the often simplistic and erroneous mental models of those systems that guide our decisions and behavior, from the short time horizons we consider, and from the fragmentation of knowledge into disciplinary silos. I illustrate some of the specific tools of systems thinking with a variety of examples. The goal is to design sustainability research, teaching, and engagement with the policy process that generates scientifically grounded, reliable knowledge that crosses disciplinary boundaries, that engages multiple stakeholders, that grapples with the unavoidable issues of ethics, values, and purpose, and that leads to action.
Characteristics of Complex Systems Policy Resistance Thoughtful leaders throughout society increasingly suspect that the policies we implement to address difficult challenges have not only failed to solve the persistent problems we face, but are in fact causing them. All too often, well-intentioned programs create unanticipated “side effects.” The result is policy resistance, the tendency for an intervention to be defeated by the system’s response to the intervention itself (Forrester 1969, 1971a; Sterman 2000). Forest fire prevention and suppression policies work in the short run, but as a consequence of initial success, the
24
J.D. Sterman
fuel burden builds, increasing the incidence and severity of fires. Buying vehicles with better gas mileage in response to high gasoline prices reduces the demand for petroleum, lowering gas prices and undermining the demand for more efficient cars. Powerful pumps help farmers access deep aquifers in arid regions, but speed the drop in the water table, reducing water availability. In these and many other cases, our best efforts to solve problems often make them worse (Table 1). Table 1 Examples of policy resistance • Road building programs designed to reduce congestion have increased traffic, delays, and pollution (Sterman 2000) • Low tar and nicotine cigarettes actually increase intake of carcinogens, carbon monoxide, and other toxics as smokers compensate for the low nicotine content by smoking more cigarettes per day, by taking longer, more frequent drags, and by holding the smoke in their lungs longer (Tengs et al. 2005) • Health plan policies “limiting what drugs can be prescribed—intended to prevent the unnecessary use of expensive drugs—[are] having the unintended effect of raising medical costs” (Horn et al. 1996) • Antilock brakes and other automotive safety devices cause some people to drive more aggressively, partially offsetting their benefits (Wilde 2002) • Forest fire suppression causes greater tree density and fuel accumulation, leading to larger, hotter, and more dangerous fires, often consuming trees that previously survived smaller fires unharmed (US Forest Service 2003) • Flood control efforts such as levee and dam construction have led to more severe floods by preventing the natural dissipation of excess water in flood plains. The cost of flood damage has increased as flood plains were populated in the belief they were safe (Sterman 2000) • The impacts of large dams “are more negative than positive and, in many cases, have led to irreversible loss of species and ecosystems” (World Commission on Dams 2000) • Antibiotics have stimulated the evolution of drug-resistant pathogens, including multipleresistant strains of TB, S. aureus, and sexually transmitted diseases (Fong and Drlica 2003) • Pesticides and herbicides have stimulated the evolution of resistant pests, killed off natural predators, and accumulated up the food chain to poison fish, birds, and, in some cases, humans (Palumbi 2001) • Despite dramatic gains in income per capita and widespread use of labor-saving technology, Americans have less leisure today than 50 years ago and are no happier (Layard 2005; Kahneman et al. 1999)
Policy resistance arises from a narrow, reductionist worldview. We have been trained to view our situation as the result of forces outside ourselves, forces largely unpredictable and uncontrollable. Consider the “unanticipated events” and “side effects” so often invoked to explain policy failure. Political leaders blame recession on corporate fraud or terrorism. Managers blame bankruptcy on events outside their organizations and (they want us to believe) outside their control. But there are no side effects—just effects. Those we expected or that prove beneficial we call the main effects and claim credit. Those that undercut our policies and cause harm we claim to be side effects, hoping to excuse the failure of our intervention. “Side effects” are not a feature of reality but a sign that the boundaries of our mental models are too narrow, our time horizons too short. Policy resistance also arises from a mismatch between the characteristics of complex systems (Table 2) and the simplistic mental models we use to make decisions.
Sustaining Sustainability: Creating a Systems Science in a Fragmented Academy…
25
Table 2 Policy resistance arises because systems are • Constantly changing: Heraclitus said, “all is change.” What appears to be unchanging is, over a longer time horizon, seen to vary. Change occurs at many time scales, and these different scales sometimes interact. A star evolves over billions of years as it burns its hydrogen fuel, but can explode as a supernova in seconds. Bull markets can rise for years, then crash in a matter of hours • Tightly coupled: the actors in the system interact strongly with one another and with the natural world. Everything is connected to everything else. “You can’t do just one thing” • Governed by feedback: because of the tight couplings among actors, our actions feed back on themselves. Our decisions alter the state of the world, causing changes in nature and triggering others to act, thus giving rise to a new situation, which then influences our next decisions • Nonlinear: effect is rarely proportional to cause, and what happens locally in a system (near the current operating point) often does not apply in distant regions (other states of the system). Nonlinearity often arises from basic physics: bacteria in a river can convert sewage into harmless byproducts until the sewage load becomes so large that dissolved oxygen is depleted, at which point the fish die and anaerobic bacteria produce toxic hydrogen sulfide. Nonlinearity also arises as multiple factors interact in decision-making: pressure from the boss for greater achievement increases your motivation and effort—up to the point where you perceive the goal to be impossible. Frustration then dominates motivation—and you give up or get a new boss • History dependent: many actions are irreversible: you cannot unscramble an egg (the second law of thermodynamics). Stocks and flows (accumulations) and long time delays often mean doing and undoing have fundamentally different time constants: during the 50 years of the Cold War arms race the nuclear nations created more than 250 tons of weapons-grade plutonium (239Pu). The half-life of 239Pu is about 24,000 years • Self-organizing: the dynamics of systems arise spontaneously from their internal structure. Often, small, random perturbations are amplified and molded by the feedback structure, generating patterns in space and time. The stripes on a zebra, the rhythmic contraction of your heart, and persistent cycles in predator–prey populations and the real estate market all emerge spontaneously from the feedbacks among the agents and elements of the system • Adaptive and evolving: the capabilities and behaviors of the agents in complex systems change over time. Evolution leads to selection and proliferation of some agents while others become extinct. People adapt in response to experience, learning new ways to achieve their goals in the face of obstacles. Learning is not always beneficial, however, but often superstitious and parochial, maximizing local, short-term objectives at the expense of long-term fitness and well-being • Characterized by trade-offs: time delays in feedback channels mean the long-run response of a system to an intervention is often different from its short-run response. Low leverage policies often generate transitory improvement before the problem grows worse, while high leverage policies often cause worse-before-better behavior • Counterintuitive: in complex systems cause and effect are distant in time and space, while we tend to look for causes near the events we seek to explain. Our attention is drawn to the symptoms of difficulty rather than the underlying cause. High leverage policies are often not obvious • Policy resistant: the complexity of the systems in which we are embedded overwhelms our ability to understand them. As a result, many seemingly obvious solutions to problems fail or actually worsen the situation
26
J.D. Sterman
Where the consequences of our actions spill out across space and time, we tend to focus on the local and short term. Where complex systems are dynamic, tightly coupled, governed by feedback, nonlinear, self-organizing, adaptive, and evolving, our mental models tend to be static and narrow. We ignore interconnections and the delayed and distal impacts of our decisions. We divide the world into silos, whether a firm, with separate and often competing fiefdoms of sales, production, finance, research, and so on; governments with separate departments of energy, interior, agriculture, transportation, and so on; or universities with separate departments and disciplines. Much of the debate around sustainability frames the issue as conflict between the economy and the environment, as if these were distinct domains competing against one another: growth vs. social justice, jobs vs. nature, logging vs. spotted owls, polar bears vs. drilling in the Arctic National Wildlife Refuge. But these boundaries are not features of reality. They are mental constructs. Boundaries are “invisible fences in the mind” (Sterman 2002), the result of the mental models we create, the categories into which we place people. Without underestimating the differing interests that arise in a heterogeneous population, I argue that framing sustainability as a zero-sum game of contending objectives reflects a narrow and deeply dysfunctional mental model. The economy, society, and environment are not separate domains to be traded off against one another. The economy is embedded in a social and political context, which in turn is embedded in ecosystems upon which all life depends. The interests of business, society, and the environment are therefore fundamentally aligned: We cannot have healthy firms, a healthy economy and healthy people if growth and the pursuit of profit destroys the environment, and we cannot have a healthy environment if people live in poverty, ill-fed, without decent housing, health care, education, or economic opportunity. Environmentalists tend to stress the first half of this mutual dependency: Destroy the environment and we destroy both society and the economy. But it is equally true that the health of the environment depends on a society and economy that secures people’s human rights and fulfills people’s needs. Where there is poverty, hunger, conflict, and war, there the environment suffers. Creating an effective science of sustainability and building the public understanding required for action requires us to develop the skill to recognize the boundaries of our mental models and then expand them so that we become aware of and take responsibility for the feedbacks created by our decisions.
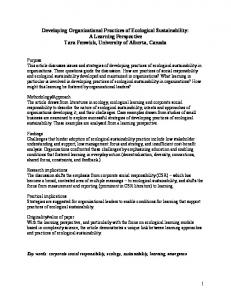
Feedback: (Almost) Nothing Is Exogenous Contrary to the open-loop mental model so prevalent in people’s thinking, the world reacts to our interventions (Fig. 1). There is feedback: Our actions alter the environment and therefore the decisions we make tomorrow. Our actions may trigger so-called side effects we did not anticipate. Other agents, seeking to achieve their goals, act to restore the balance we have upset; their actions also generate intended and unintended consequences.
Sustaining Sustainability: Creating a Systems Science in a Fragmented Academy…
27
Fig. 1 Sources of policy resistance. The boundary of the decision-makers’ mental model is represented by the thin lines, showing the basic feedback loop through which we seek to bring the state of the system in line with our goals. Policy resistance arises when we fail to account for the so-called side effects of our actions, the responses of other agents in the system, human and natural (and the unanticipated consequences of these), the ways in which experience shapes our goals, and the time delays often present in these feedbacks
It is hard to underestimate the power of the feedback view. Indeed, almost nothing is exogenous. Ask people to name processes that strongly affect human welfare but over which we have no control, and many people cite the weather, echoing Mark Twain’s famous quip that “everybody talks about the weather, but nobody does anything about it.” But today even the weather is endogenous. We shape the weather around the globe, from global warming to urban heat islands, the Antarctic ozone hole to the “Asian brown cloud.” Human influence over the weather is now so great that it extends even to the chance of rain on the weekend. Cerveny and Balling (1998) showed that there is a 7-day cycle in the concentration of aerosol pollutants around the eastern seaboard of the USA. Pollution from autos and industry builds up throughout the workweek and dissipates over the weekend. They further show that the probability of tropical cyclones around the eastern seaboard also varies with a 7-day cycle. Since there are no natural 7-day cycles, they suggest that the weekly forcing by pollutant aerosols affects cloud formation and hence the probability of rain. Their data show that the chance of rain is highest on the weekend, while on average the nicest day is Monday, when few are free to enjoy the out of doors. Weekly cycles in temperature, cloud cover, and other meteorological variables have now been documented in many regions of the world (Forster and Solomon 2003; Bäumer and Vogel 2007; Laux and Kunstmann 2008). Few people understand that driving that SUV to work helps spoil their weekend plans. In similar fashion, we are unaware of the majority of the feedback effects of our actions. Instead, we see most of our experience as a kind of weather: something that happens to us but over which we have no control. Failure to recognize the feedbacks in which we are embedded, the ways in which we shape the situation in which we find ourselves, leads to policy resistance as we persistently react to the symptoms of difficulty, intervening at low leverage points and triggering delayed and distal, but
28
J.D. Sterman
powerful, feedbacks. The problem intensifies, and we react by pulling those same policy levers with renewed vigor, at the least wasting our talents and energy, and all too often, triggering an unrecognized vicious cycle that carries us farther and farther from our goals. Pumping water from deep aquifers for irrigation causes the water table to fall, requiring more powerful and costly pumps. To offset the rising costs, governments often subsidize electric power for the farmers, increasing pump use and speeding the drop in the water table and need for subsidies. Policy resistance breeds a sense of futility about our ability to make a difference. One of the challenges in building a more sustainable world is helping us to see ourselves as part of a larger system in which our actions feed back to shape the world in ways large and small, desired and undesired. The greater challenge is to do so in a way that empowers us to take action instead of reinforcing the belief that we are the helpless victims of systems we can neither comprehend nor change, mere leaves tossed about by storm systems of inscrutable complexity and scope. All dynamics arise from the interaction of just two types of feedback loops, reinforcing (or positive) and balancing (or negative) loops (Fig. 2).1 Reinforcing feedbacks tend to amplify whatever is happening in the system: the larger a population, the greater the number of births, further increasing the population. The greater a nation’s investment in capital plant, equipment, and infrastructure, the larger its gross domestic product (GDP) becomes, increasing the resources available for investment still further. The higher the concentrations of GHGs such as carbon dioxide and methane in the atmosphere, the warmer the earth becomes; as higher temperatures melt permafrost, bacteria metabolize previously frozen organic matter, releasing still more CO2 and methane and leading to still more warming. These self-reinforcing feedbacks are all processes that generate their own growth, leading, respectively, to population and economic growth and the potential for runaway climate change. Balancing feedbacks counteract and oppose change. The larger a population relative to the carrying capacity of its environment, the lower the net birth rate will be, slowing population growth. The more oil we discover, the less remains to be discovered in the future. High levels of air and water pollution harm human health, leading to political pressure for action and, eventually, regulations to limit pollutant concentrations. These loops all describe self-correcting processes that seek balance and equilibrium. Research on mental models shows few incorporate any feedback loops. Axelrod (1976) found virtually no feedback processes in the cognitive maps of political leaders. Dörner (1980, 1996) found that people tend to think in single-strand
1 The scientific literature generally uses the terms “positive” and “negative” to denote self-reinforcing and self-correcting feedbacks. However, laypeople persistently conflate “positive feedback” with “good” and “negative feedback” with “bad,” as in “my boss gave me negative feedback on my performance.” However, either type of feedback can be good or bad, depending on how the loop is operating and on one’s values. The positive feedback of compound interest on credit card debt is “bad” if you are the debtor, but “good” for the card issuer. To avoid the confusion, I use the terms reinforcing and balancing rather than positive and negative.
Sustaining Sustainability: Creating a Systems Science in a Fragmented Academy…
29
Reinforcing feedback: Reinforcing loops are selfreinforcing. In this case, more chickens lay more eggs,
+ Eg gs
Chi cke ns
R
which hatch and add to the chicken population, leading to still more eggs, and so on. A Causal Loop Diagram (Sterman 2000) captures the feedbacks in a system. The arrows indicate the causal relationships. The + signs at the
+
arrowheads indicate that the effect is positively related to
A system s feedback structure
the cause: an increase in the chicken population causes the number of eggs laid each day to rise above what it
generates its dynamics
would have been (and vice versa: a decrease in the chicken population causes egg laying to fall below what it would have been). The loop is self-reinforcing, hence the loop polarity identifier R. If this loop were the only one
Chickens
operating, the chicken and egg population would both grow
Eggs
exponentially. Of course, no real quantity can grow forever. There must
Time
be limits to growth. These limits are created by balancing feedbacks.
Structure:
Balancing feedback: Balancing loops are self-correcting.
+ Chickens
B
Road Crossings
They counteract change. As the chicken population grows, various self-correcting loops will act to balance the chicken population with its carrying capacity. One classic feedback is shown here: The more chickens, the more road
-
crossings they will attempt. If there is any traffic, more road crossings will lead to fewer chickens (hence the —
Behavior:
[negative] polarity for the link from road crossings to chickens). An increase in the chicken population causes more risky road crossings, which then bring the chicken
Road Crossings
population back down. The B in the center of a loop denotes a balancing feedback. If the road-crossing loop was the only one operating (say because the farmer sells
Chickens
all the eggs), the number of chickens would gradually
Time
decline until none remained. All systems, no matter how complex, consist of networks of reinforcing and balancing feedbacks, and all dynamics arise from the interaction of these loops with one another.
Fig. 2 Reinforcing and balancing feedback loops
causal series and had difficulty in systems with side effects and multiple causal pathways, much less feedback loops. Booth Sweeney and Sterman (2007) found limited recognition of feedback processes among both middle school students and their teachers. People tend to assume each effect has a single cause and often cease their search for explanations when the first sufficient cause is found (see, e.g., Plous 1993).
30
J.D. Sterman
Compounding the lack of feedback in people’s mental models, research also shows that people do not understand the behavior of even the simplest feedback systems. Wagenaar (1978) and Wagenaar and Sagaria (1975) studied people’s ability to understand exponential growth processes. They found people tend to extrapolate linearly instead of exponentially, assuming a quantity increases by the same absolute amount per time period, while exponential growth doubles the quantity in a fixed period of time. When the growth rate and forecast horizon are small, linear extrapolation is a reasonable approximation to exponential growth. However, as the growth rate increases or the forecast horizon lengthens, the errors become huge. I often demonstrate this phenomenon in my classes with the “paper folding” task, starting with a sheet of copy paper, which I show the students is about 0.1 mm thick: “Consider an ordinary sheet of paper like this one. Fold it in half. Fold the sheet in half again. The paper is still less than half a millimeter thick. If you were to fold the paper 40 more times, how thick would it be? Do not use a calculator. We are interested in your intuitive judgment. Along with your estimate, give your 95% upper and lower confidence bounds for your estimates (i.e., a range of estimates you are 95% sure includes the right answer. Your 95% confidence bound means you believe there is only a 5% chance the correct answer falls outside the upper and lower bounds you give).” Lower bound (95% sure it is between lower and upper bound)
Your estimate
Upper bound (95% sure it is between lower and upper bound)
42 folds
Typical of results with a wide range of audiences, the median estimate in a sample of 95 graduate students at the MIT Sloan School of Management was 0.05 m (less than 2 in.), and the mean, skewed by a few who offered higher numbers, was 134 km (»83 miles). The correct answer? Each fold doubles the thickness of the paper. After 42 doublings the thickness has increased by a factor of 242 » 4.4 trillion, from 0.1 mm to 440,000 km (»273,000 miles), farther than the distance from the earth to the moon. The mean response is only 0.03% of the correct value. None of the confidence bounds included the correct value—not only do we fail to understand exponential growth, but we are grossly overconfident in our judgments (see, e.g., Plous 1993). Some students provided the correct formula, but still failed to grasp its implications, such as the student who wrote, correctly, that the paper would be “0.1 mm*242 thick,” but whose upper confidence limit was 1.2 km, less than three-quarters of a mile. These misperceptions of reinforcing feedback and exponential growth are powerful barriers to understanding the sustainability challenge. For most of our existence as a species on the planet, humans were small in number and population growth slow. People had limited power to deplete resources and poison the environment. To be sure, humans could and did despoil local environments (e.g., Diamond 2005), but the consequences, though severe for the affected populations, remained local; in most cases people could move to regions where resources were abundant
Sustaining Sustainability: Creating a Systems Science in a Fragmented Academy…
31
+ Net R Population Births + Population + Growth
Fractional Net Birth Rate + Gross World Net R Product Investment + + Economic Growth
Fractional Net Investment Rate
Fig. 3 Reinforcing feedbacks underlying population and economic growth. Source: population: UN (2011); GWP: 1970–2010: World Bank, http://databank.worldbank.org; 1950–1970: Worldwatch Institute, Signposts 2001
(though such migrations often triggered conflict and war). But exponential growth explodes very quickly. World population reached one billion sometime in the early 1800s, roughly 100,000 years after modern humans evolved, but it took only about a century to reach two billion. Only about 40 years were required to add the next billion. World population by the end of 2011 was roughly seven billion (Fig. 3) and it took only about a dozen years to add that last billion. More important, the impact of that population is growing even faster. Real Gross World Product (GWP) grew from 1950 to 2009 at an average rate of 3.5% y−1 (Fig. 3), doubling every 20 years. At that rate, in a century, the real value of goods and services produced worldwide would grow by a factor of 32. Such astounding growth in population and material throughput cannot continue indefinitely on a finite planet. The question is not if growth will cease, but when and how. Yet corporations seek ever-growing sales, governments strive for ever-greater economic growth, and individuals desire ever-higher incomes. Many believe that the goal of environmental policy is to enable “sustainable growth,” an impossibility. Material growth in a finite world must eventually cease; by definition it cannot be sustained (for excellent discussion, see e.g., Meadows et al. 2004; Daly 1991; Daly and Townsend 1993). Yet, as I write this (August, 2011), Google returns over seven million results for the term “sustainable growth” and hundreds of organizations, including firms and well-intentioned environmental groups, promote “sustainable growth” and other oxymoronic constructs that reinforce the idea that endless growth is not only possible but a worthy goal. Thus, “DuPont has a mission of sustainable
32
J.D. Sterman
growth, which we define as the creation of shareholder and societal value while we reduce our environmental footprint along the value chains in which we operate.” The Clinton Foundation offers its “Sustainable Growth Initiative.” And the World Environmental Organization lists the “100 top sustainable growth sites.”2
Nonlinearity The interactions among the feedbacks in complex systems are typically nonlinear. Consider the interaction of a population with the carrying capacity of its environment (Fig. 4). The population could be yeast in a Champagne cask or the population of earth. The larger the population, the more net births, forming the reinforcing population growth feedback R1 and leading to exponential growth—as long as the fractional net birth rate is constant. However, every organism grows in the context of its carrying capacity. The carrying capacity is the size of the population the habitat of that species can support. It is determined by the resources available in the environment and the resource requirements of the population (e.g., sugar for the Champagne yeast). As the population approaches its carrying capacity, resources per capita fall, reducing the fractional net birth rate and slowing population growth, forming the balancing “limits to growth” feedback, B1. In general, a population depends on many resources, each creating a balancing feedback that can limit growth. The constraints that are most binding determine which balancing loops will be most influential as the population grows: fermentation can be stopped by either depletion of the sugar the yeast consume or a rise in the concentration of the alcohol they produce as waste. The relationship between the ratio of population to carrying capacity and the net fractional birth rate must be downward sloping: when population is small relative to the carrying capacity, resources are abundant, each organism has all the resources it needs, and the population grows at its maximum fractional rate. As resources become scarce, however, fertility falls and mortality increases, lowering the net fractional birth rate, until, when the population equals the carrying capacity, resources are just scarce enough to halt growth. If resources became even more scarce—if, say, the carrying capacity dropped—then the population would fall, raising resources per capita until equilibrium is again reached. The relationship between net births and population is highly nonlinear. When population is small and resources abundant, the reinforcing population growth feedback dominates the dynamics of the system. But as the population grows, the balancing Limits to Growth loop becomes stronger, and eventually dominates the system dynamics. If the carrying capacity is fixed and there are no significant time delays in the balancing feedback then the population
2
http://www2.dupont.com/Our_Company/en_US/glance/sus_growth/sus_growth.html, http://www. clintonfoundation.org/what-we-do/clinton-giustra-sustainable-growth-initiative, http://www.world. org/weo/growth.
Sustaining Sustainability: Creating a Systems Science in a Fragmented Academy…
33
+ R1 Net Births Population + Population + Growth B1 Fractional Net Limits to Birth Rate Growth +
Resource Adequacy
Carrying Capacity
+
Top: Feedback structure for growth of any population relative to its carrying capacity. Bottom: the dynamics of the population resulting from the nonlinear relationship between population relative to carrying capacity and net births.
Top: Fractional net birth rate; Bottom: Total net births; both as functions of population relative to the carrying capacity.
Fig. 4 Nonlinear interaction of population and carrying capacity
will follow an S-shaped path, as seen in Fig. 4. However, for most species the carrying capacity is endogenous and there are long delays in the system; population growth can then degrade and overshoot the carrying capacity, leading to population decline or collapse.
Tipping Points Nonlinear interactions of populations with their carrying capacity often create the possibility of sudden shifts in resource abundance. Consider the Atlantic cod, Gadus morhua. When Europeans began to fish in the rich waters off the east coast of North America, cod, a predator with few natural enemies, had reached the carrying capacity of their marine environment (Rosenberg et al. 2004). Stocks were immense: John Cabot, exploring Newfoundland in 1497, noted the cod were so thick they nearly blocked his ship (Kurlansky 1997). Fishers easily filled their holds, but because the total take was small, the balancing feedback dominated: by taking a few cod, fishers increased the abundance of food for those that remained, so stocks rapidly recovered. For decades, the more fishers caught, the more grew
34
J.D. Sterman
back, leading them to conclude that there were no limits. Many scientists agreed, including biologist T. H. Huxley (1883), who famously declared: I believe, then, that the cod fishery, the herring fishery, the pilchard fishery, the mackerel fishery, and probably all the great sea fisheries, are inexhaustible; that is to say, that nothing we do seriously affects the number of the fish.3
However, as the catch continued to grow, cod stocks eventually fell below the maximum sustainable yield. At that point, the reinforcing population growth loop dominated the dynamics, but now operating as a vicious cycle of smaller populations, fewer net births, and a still smaller population. The fishery collapsed, taking with it the livelihood of the fishers and the communities that depended on them, from St. Johns, Newfoundland to New Bedford, Massachusetts. Fig. 5 shows a simulation of the model in Fig. 4 configured to represent a fishery. The fleet grows exponentially at a modest rate of 2% y−1. As the growing catch reduces the stock of cod, recruitment (the net addition to the stock of fish) rises, almost compensating for the catch, so the population declines only slowly. But by about year 225, the tipping point is reached: + Catch per Boat Fleet Size B2 Fishing Effectivneess
+
+
Catch
+ Recruitment
-
+
R1
Fish Stock
Population Growth B1 Limits to Growth Fish Density
+
Fig. 5 Environmental tipping point: The fishing fleet (potential catch) grows at a constant rate of 2% y−1. The fishery collapses when stocks fall enough to push the system into the regime in which recruitment falls because there are simply too few fish to replace the catch
3
Huxley’s analysis was, for the day, rather nuanced, and he did not believe that all fisheries were inexhaustible. He considered oyster beds and riverine salmon fisheries to be exhaustible, and recognized the tragedy of the commons, concluding that in such cases “Man is the chief enemy, and we can deal with him by force of law. If the stock of a river is to be kept up, it must be treated upon just the same principles as the stock of a sheep farm.”
Sustaining Sustainability: Creating a Systems Science in a Fragmented Academy…
35
stocks have declined so much that recruitment begins to fall. Now the dynamics are dominated by the vicious cycle of fewer fish, lower recruitment, and a still smaller fish population. Although the precipitous decline in stocks soon forces catch per boat down (via the balancing Fishing Effectiveness loop, B2), the total catch still exceeds recruitment, so fish stocks continue to drop until the cod are extirpated.
Eroding Goals Surely fishers would limit the catch before the tipping point is crossed. Because fish are common pool resources, stocks are vulnerable to the “Tragedy of the Commons” (Hardin 1968), in which overexploitation is the outcome of rational decision making because the benefits of taking more accrue to individual fishers, while the costs (lower future catch) are borne by all. Further, experimental studies (Moxnes 2000) show that even when the common pool resource problem is absent, people’s poor understanding of resource dynamics leads to overexploitation and, often, collapse. More optimistically, Ostrom (2010) demonstrates how communities can establish sustainable harvesting for a variety of common pool resources. Communities that agree on and enforce limits on the harvest of their resources create an important balancing feedback, shown in Fig. 6 as the Catch Limit loop, B3. + Catch per Boat Fleet Size B2
Fishing Effectivneess
+ Catch
+ -
+ Recruitment
-
+
R1
Fish Stock
B3
Catch Limits
+
Catch Limits
Population Growth
- Stock Relative to Target
B1
Limits to Growth Fish Density
+ + Target Stock
Fig. 6 Catch limits: fishery collapse can be avoided if the members of the community agree to lower the catch as stocks fall below a target (B3)—if the target is high enough
36
J.D. Sterman
As the resource stock falls relative to a target, the community voluntarily limits its catch. If the target is high enough—and if enforcement or social norms prevent free riders from taking more than their share—the stock stabilizes above the tipping point and the resource can be sustained. Few goals are absolute. How much should you weigh? What grades should a student earn? How much income is enough? When goals are not absolute, selfevident, and obvious, they co-evolve endogenously with the state of the system. To reduce cognitive dissonance (Festinger 1957), we adapt to our circumstances, redefining what we consider “normal” and “acceptable” to match our situation. Then, as our goals erode, so too do our efforts to improve system performance, a reinforcing feedback that can lead to path dependence and self-fulfilling prophecy (Forrester 1969; Sterman 2000). Thus, we buy larger clothes when we gain weight, literally easing the pressure that might motivate us to eat less and exercise more; teachers often adjust their beliefs about a student’s ability toward that student’s grades, providing more help to those they conclude are gifted and less to those they believe to lack potential, further boosting the achievement of the favored while the rest fall farther behind (Rosenthal and Jacobson 1968); as we consume more we become habituated to our higher standard of living, leading us to strive for still greater income (Kahneman et al. 1999; Layard 2005). Eroding goals are particularly common in sustainability contexts due to our imperfect understanding of ecosystem dynamics. Due to limited information, natural variability, and limited knowledge of population dynamics, estimates of “normal” stocks and maximum sustainable yield are uncertain. Consequently, target stocks are vulnerable to political pressure from fishers, who often argue that current stocks are close to normal, so catch should not be limited. More important, people, including scientists, typically credit their own experience more than other information, while environmental changes are often slow relative to our lifespan. Fishery biologist Daniel Pauly (1995) describes the resulting “shifting baseline syndrome” in which “each generation of fisheries scientists accepts as a baseline the stock size and species composition that occurred at the beginning of their careers, and uses this to evaluate changes. When the next generation starts its career, the stocks have further declined, but it is the stocks at that time that serve as a new baseline. The result obviously is a gradual shift of the baseline, a gradual accommodation of the creeping disappearance of resource species, and inappropriate reference points for evaluating economic losses resulting from overfishing, or for identifying targets for rehabilitation measures” (Pauly 1995; see also http://www.shiftingbaselines.org). Fig. 7 shows the feedback structure and behavior of the shifting baseline syndrome. Now, as fish stocks fall, the beliefs of fishers and scientists about normal stock levels gradually drop. Pressure to limit the catch is reduced. Stocks fall further, and beliefs about the normal stock level fall still more in a vicious cycle—the Shifting Baseline feedback (R2). The simulation shows the result when the target stock adjusts to the actual stock over an average of 20 years. Goal erosion undermines the effectiveness of community efforts to limit the catch to a sustainable rate. The fishery still collapses.
Sustaining Sustainability: Creating a Systems Science in a Fragmented Academy…
37
+ Catch per Boat Fleet Size B2 Fishing Effectivneess
+
+
Catch
+ Recruitment
-
+
R1
Fish Stock
Population Growth
Catch Limits
B3
+
Catch Limits
- Stock Relative B1
Limits to Growth Fish Density Maximum Fish Stock
-
to Target
DELAY
+ +
Perceived Normal Stock
+
R2
Shifting Baselines
+
Target Stock
Fig. 7 Eroding goals: allowing target stocks to adjust to actual levels with a time constant of 20 years leads to collapse of the fishery through the reinforcing Shifting Baselines loop R2. All other conditions identical to Fig. 6
Eroding goals and shifting baselines are not limited to fisheries, but occur for a wide range of environmental issues, particularly those in which the dynamics are slow relative to human lifespan and in which the signal-to-noise ratio is low, for example, in climate change, where daily and seasonal fluctuations in local weather dominate our experience, while the slow rise in global average temperatures, loss of snow cover, changes in the behavior and range of species, and other impacts are hard to discern.
Time Delays Time delays in complex systems are common and particularly troublesome. For example (Table 3), more than 6 decades have passed from the first undeniable evidence that air pollution from combustion of fossil fuels causes significant health problems, including death, yet the US EPA reports 145 million Americans live in so-called nonattainment areas—regions where air quality does not meet the standards of the Clean Air Act.
38
J.D. Sterman
Table 3 Delays in societal response to air pollution in the USA 1800s: widespread use of coal leads to growing air pollution in Europe and the USA 1948: Smog in Donora, Pennsylvania, kills 20 people and sickens 6,000. Soon after, coal fumes kill nearly 800 in London 1955: First US Federal Air Pollution Control Act laid primary responsibility for limiting air pollution upon states and cities, though it allocated $5 million for research 1963: Federal Clean Air Act recognizes air pollution does not respect state boundaries; sets up regulations for interstate abatement; provides more assistance to state and local governments 1970: Clean Air Act strengthened by defining “safe” standards for sulfur dioxide (SO2), carbon monoxide (CO), particulates, volatile organic compounds (VOCs), nitrous oxides (NOx), ozone (O3), and lead (Pb). States are required to submit plans to meet standards by 1975 1977: deadline postponed until 1982 as 78 cities were in violation of ozone standards 1988: ninety urban areas with 150 million inhabitants exceed ozone standard; 40 violate CO standard 1990: Amendments to Clean Air Act require all cities to meet ozone standard by 2007 (except Los Angeles, which had until 2010). Stricter regulations for auto emissions, gasoline, SO2, and newly regulated pollutants 1990s: medical evidence shows health problems and deaths from air pollution are caused by lower concentrations of key pollutants than previously thought 1997: reflecting new science, and over strong opposition by industry, the National Ambient Air Quality Standards under the Clean Air Act tightened for six “criteria” air pollutants (O3, CO, SO2, NOx, Pb, and PM10 and PM2.5—particulates smaller than 10 and 2.5 mm). Industry groups immediately challenge the new regulations in court 2001: US Supreme Court, in Whitman v. American Trucking Associations, Inc., unanimously upholds the bulk of the new regulations 2010: 145 million Americans live in “nonattainment” areas in violation of EPA standards for the six criteria pollutants. The National Research Council estimates that the pollutants released by use of fossil fuels, primarily O3, NOx, SO2, and particulates, cause economic damage of at least $120 billion per year, including the cost of 20,000 premature deaths per year Time from first clear signal of problem to initial Clean Air Act: 15 years Total delay from first clear signal to full compliance with law: 62 years and counting Source: paraphrased and condensed with permission from D. Meadows and A. AtKisson, The Balaton Bulletin, 1997; updated by J. Sterman from EPA Green Book (http://www.epa.gov/oar/ oaqps/greenbk). Nonattainment population in 2010 given by the maximum population living in each nonattainment area across each criterion pollutant per EPA Green Book data as of December 17, 2010, http://www.epa.gov/oar/oaqps/greenbk/ancl3.html
The National Research Council (2010) estimated that the pollutants released by use of fossil fuels cost the US economy at least $120 billion per year, including the cost of 20,000 premature deaths per year. These estimates exclude the harms these pollutants cause to ecosystems and national security, the damage caused by other pollutants such as mercury, and the costs of climate change arising from anthropogenic GHGs. Research shows people routinely ignore or underestimate time delays (Sterman 1989; Sterman 2000; Buehler et al. 2002; Faro et al. 2010). Underestimating time delays leads people to believe, wrongly, that it is prudent to “wait and see” whether
Sustaining Sustainability: Creating a Systems Science in a Fragmented Academy…
39
a potential environmental risk will actually begin to cause harm, or until scientific research resolves uncertainty about whether something is harmful, then address it if it does. Consider climate change. Many people, including many who believe climate change is real and poses serious risks, nevertheless advocate a wait-and-see approach, reasoning that uncertainty about the causes and consequences of climate change means potentially costly actions to address the risks should be deferred. If climate change turns out to be more harmful than expected, policies to mitigate it can then be implemented, they argue. Wait-and-see policies often work well in simple systems, specifically those with short lags between detection of a problem and the implementation and impact of corrective actions. In boiling water for tea, one can wait until the kettle boils before taking action because there is essentially no delay between the boiling of the water and the whistle of the kettle, nor between hearing the whistle and removing the kettle from the flame. Few complex public policy challenges can be addressed so quickly. To be a prudent response to the risks of climate change, wait-and-see policies require short delays in all the links in a long causal chain, stretching from the detection of adverse climate impacts to the decision to implement mitigation policies to emissions reductions to changes in atmospheric GHG concentrations to radiative forcing to surface warming and finally to climate impacts, including changes in ice cover, sea level, weather patterns, agricultural productivity, habitat loss and species distribution, extinction rates, and the incidence of diseases, among others. Contrary to the logic of “wait and see” there are long delays in every link of the chain (Fiddaman 2002; O’Neill and Oppenheimer 2002; Stachowicz et al. 2002; Alley et al. 2003; Thomas et al. 2004; Meehl et al. 2005; Wigley 2005; Solomon et al. 2009; Pereira et al. 2010). Similar delays exist for many environmental problems. More problematic, the short- and long-run impacts of our policies often differ. Such “better-before-worse” behavior is common across many spatial and temporal scales. Credit card debt boosts your material standard of living today but forces a drop in consumption when the bills and interest must be paid. Smoking brings immediate pleasure but disease and death later. Forest fire suppression works in the short run, until the resulting fuel accumulation leads to more, hotter and more damaging fires decades later. DDT was a boon to agriculture and human health in the short run, while pest resistance and the harmful effects of chlorinated hydrocarbons on ecosystems and humans emerged only later. Similarly, what’s best for the long term often imposes short-run costs, a “worse-before-better” pattern. Saving for retirement requires we sacrifice consumption in the short run. Restoring the cod fishery requires cutting the catch today. Because the long-term benefits and harms of current actions are uncertain, delayed, and diffuse, we are often biased toward actions that improve welfare in the short run at the expense of the future (betterbefore-worse). And the worse-before-better impact of policies required to improve long-run performance often causes them to fail (Repenning and Sterman 2001). The trade-off between the short- and long-term responses to policies is particularly problematic in the domain of sustainability because of the long time delays in ecological and economic processes.
40
J.D. Sterman
Stocks and Flows Stocks and the flows that alter them are fundamental in disciplines from accounting to zoology: Debt is increased by borrowing and reduced by repayment or default; the burden of mercury in a child’s body is increased by ingestion and decreased by excretion; a population is increased by births and decreased by mortality. In physical and biological systems stocks are often tangible: the stock of fresh water in the Ogallala aquifer, the number of gasoline-powered vehicles, the amount of CO2 in the atmosphere. The dynamics of our economic and social systems, however, are also determined by intangible resources such as technical knowledge, behavioral norms around littering and recycling, trust among extractors of common pool resources, and other forms of human, social, and political capital. We should have good intuitive understanding of accumulation because stocks and the flows that alter them are pervasive in everyday experience: Our bathtubs accumulate the inflow of water through the faucet less the outflow through the drain, our bank accounts accumulate deposits less withdrawals, and we all struggle to control our weight by managing inflows and outflows of calories through diet and exercise. Yet research shows that people’s intuitive understanding of stocks and flows is poor in two ways that perpetuate low leverage approaches to sustainability. First, despite their ubiquity, people have difficulty relating the flows into and out of a stock to the level of the stock, even in simple, familiar contexts such as bank accounts and bathtubs. Second, narrow mental model boundaries mean people are often unaware of the networks of stocks and flows that supply resources and absorb wastes. Although the relationship between stocks and flows is a fundamental concept of calculus, knowledge of calculus is not necessary to understand their behavior. Any stock can be thought of as the amount of water in a tub. The water level accumulates the flow of water into the tub (the inflow) less the flow exiting through the drain (the outflow). The rate of change in the water level is the net flow, given by the difference between the inflow and outflow.4 As everyone knows, the water level in the tub rises only when the inflow exceeds the outflow, falls only when the outflow exceeds the inflow, and remains the same only when the inflow equals the outflow. Yet even highly educated adults with strong background in STEM (Science, Technology, Engineering, and Mathematics) often do not understand these basic principles. Booth Sweeney and Sterman (2000) presented graduate students at MIT
4 Consider any stock, S, with inflow I and outflow O. The stock at time T, ST , is the integral of its net inflow from the initial time, t0 , plus the initial stock, St . Equivalently, the rate of change of the 0 stock is the net inflow, I–O: T
T
ST = ò Net Inflow dt + St0 = ò (I - O )dt + St0 ; t0
t0
dS = Net Inflow = I - O dt
Note the units of measure: stocks are measured in units, e.g., liters of water in a tub or tons of CO2 in the atmosphere, while flows are measured in units/time period, e.g., liters/second or tons of CO2 /year.
Sustaining Sustainability: Creating a Systems Science in a Fragmented Academy…
41
with a picture of a bathtub and graphs showing the inflow and outflow of water and then asked them to sketch the trajectory of the stock of water in the tub. Although the patterns were simple, fewer than half responded correctly. The majority in these and subsequent experiments fail to apply the basic principles of accumulation. Rather, people often use the intuitively appealing “correlation heuristic” (Cronin et al. 2009), assuming that the output of a system should “look like”—be positively correlated with—its inputs. Although sometimes useful, correlational reasoning fails in systems with important accumulations. The US federal deficit and national debt have both risen dramatically since 1950. Correlational reasoning predicts that cutting the deficit would also cut the debt. However, because the national debt is a stock that accumulates the deficit, it keeps rising even if the deficit falls. The debt falls only if the government runs a surplus. Poor understanding of accumulation leads to serious errors in reasoning about sustainability. Herman Daly (1991) articulated three fundamental, necessary conditions for sustainability in any finite environment, shown in Fig. 8 using standard stock and
Fig. 8 Three necessary conditions for sustainability (Daly 1991) shown in stock and flow notation. Rectangles denote stocks; pipes and valves denote the flows. Here, the stock of renewable resources is depleted by harvest (e.g., logging) and filled by regeneration (e.g., forest regrowth). The harvest of renewables, generation of wastes, and extraction of nonrenewables are driven by human activity (the population and economy). Renewable resource regeneration and the processes that render wastes harmless (e.g., breakdown of sewage, removal of CO2 from the atmosphere) are provided by ecosystem services. For simplicity the stocks that support activities are not shown but are themselves finite: there are no limitless sources and sinks on a finite planet
flow notation. In a sustainable society, (1) renewable resources cannot be used faster than they regenerate, (2) pollution and wastes cannot be generated faster than they decay and are rendered harmless; and (3), in the long run, nonrenewable resources cannot be used at all. These principles follow directly from the fundamental laws of accumulation: If a bathtub is drained at a higher rate than it fills, the level of water will fall; in exactly the same way, a sustainable society cannot harvest cod faster than they reproduce. Filling a tub faster than it drains raises the level of water, so a sustainable society cannot produce GHGs faster than they are removed from the atmosphere. And the level of water in a tub with an open drain but no inflow will fall until the tub is empty, so a sustainable society cannot rely on nonrenewables such as fossil fuels.
42
J.D. Sterman
Our society is far from meeting any of these three fundamental requirements for sustainability (Wackernagel et al. 2002; Rockström et al. 2009). Any policy or program that purports to promote sustainability should be judged by whether it moves us closer to stabilizing stocks of resources and wastes. If it does not, then it does not advance the cause of sustainability. Experimental studies show that people do not understand these concepts. Sterman and Booth Sweeney (2007) gave 212 graduate students at MIT a description of the relationships among GHG emissions, atmospheric concentrations, and global mean temperature. The description, excerpted from the IPCC’s “Summary for Policymakers,” a document intended for nonspecialists, described the flows into and out of the stock of CO2 in the atmosphere. Participants were then asked to sketch the emissions trajectory required to stabilize atmospheric CO2. To highlight the stock–flow structure, participants were first directed to estimate future net removal of CO2 from the atmosphere (net CO2 taken up by the oceans and biomass), then draw the emissions path needed to stabilize atmospheric CO2. Knowledge of climatology or calculus is not needed to respond correctly. The dynamics are easily understood using the bathtub analogy. Like any stock, atmospheric CO2 rises when the inflow to the tub (emissions) exceeds the outflow (net removal), is unchanging when inflow equals outflow, and falls when outflow exceeds inflow. Participants were informed that anthropogenic CO2 emissions are now roughly double net removal, so the tub is filling. Yet, 84% drew patterns that violated the principles of accumulation. Nearly two-thirds asserted that atmospheric GHGs can stabilize even while emissions continuously exceed removal—analogous to arguing a bathtub continuously filled faster than it drains will never overflow. The false belief that stabilizing emissions would quickly stabilize the climate not only violates mass balance, one of the most basic laws of physics, but leads to complacency about the magnitude and urgency of the emissions reductions required to mitigate climate change risk (Sterman 2008). Training in science does not prevent these errors. Three-fifths of the participants had degrees in science, technology, engineering, or mathematics (STEM); most others were trained in economics. Over 30% hold a prior graduate degree, 70% of these in STEM. These individuals are demographically similar to influential leaders in business, government, and the media, though with more STEM training than most. On a more hopeful note, it is possible for people to learn these principles: Sterman (2010) shows that a half-semester course on system dynamics modeling significantly improves people’s ability to relate stocks and flows and reduces the prevalence of the correlation heuristic. Understanding the principles of accumulation, while necessary, is not sufficient. People must also be able to identify the networks of stocks and flows through which resources and wastes move through the economy and ecosystem. The inability to recognize and map the network of stocks and flows in a system contributes to policy resistance and unsustainability by focusing people’s attention on local conditions at the expense of the distal and delayed consequences of their actions. It allows us to externalize the environmental consequences of our actions by promoting the illusion that there are unlimited supplies of natural resources and limitless sinks into which wastes can be dumped. California’s Air Resources Board promotes so-called
Sustaining Sustainability: Creating a Systems Science in a Fragmented Academy…
43
zero emission vehicles (ZEVs; see http://www.arb.ca.gov/msprog/zevprog/zevprog. htm). True, ZEVs—likely to be electric vehicles—need no tailpipe. But the plants required to make the electricity to power them do generate pollution. California is actually promoting DEVs—displaced emission vehicles—whose wastes would blow downwind to other states or accumulate in nuclear waste dumps. Air pollution causes substantial harm, electric vehicles may prove to be an environmental boon compared to internal combustion, and eventually electricity must be produced from renewable sources such as wind and solar. But no technology is free of environmental impact, and no government can repeal the second law of thermodynamics. Fig. 9 shows the stock and flow network mapping the movement of carbon from fossil fuels, through combustion, into the atmosphere, and from the atmosphere C Sequestered from Active Carbon Cycle
C Circulating in Active Carbon Cycle C in Soils Formation of Fossil Fuels from C in Soils
C in Fossil Fuels
C Flux Soils to Atm
C Emissions from Fossil Fuel Combustion
C Flux Biomass to Soils C in Biomass C Flux Biomass to Atm
C in Atmosphere C Flux Atm to Ocean
C Flux Atm to Biomass C Flux Ocean toAtm
C in Mixed Layer of Ocean
C Flux Deep Ocean to Mixed Layer
C Flux Mixed Layer to Deep Ocean C in Deep Ocean
Formation of Fossil Fuels from Abyssal Sediment
C Flux Deep Ocean to Abyssal Sediment
C Flux Abyssal Sediment to Deep Ocean C in Abyssal Sediment
Fig. 9 Stock and flow structure of the carbon cycle. Combustion of fossil fuels injects carbon that has been sequestered for millions of years into the atmosphere, where it is taken up by biomass or dissolves in the ocean, but eventually cycles from these stocks back into the atmosphere. Flows showing the formation of fossil fuels from carbon in terrestrial soils and ocean sediments are shown in gray because these flows are, relative to human time scales, essentially zero. The diagram does not show flows of C associated with the formation and weathering of limestone and other rocks as these flows are unchanging over human time scales
44
J.D. Sterman
into various stocks including carbon in biomass, soils, and the ocean. The fluxes of carbon among these reservoirs determine the concentration of CO2 in the atmosphere, and thus anthropogenic global warming. Many argue that we can limit climate change by Reducing Emissions from Deforestation and land Degradation (REDD) (see e.g., http://www.un-redd.org). REDD policies often focus on carbon credits and offsets, through which polluters “offset” the CO2 generated by the fossil fuels they burn by paying developing nations to preserve their forests or plant trees. It’s true that a growing forest removes carbon from the atmosphere. But what happens to that carbon? Within a few decades it returns to the atmosphere through several routes: First, as the forest grows, more and more leaves, pine needles, branches, and trees die and fall to the forest floor, where bacteria and fungi consume them, releasing CO2 and methane back into the atmosphere. Second, if humans harvest the wood for fuel or clear that land for crops, the carbon stored in the trees returns to the atmosphere via fire or decay. Even if the forest is protected from legal and illegal logging, the larger the stock of carbon in the forest, the greater the chance of wildfire. Halting deforestation is essential in building a more sustainable world: it accounts for roughly 20% of total world carbon emissions and causes a multitude of other harms including erosion and mudslides; changes in regional albedo, cloud formation, and rainfall; and habitat loss that displaces indigenous peoples and accelerates species extinction. But allowing nations, firms, and individuals to “offset” their fossil fuel use by buying carbon credits to reduce deforestation is a fool’s bargain. Burning fossil fuels injects carbon that has been sequestered for millions of years into the atmosphere. Such carbon remains in the active carbon cycle for eons, while afforestation removes carbon from the atmosphere only temporarily and does nothing to reduce the stock of carbon in the active carbon cycle. Poor understanding of stock and flow networks is not limited to the public and policymakers but is all too common in academic research. In the early 1990s, William Nordhaus developed the DICE (Dynamic Integrated Climate Economy) model. DICE closes an important feedback: the economy generates GHGs, which alter the climate, which feeds back to reduce economic growth and emissions. But the DICE are loaded. The carbon cycle in the model represents only a single stock: carbon in the atmosphere (eq. 8 in Nordhaus 1992),
M (t ) = bE (t ) + (1 - d M ) M (t - 1) “where M(t) is CO2 concentrations relative to preindustrial times, b is the marginal atmospheric retention ratio, and dM is the rate of transfer from the rapidly mixing reservoirs to the deep ocean” (p. 1316). The transfer rate dM is constant, implying that the carbon sinks that accumulate the CO2 removed from the atmosphere have infinite absorption capacity. As seen in Fig. 9, these sinks are finite; the carbon taken up by the land and oceans eventually makes its way back into the atmosphere. By omitting these stocks DICE ignores important nonlinear constraints on carbon uptake by biomass as primary production is constrained by other nutrients and as the partial pressure of CO2 in the ocean rises. These feedbacks cause the fractional removal rate to fall as atmospheric CO2 rises, as terrestrial and oceanic
Sustaining Sustainability: Creating a Systems Science in a Fragmented Academy…
45
carbon sinks saturate, and as global mean temperature increases (e.g., IPCC 2007). Worse, the so-called marginal atmospheric retention ratio b is set to 0.64. A charitable interpretation is that 36% of total emissions is quickly absorbed out of the atmosphere (within a year), with the rest removed slowly, at the rate dM. However, the emissions that leave the atmosphere quickly are absorbed by biomass or by the ocean. As these stocks fill, additional removal from the atmosphere is constrained. Since none of these carbon reservoirs are represented, however, Nordhaus has in fact assumed that 36% of total emissions disappear forever, without a trace. Expanding the model boundary to account for sink capacities and conserve carbon increases the warming generated by a given rate of CO2 emissions, working against Nordhaus’ conclusion that optimal carbon taxes are low (Fiddaman 2002; Solomon et al. 2009). Indeed, Solomon et al. (2009) show that even if GHG emissions fell to zero today, the carbon and heat already absorbed by the oceans would cause global mean surface temperature to remain roughly constant for at least 1,000 years: the impact of current GHG emissions on the climate are essentially irreversible. Yet the narrow boundaries in resource models persist. For example, addressing the debate over future supply of minerals and energy, energy economist Morris Adelman (1993) declared: “Minerals are inexhaustible and will never be depleted. A stream of investment creates additions to proved reserves, a very large in-ground inventory, constantly renewed as it is extracted….How much was in the ground at the start and how much will be left at the end are unknown and irrelevant” (p. xi). “The fixed stock does not exist” (p. xiii) “What exists, and can be observed and measured, is not a stock but a flow” (p. xiv). Adelman’s statements violate conservation of matter. Every ton of titanium and every barrel of oil added to the stock of proven reserves reduces the stock of titanium and oil remaining to be found in the future. Every ton and barrel extracted reduces the quantity remaining in the ground. Ceteris paribus, the smaller the stock of resources remaining to be discovered, the lower the productivity of exploration activity must be (on average), and the smaller the rate of addition to proven reserves will be for any investment rate. In the limit, if the stock of undiscovered resource fell to zero, the rate of additions to proven reserves would necessarily fall to zero. Economists argue that a drop in proven reserves will raise prices, leading to substitution of other resources and inducing additional exploration activity and improvements in technology that increase exploration and recovery. But even if markets function well, additional exploration only drains the stock of undiscovered resource faster. Depletion must continue—the stock of resources in the ground must fall—as long as there is any extraction. Only if there is a so-called backstop technology that can fully substitute for all uses of the nonrenewable resource at a finite price, in finite time, will extraction fall to zero and halt depletion. The size of the resource base, the costs of substitutes, and whether new technologies can be developed before depletion reduces extraction and harms economic welfare are empirical questions, not matters of faith. The very possibility that depletion might matter cannot be
46
J.D. Sterman
assumed away, to be made untestable with models in which resources are infinite, the price system always functions perfectly, delays are short, and technology provides backstops at low cost.
Where Is the Leverage? Integrating feedback, time delays, and stock–flow structures yields a simple conceptual framework to identify the key leverage points for the creation of a sustainable world. As shown earlier, the sustainability challenge arises from the collision of population and economic growth with the limits of our finite world. Fig. 10 shows
Human Activity B2 Population Net Increase in Human Activity
+
+
Net Births Net Investment
+
DELAY Productive Capacity
+
Resource Prices, Social Concern, Gov't Policy
R3 Technological Nightmare
B1
DELAY
+
Voluntary Limits B5 to Growth
-
+
Global Carrying Capacity
Adequacy of Resources
Involuntary Limits to Growth
+
Consumption and Degradation
-
-
+
B4 Technological Solution DELAY + Technological "Side Effects"
DELAY
DELAY
R1
-
Technology
Innovation
Population and Economic Growth
Net Fractional Growth Rate
Resource Consumption
DELAY
-
VoluntaryLimits
Regeneration and Restoration B3 + Regeneration DELAY R2 Environmental Tipping Points
Regeneration Capacity
+
Fig. 10 Interactions of growth, carrying capacity, and technology
a simplified model integrating growth of human activity with the carrying capacity of the planet (see Meadows et al. 2004 for a more detailed model). On the left, human activity grows through the reinforcing feedbacks of population and economic growth described earlier (aggregated into reinforcing loop R1). If the environment were unlimited, growth could continue indefinitely. However, growth in human activity is constrained by the adequacy of resources (the ensemble of nonrenewable resources, renewable resources, and a healthy, clean environment shown in Fig. 8). As populations and economic activity grow relative to carrying capacity, the adequacy of those resources decline. Sufficient decline in resource adequacy lowers the net fractional growth rate in human activity, eventually causing growth to stop via “Involuntary Limits to Growth” (loop B1).
Sustaining Sustainability: Creating a Systems Science in a Fragmented Academy…
47
If the carrying capacity were constant growth would follow an S-shaped pattern (as in Fig. 4) in which resources per capita fall until they are just scarce enough to balance births with deaths: a subsistence equilibrium in which life would be nasty, brutish, and short. That naïve Malthusian model is simplistic because the carrying capacity of the earth is dynamic. On the one hand, the larger the population and the greater the economic impact of each person, the greater the consumption and degradation of the carrying capacity: a larger, richer population consumes more resources, generates more waste, uses more fossil fuels, emits more greenhouse gases, etc. On the other, the carrying capacity can regenerate: logging provides more light and nutrients for seeds and saplings; plants fix nitrogen and other nutrients in soils; chlorinated hydrocarbons such as DDT and dioxin eventually break down into harmless compounds. These processes are captured by the balancing Regeneration loop B3. Of course, there are delays in the regeneration process: acorns require decades to become mighty oaks; soils form at rates of a few millimeters per year; DDT degrades over decades. And some elements of the carrying capacity cannot be regenerated: fossil fuels and high-grade copper ores are nonrenewable; extinction is irreversible; stocks of plutonium and other nuclear wastes will remain with us far longer than any civilization on earth has yet endured. Even for the renewable elements of the carrying capacity there are limits to regeneration and restoration, as illustrated by the fishery model earlier. Harvest a few cod and the population recovers, but take too many and the population collapses; take a few trees and the forest regenerates, but clear cutting can alter rainfall and surface albedo so that the land becomes savannah or desert. These processes are captured by the reinforcing Environmental Tipping Point feedback R2: degrade the earth’s carrying capacity too much and its ability to regenerate withers, accelerating the collapse in a vicious cycle. Where these tipping points lie is usually uncertain— until they have been crossed, by which time it is too late. Expanding the naïve Malthusian model, with its constant carrying capacity, to include the dynamics of the earth’s resources and ecosystems changes the dynamics of the system. Now, as the population and economy grow, resources per capita fall in two ways: first, as before, there are more people relative to the resources of the earth. Second, the carrying capacity itself begins to fall as resource consumption and degradation exceed regeneration and restoration. If regeneration is rapid and regeneration capacity robust (loop B3 is strong and swift and the tipping point loop R2 is weak), then regeneration quickly rises to offset resource consumption and waste production and the decline in the carrying capacity is slight. Human population and activity still follow an s-shaped path, growing until resources are scarce enough to halt further increase. However, if regeneration is weak and slow, or the tipping points strong and close, then carrying capacity will fall. Unlike the prior case, the system does not reach equilibrium when the carrying capacity and human activity meet. Instead, the high level of human activity means consumption and degradation of the carrying capacity exceed regeneration, so the carrying capacity of the earth continues to fall. As it does, economic output and/or human population must fall. In the extreme, if the population remains dependent on nonrenewable resources or generates wastes that cannot be dissipated, the carrying capacity must
48
J.D. Sterman
continue to fall as long as there is any remaining activity, and the only equilibrium is zero population—extinction. Incorporating the dynamics of the carrying capacity changes the system dynamics from S-shaped growth to overshoot and collapse (Forrester 1971b; Meadows et al. 2004). Many societies have degraded their carrying capacities and collapsed, for example, on Rapa Nui (Easter Island). Carbon dating puts the arrival of the first humans, intrepid Polynesian sailors, around the year 1200 (Wilmshurst et al. 2011). Pollen counts from soil cores and other records show that they found a lushly forested island with diverse fauna, particularly birds (Bahn and Flenley 1992; Steadman 1995). Population increased exponentially, and as it did, the islanders harvested trees to provide wood and fiber for fuel, boats, structures, ropes, and tools. The Polynesian rat, which arrived with the settlers, hastened the decline by killing birds and eating the seeds and nuts of the native palm. Deforestation was nearly complete by the year 1400, dramatically reducing the island’s carrying capacity. The rain now washed the unprotected soil away. Wind speeds at ground level increased, carrying still more valuable soil into the sea. Erosion was so severe that sediment washed from higher elevations eventually covered many of the moai, so that European visitors thought these giant statues were just heads, when in fact they were complete torsos averaging 20 ft in height. Deforestation also increased evaporation from the soil and may have reduced rainfall, further reducing food production and fresh water supplies. Most of the bird species living on Easter Island became at least locally extinct. Only 1 of about 25 indigenous species still nests on the island today (Steadman 1995). Eventually, fishing, the other main source of food, fell as boats, lines, and hooks, all made from wood, could no longer be replaced. When the first Europeans arrived the islanders prized wood above all other items offered in trade. As the carrying capacity declined, hardship slowed population growth. Population peaked between six and ten thousand around the year 1600. A precipitous decline set in by about 1680. Spear points and tools of war appeared for the first time and there is evidence of large battles. Some scholars believe there is evidence of cannibalism during this period. The first Europeans known to visit Easter Island arrived in 1722 and found a small, impoverished population. Similar overshoot and collapse dynamics befell other island societies (Kirch 1997) and much larger civilizations, such the Classic Maya (Webster 2002). Technological optimists and many economists object that the model so far (loops R1, B1, B2, B3, and R2 only) ignores human ingenuity and the power of markets. The primitive people of Easter Island might have experienced overshoot and collapse because they lacked modern technology and could not leave the island, but, it is argued, today we have superior innovative powers and markets that can compensate for any resource shortages and environmental problems growth may create. Thus Julian Simon (1996) argued that Greater consumption due to increase in population and growth of income heightens scarcity and induces price run-ups. A higher price represents an opportunity that leads inventors and businesspeople to seek new ways to satisfy the shortages. Some fail, at cost to themselves. A few succeed, and the final result is that we end up better off than if the original shortage problems had never arisen.
Sustaining Sustainability: Creating a Systems Science in a Fragmented Academy…
49
Expanding the boundary of the model to capture prices and innovation creates a new balancing feedback, the Technological Solution loop B4. As a resource becomes scarce, its price rises, stimulating technical innovation that cuts demand and substituting more abundant resources for those that are scarce (e.g., drilling deep offshore oil wells in the Gulf of Mexico as shallower deposits on land are depleted; boosting the gas mileage of autos). Going further than free market advocates such as Simon, the technological solution feedback B4 also includes the possibility that scarcity may induce governments to increase research and development (e.g., R&D on alternative energy sponsored by the US Department of Energy), and correct market failures through regulation, stimulating innovation (e.g., CAFE standards and the cap and trade market in SO2). Further, social norms may change in response to scarcity (e.g., recycling). There are, however, important lags in these technological solution feedbacks, including delays in the detection of environmental problems, in recognizing the opportunity for profit when prices rise, and in the reallocation of capital and R&D resources. There are long delays before R&D yields new technologies and between laboratory demonstrations and commercialization. Once new technologies reach the market, there are even longer delays in adoption and the replacement of old infrastructure, and further delays before the carrying capacity responds. In the technological optimist’s model, innovation and technology are beneficial. But many technologies create unintended effects that intensify scarcity or environmental problems elsewhere. Taller smokestacks on Midwestern power plants reduced smog in Ohio and Pennsylvania, but caused acid rain in New York and New England; the Haber–Bosch process to fix nitrogen led to synthetic fertilizer, dramatically boosting crop yields (where farmers could afford it), but consumes huge amounts of fossil fuels while fertilizer runoff eutrophies rivers and lakes and creates dead zones in offshore waters. Dams generate electric power and reduce flooding, but the World Commission on Dams (2000) found that on balance, the impacts of large dams “are more negative than positive and, in many cases, have led to irreversible loss of species and ecosystems” because they halt the accumulation of fertile silt on downstream floodplains, cause deltas such as those of the Nile and Mississippi to subside, disrupt the lifecycle of riverine species such as salmon, and may contribute more to GHG emissions from the decay of inundated vegetation than they save through the generation of hydropower. Expanding the boundary of the model to include the possibility of unintended harm from technological innovation creates the reinforcing “Technological Nightmare” feedback R3: as before, scarcity and environmental degradation caused by growth in human activity lead to higher prices for the affected resources, along with government and social responses. The resulting technological solutions have some benefits, but also lead, usually after delays, to harms that accelerate the erosion of the carrying capacity, leading to greater scarcity and new environmental problems, triggering still higher prices and still greater attempts to find a technological solution, in a vicious cycle. How does the inclusion of the price system and technological innovation alter the dynamics of the system? Clearly, if markets are imperfect, if the delays in the social,
50
J.D. Sterman
economic, and technical response to scarcity and environmental degradation are long, or if the harmful “side effects” of technology dominate the benefits, then the result will still be overshoot and collapse: technological solutions will be “too little, too late” or will actually worsen the problem. More interesting, what happens if markets work well, the delays in innovation are short and unintended harms absent? Will the result be, as Simon (1996) suggests, “that we end up better off than if the original shortage problems had never arisen?” No. Simon’s conclusion would hold if the level of human activity that created the shortage were exogenous, unaffected by the availability of resources. But there is feedback: technological solutions increase the adequacy of resources and lower prices, enabling growth to proceed at a higher rate. The population and economy grow still further, reducing the adequacy of resources directly (loop B1) and indirectly, by increasing the rate of consumption and degradation of the carrying capacity (loop B2). The result: society is once again pushed up against one environmental limit or another. If markets and technology once again succeed in addressing those new limits, then human activity grows still further. To avoid involuntary limits to growth through technology, one must assume that technological solutions to all resource and environmental problems can be found, that the costs of these solutions are so low that they do not constrain economic growth; that the delays in the recognition of problems, in the innovation process, in adoption and diffusion of new technologies, and in the response of the carrying capacity are always short; that these solutions never generate significant unintended harms; and that technological solutions keep the carrying capacity from crossing important environmental tipping points. Most important, one must believe that, eventually, both population growth and people’s desire for more income and wealth will end. If any of these conditions fail, then the carrying capacity will eventually drop, leading to overshoot and decline. As is typical in complex systems, much of the debate between environmentalists and technological optimists focuses on the symptoms of the problem: resources and the resiliency of the environment. How much oil is there? How much nuclear and solar power can be produced? How much copper can be mined, and at what costs? And so on. That debate misses the point. It makes no difference how large the resource base is: to the extent technology and markets alleviate scarcity today, the result is more growth tomorrow, until the resource is again insufficient, some other resource becomes scarce, or some other environmental problem arises. Solve these, and growth continues until some other part of the carrying capacity is lost, some other limit reached. As long as growth is the driving force there can be no purely technological solution to the problem of scarcity. The high leverage points lie elsewhere, in the forces that cause population and economic growth. Even with significant potential for new technical solutions, a prosperous and sustainable future can only be built if growth of both population and material throughput cease voluntarily, before growth is stopped involuntarily by scarcity or environmental degradation (the balancing “Voluntary Limits” loop B5 in Fig. 10). Fortunately, population growth may stabilize “voluntarily.” Contrary to, or perhaps in response to, fears of a population explosion (as with China’s one child policy), fertility and population growth have fallen in recent decades, a process
Sustaining Sustainability: Creating a Systems Science in a Fragmented Academy…
51
known as the demographic transition. Prior to industrialization and economic development, both crude birth and death rates were high and variable. Infant mortality was high and life expectancy low, so women began to bear children early and bore many to ensure that a few would survive. Population growth was slow. The introduction of modern sanitation, public health systems, transportation, and medical care raised life expectancy. Death rates fell. Population growth accelerated dramatically. Eventually, however, birth rates also fell: more children survived to adulthood, so women did not need to bear as many to achieve their desired family size. Further, the economic benefits of children fall with industrialization because they enter the labor force later than in traditional agricultural societies and must be supported by their parents longer. Desired family size drops. Birth rates fall only slowly, however: family size, marriage age, and other determinants of fertility are strongly embedded in traditional culture, religious norms, and other social structures. Today, fertility and mortality are in rough balance in a number of developed economies. In still-developing nations, death rates have fallen, but birth rates continue to lag behind, so population growth remains high. The UN’s 2010 projections assume that the demographic transition will continue throughout the world, including the least developed nations, nearly stabilizing population by 2100 at more than ten billion. But even if population growth eventually stops, human impact on the environment will not: economic growth is projected to continue, and as the production of goods and services per capita rises, so too will the impact of each person. Endless economic growth is envisioned, indeed desired, by many technological optimists, for example, “The standard of living has risen along with the size of the world’s population since the beginning of recorded time. There is no convincing economic reason why these trends toward a better life should not continue indefinitely” (Simon 1996). Endless economic growth is impossible, however. Resource use and environmental impact per person cannot fall to zero—people need a minimum amount of food, living space, energy, and waste disposal capacity, among other resources. The only way total impact can stabilize is for both population and economic output per person to stabilize. Yet no nation on earth seeks to end the growth of its economy. These limits are not theoretical and distant. The best available science shows that humanity has already overshot the carrying capacity of the earth. The human family is projected to grow by more than two billion in less than 40 years, and most of these people will be born in the poor nations of the world. All of them, and the billions who today live in poverty, legitimately aspire to live the way those in developed nations do today, dramatically increasing the demand for resources and production of wastes. To take but one example, if the projected world population of 9.3 billion in 2050 lived like Americans did in 2008, there would be 7.8 billion vehicles on the world’s roads, consuming 382 million barrels of oil per day, more than five times total world oil production in 2008, and spewing 60 billion tons of CO2 per year into the atmosphere, nearly double total world CO2 emissions from fossil fuels in that year. Avoiding a decline in population or economic output will require all the technical and social innovation we can muster. We urgently require technologies to replace fossil fuels, cut GHG emissions, boost food production without use of toxic pesticides, create new antibiotics as pathogens evolve resistance, end deforestation, and
52
J.D. Sterman
protect biodiversity. We urgently need to create more effective markets to capture environmental and social externalities, providing businesses and consumers with the price signals that will drive innovation and stimulate efficient use of resources. We urgently require better science, environmental monitoring, and product testing so that the new technologies we develop and deploy do not create unintended consequences that worsen the very problems we seek to solve. But while necessary, technological innovation alone is not sufficient. We must also ask how much is enough? How much wealth, how much consumption do we each require? With a few important exceptions (the work of Herman Daly and colleagues, e.g., Daly and Townsend 1993; see also Princen et al. 2002; Meadows et al. 2004; DeGraaf et al. 2005; Whybrow 2005; Victor 2008; Schor 2010), most of the research, teaching, and popular discourse on sustainability continues to focus on technological solutions—more energy, more resources, more efficient eco-friendly growth—while the actual leverage point—voluntarily limiting our consumption— remains largely undiscussable, particularly among our business and political leaders. That conversation is not an easy one. For many years I have asked my students “how much is enough” (Table 4). Table 4 How much is enough? 1. How much would you need to spend each year to be happy? That is, how much consumption would be enough to satisfy you? Consumption spending here means expenditure to provide for the lifestyle you wish to have, including food, clothing, housing and furnishings, education, health care, travel, entertainment, and all other expenditures on goods and services. Consumption does not include charitable giving, but only what you spend on yourself and your immediate family (spouse and children). Consumption does not include saving or investment (e.g., to build future income for retirement or to leave an estate to your heirs). Consumption does not include payment of taxes, but only the cost of the goods and services you purchase. One way to think about this is to imagine that you are guaranteed an annuity for life, exempt from income and other taxes, and automatically adjusted for inflation. Under those conditions, what annuity would you require? Amount per year in US$:_________________ Select one of the following £ I need at least this much, but more is always better. £ This much would be enough. 2. Imagine the following two worlds World 1: last year you earned $150,000. This year you earned $200,000. World 2: last year you earned $200,000. This year you earned $150,000. The prices of all goods and services are the same in both worlds. The environmental impact of each world is the same, and, through use of green technologies, negligible. Which world do you prefer? £ World 1 £ World 2 3. Imagine the following two worlds World 1: you earn $150,000 per year. Everyone else earns $75,000 per year. World 2: you earn $250,000 per year. Everyone else earns $500,000 per year. The prices of all goods and services are the same in both worlds. The environmental impact of each world is the same, and, through use of green technologies, negligible. Which world do you prefer? £ World 1 £ World 2
Sustaining Sustainability: Creating a Systems Science in a Fragmented Academy…
53
Typical of results with diverse groups, the median response to Question 1 of 109 students at the MIT Sloan School of Management (primarily MBA students) in the fall term of 2010 was $200,000/year. The mean was over $2 million/year, skewed by 14% whose responses were $1 million/year or more. These responses are deeply disturbing. Spending $2 million (or even the median estimate of $200,000) per year dwarfs mean per capita income in the USA, with GDP per capita of $46,650, much less the GDP per capita of most African nations, which remains less than $1,000/ year (2008$; see hdr.undp.org/en/statistics). The urge for more is strong: about half the students chose “more is always better.” Among 156 similar students in my courses on sustainability in 2009 and 2010, an overwhelming 83% preferred to earn more next year than this year (Question 2). These students know they would be better off taking the extra $50,000 up front (the net present value of World 2 is higher: you could spend the same as in World 1, invest the extra $50,000 and have more than $200,000 the second year). When asked why they chose the less valuable option, many reported that it would be hard to reduce their standard of living if their income dropped, though there is nothing in the question that requires them to spend more in year 1 than year 2. Quite a few said they would feel they had somehow failed, would feel less worthy as a person, if their income dropped. Even more disturbing, 58% preferred to earn less each year—as long as they make more than everyone else (Question 3). People tend to judge how well off they are by social comparison, and are less happy when others have more than they do (Layard 2005). Of course, this is a zero sum game: everyone cannot be richer than everyone else. The struggle to keep up with the Jones’ creates an obvious reinforcing feedback, an arms race of conspicuous consumption, egged on by advertising, enabled by borrowing and requiring us to work ever harder. As we do, we have less time for what matters most: exercising and staying healthy, spending time with family and friends, developing intellectually and spiritually, helping those in need. Until we learn to end the quest for more—more income, more wealth, more consumption, more than last year, more than our neighbors—then a healthy, prosperous, and sustainable society cannot be created no matter how clever our technology. Innovation simply lets us grow until one or another limit to growth becomes binding. We are not accustomed to asking “how much is enough,” uncomfortable connecting abstract debates about growth and scarcity with the way live, with our personal responsibility to one another and to future generations. Research, teaching, and action to promote sustainability must grapple with these issues if we are to fulfill Gandhi’s vision of a world in which “there is enough for everyone’s need but not for everyone’s greed.”
Teaching and Learning Creating a sustainable science of sustainability requires changes not only in what we study but how we teach it and communicate it to policymakers, civic and business leaders, the media, and the public at large. How can people develop their
54
J.D. Sterman
systems thinking capabilities? How can people, including scholars, policymakers, business and civic leaders, educators, media, and members of the public, come to deeper understanding of complex systems and the high leverage points needed to build a sustainable society? There is no learning without feedback, without knowledge of the results of our actions. Traditionally, scientists generate that feedback through controlled experimentation, an iterative process through which intuitions are challenged, hypotheses tested, insights generated, new experiments run. But experiments are impossible in many of the most important systems, including many critical for sustainability. When experiment is impossible, scientists rely on models and simulations, which enable controlled experimentation in virtual worlds. Simulation models have long been central in sustainability and environmental research, from models of the percolation of toxics through groundwater to ecosystem dynamics to climate change. But simulations are not only useful in knowledge creation. They must also become a main tool in knowledge communication. As scientists, we develop our understanding through an iterative, interactive learning process of experimentation in both the real world and the virtual world of simulations (Sterman 1994). But all too often we then turn around and tell the results to policymakers, our students and the public through reports, presentations, and lectures. We should hardly be surprised when these people, excluded from the process of discovery—unable to assess the evidence on their own, and presented with conclusions that conflict with deeply embedded mental models—become confused, ignore the results, and challenge our authority. Interactive, transparent simulations for learning, rigorously grounded in and consistent with the best available science, are now available for a wide range of sustainability issues. To enable learning, these “management flight simulators” must give people control over assumptions and scenarios, encourage wide-ranging sensitivity analysis, and run nearly instantly online or on ordinary desktop and laptop computers, so that people receive immediate feedback. Examples range from simple models to help people develop their understanding of stocks and flows (e.g., http:// bit.ly/atmco2), to Fishbanks, a simulation of the tragedy of the commons and “Eclipsing the Competition,” a simulation of the solar photovoltaic industry (both available at http://bit.ly/mstir), to the C-ROADS climate policy simulation (http:// climateinteractive.org) used not only for education but by policymakers and climate negotiators. When experimentation is too slow, too costly, unethical, or just plain impossible, when the consequences of our decisions take years, decades, or centuries to manifest, that is, for most of the important issues we face in building a sustainable world, simulation becomes the main—perhaps the only—way we can discover for ourselves how complex systems work, where the high leverage points may lie. The alternative is rote learning based on the authority of a consultant, teacher, or textbook, a method that dulls creativity, stunts the very systems thinking and scientific reasoning skills we need, and thwarts implementation.
Sustaining Sustainability: Creating a Systems Science in a Fragmented Academy…
55
Conclusion Our society is not sustainable. We harvest renewable resources faster than they regenerate, we create wastes and pollution faster than ecosystems can break them down into harmless substances, and we are, in the words of former US President George W. Bush, “addicted to oil” and other nonrenewable resources. Despite recycling, energy efficient light bulbs and other eco-friendly practices, these imbalances are getting worse, with world population projected to grow by more than two billion in just 40 years, and economic growth doubling the size of the real economy every 20 years. Here I argued that the growing sustainability movement is neither effective nor itself sustainable. Most efforts by firms, individuals, and governments in the name of sustainability are directed at the symptoms of the problem rather than the cause. Many lead to improvement locally and in the short run at the expense of others and future generations. Such policy resistance is not unique to sustainability but common in complex systems at all scales, and arises from widespread failure of systems thinking. Our mental models have narrow boundaries and short time horizons. We commonly frame the sustainability challenge as a conflict, in which the economy, social justice, and the environment fight for primacy, when the economy and society are embedded in the ecosystems upon which all life depends. A healthy society and prosperous economy depend on a healthy environment, and the health of the environment depends on a healthy society and economy that fulfills people’s needs. To move beyond slogans about interconnectedness and systems, however, we need to develop specific tools and methods to develop our systems thinking capabilities, methods that avoid both self-defeating pessimism and mindless optimism, while remaining true to scientific method and ecological realities. Some may object that the call for systems thinking is futile, that most people, including our leaders, are incapable of understanding the complexities of the economy and environment. They caricature systems thinking as hoping that if we just understood how everything is connected to everything else we would all somehow stop living unsustainably, then criticize that cartoon as naïve. Cynics claim that humans are fundamentally selfish, greedy, and shortsighted. To the contrary, the problem is not the few who are truly uncaring. It is the failure of even those who sincerely care to understand the urgent need for action created by the long time delays, feedbacks, nonlinearities, and other characteristics of complex systems. It’s the vast mass of us mindlessly going about our everyday business, oblivious to the consequences of our actions, our behavior shaped by the systems in which we are embedded, systems we created and that only we can change. It’s the belief that we are helpless, that nothing we do makes a difference, that change is not possible—a belief that alienates and discourages us but that we also find comforting because it absolves us from the responsibility to act. Overcoming policy resistance and building a sustainable world requires that we develop a meaningful systems thinking capability so that we can learn, collectively, how we can promote the common good. It requires an unswerving commit-
56
J.D. Sterman
ment to the rigorous application of the scientific method, and the inquiry skills we need to expose our hidden assumptions and biases. It requires us to face the ethical issues raised by growth and inequality, to speak, unafraid, of our deepest aspirations for a just, equitable and sustainable world. It requires that we listen with respect and empathy to others. It requires the humility we need to learn and the courage we need to lead, though all our maps are wrong. If we devote ourselves to that work we can move past denial and despair to create the future we truly desire— not just for us, but for our children. Not just for our children, but for all the children.
References Adelman MA (1993) The economics of petroleum supply. The MIT Press, Cambridge, MA Alley R, Marotzke J, Nordhaus W et al (2003) Abrupt climate change. Science 299:2005–2010 Axelrod R (1976) The structure of decision: the cognitive maps of political elites. Princeton University Press, Princeton, NJ Bahn P, Flenley J (1992) Easter Island, Earth Island. Thames and Hudson, London, UK Bäumer D, Vogel B (2007) An unexpected pattern of distinct weekly periodicities in climatological variables in Germany. Geophy Res Lett 34:L03819 Booth Sweeney L, Sterman JD (2000) Bathtub dynamics: initial results of a systems thinking inventory. System Dyn Rev 16:249–294 Booth Sweeney L, Sterman JD (2007) Thinking about systems: students’ and their teachers’ conceptions of natural and social systems. System Dyn Rev 23:285–312 Buehler R, Griffin D, Ross M (2002) Inside the planning fallacy: the causes and consequences of optimistic rime predictions. In: Gilovich T, Griffin D, Kahneman D (eds) Heuristics and biases. Cambridge University Press, Cambridge, UK Cerveny R, Balling R (1998) Weekly cycles of air pollutants, precipitation, and tropical cyclones in the coastal NW Atlantic region. Nature 394:561–563 Intergovernmental Panel on Climate Change (2007) Climate change 2007: the physical science basis. Cambridge University Press, Cambridge, UK. http://www.ipcc.ch Cronin M, Gonzalez C, Sterman J (2009) Why don’t well-educated adults understand accumulation? A challenge to researchers, educators, and citizens. Organ Behav Hum Decis Proc 108:116–130 Daly H (1991) Steady-state economics, 2nd edn. Island Press, Washington, DC Daly H, Townsend K (1993) Valuing the earth: economics, ecology, ethics. MIT Press, Cambridge, MA DeGraaf J, Wann D, Naylor T (2005) Affluenza: the all-consuming epidemic, 2nd edn. BerrettKohler, San Francisco, CA Diamond J (2005) Collapse: how societies choose to fail or succeed. Viking, New York, NY Dörner D (1980) On the difficulties people have in dealing with complexity. Simulations Games 11:87–106 Dörner D (1996) The logic of failure. Metropolitan Books/Henry Holt, New York, NY FAO (2008) The state of world fisheries and aquaculture 2008. UN Food Agric Organ, Rome Faro D, McGill A, Hastie R (2010) Naïve theories of causal force and compression of elapsed time judgments. J Pers Soc Psychol 98:683–701 Festinger L (1957) A theory of cognitive dissonance. Row, Peterson, Evanston, IL Fiddaman T (2002) Exploring policy options with a behavioral climate-economy model. System Dyn Rev 18:243–267
Sustaining Sustainability: Creating a Systems Science in a Fragmented Academy…
57
Fong I, Drlica K (2003) Reemergence of established pathogens in the 21st century. Kluwer/ Plenum, New York, NY Forrester JW (1969) Urban dynamics. Pegasus Communications, Waltham, MA Forrester JW (1971a) Counterintuitive behavior of social systems. Technol Rev 73:52–68 Forrester JW (1971b) World dynamics. Pegasus Communications, Waltham, MA Forster P, Solomon S (2003) Observations of a ‘weekend effect’ in diurnal temperature range. PNAS 100:11225–11230 Hardin G (1968) The tragedy of the commons. Science 162:1243–1248 Hoffman M, Hilton-Taylor C, Angulo A et al (2010) The impact of conservation on the status of the world’s vertebrates. Science 300:1503–1509 Horn S, Sharkey P, Tracy D et al (1996) Intended and unintended consequences of HMO costcontainment strategies: results from the managed care outcomes project. Am J Manag Care 2:253–264 Huxley T (1883) Inaugural address. Fisheries exhibition, London http://aleph0.clarku.edu/huxley/ SM5/fish.html Kahneman D, Diener E, Schwarz N (1999) Well-being: the foundations of hedonic psychology. Russell Sage, New York, NY Kirch P (1997) Microcosmic histories: island perspectives on ‘global’ change. Am Anthropol 99:30–42 Kurlansky M (1997) Cod: a biography of the fish that changed the world. Penguin, New York, NY Laux P, Kunstmann H (2008) Detection of regional weekly weather cycles across Europe. Environ Res Lett 3:044005 Layard R (2005) Happiness: lessons from a new science. Penguin Press, New York, NY McKibben B (2010) Earth. Times Books/Henry Holt, New York, NY Meadows D, Randers J, Meadows D (2004) The limits to growth: the thirty year update. Chelsea Green, White River Junction, VT Meehl GA, Washington WM, Collins WD et al (2005) How much more global warming and sea level rise? Science 307:1769–1772 Moxnes E (2000) Not only the tragedy of the commons: misperceptions of feedback and policies for sustainable development. System Dyn Rev 16:325–348 National Research Council (2010) Hidden costs of energy: unpriced consequences of energy production and use. National Academies Press, Washington, DC Nordhaus W (1992) An optimal transition path for controlling greenhouse gases. Science 258:1315–1319 O’Neill B, Oppenheimer M (2002) Dangerous climate impacts and the Kyoto protocol. Science 296:1971–1972 Ostrom E (2010) Beyond markets and states: polycentric governance of complex economic systems. Am Econ Rev 100:641–672 Palumbi S (2001) Humans as the world’s greatest evolutionary force. Science 293:1786–1790 Pauly D (1995) Anecdotes and the shifting baseline syndrome of fisheries. Trends Ecol Evol 10:430 Pereira H, Leadeley P, Proenca V et al (2010) Scenarios for global biodiversity in the 21st century. Science 330:1496–1500 Plous S (1993) The psychology of judgment and decision making. McGraw Hill, New York, NY Princen T, Maniates M, Conca K (2002) Confronting consumption. MIT Press, Cambridge, MA Repenning N, Sterman J (2001) Nobody ever gets credit for fixing problems that never happened: creating and sustaining process improvement. California Management Review 43(4):64–88. Rockström J et al (2009) A safe operating space for humanity. Nature 461:472–475 Rosenberg A, Bolster W, Alexander K et al (2004) The history of ocean resources: modeling cod biomass using historical records. Frontiers Ecol Environ 3:84–90 Rosenthal R, Jacobson L (1968) Pygmalion in the classroom: teacher expectation and pupil’s intellectual development, Expanded edn. Irvington Publishers/Ardent Media, Norwalk, CT Schor J (2010) Plenitude: The new economics of true wealth. New York: Penguin. Senge P, Smith B, Schley S, Laur J (2008) The necessary revolution. Doubleday, New York, NY
58
J.D. Sterman
Simon J (1996) The ultimate resource 2. Princeton University Press, Princeton, NJ Solomon S, Plattner G-K, Knutti R, Friedlingstein P (2009) Irreversible climate change due to carbon dioxide emissions. PNAS 106:1704–1709 Stachowicz J, Terwin J, Whitlatch R, Osman R (2002) Linking climate change and biological invasions: ocean warming facilitates nonindigenous species invasions. PNAS 99:15497–15500 Steadman D (1995) Prehistoric extinctions of Pacific island birds: biodiversity meets zooarchaeology. Science 267:1123–1131 Sterman JD (1989) Modeling managerial behavior: misperceptions of feedback in a dynamic decision making experiment. Manag Sci 35:321–339 Sterman JD (1994) Learning in and about complex systems. System Dyn Rev 10:291–330 Sterman JD (2000) Business dynamics: systems thinking and modeling for a complex world. Irwin/McGraw-Hill, New York, NY Sterman JD (2002) All models are wrong: reflections on becoming a systems scientist. System Dyn Rev 18:501–531 Sterman JD (2008) Risk communication on climate: mental models and mass balance. Science 322:532–533 Sterman JD (2010) Does formal system dynamics training improve people’s understanding of accumulation? System Dyn Rev 26:316–334 Sterman JD, Booth Sweeney L (2007) Understanding public complacency about climate change: adults’ mental models of climate change violate conservation of matter. Clim Change 80:213–238 Suzuki D (2007) The sacred balance: rediscovering our place in nature, 3rd edn. Greystone Books, New York, NY Tengs T, Ahma S, Savage J et al (2005) The AMA proposal to mandate nicotine reduction in cigarettes: a simulation of the population health impacts. Prevent Med 40:170–180 Thomas C, Cameron A, Green R et al (2004) Extinction risk from climate change. Nature 427:145–148 United Nations (2011) World population prospects: the 2010 revision. http://esa.un.org/unpd/wpp/ index.html. Accessed 29 March 2012 US Forest Service (2003) Influence of forest structure on wildfire behavior and the severity of its effects. http://www.fs.fed.us/projects/hfi/science.shtml. Accessed 29 March 2012 Victor P (2008) Managing without growth. Edward Elgar, Cheltenham, UK Wackernagel M, Schulz N, Deumling D et al (2002) Tracking the ecological overshoot of the human economy. PNAS 99:9266–9271 Wagenaar W (1978) Intuitive prediction of growth. In: Burkhardt D, Ittelson W (eds) Environmental assessment of socioeconomic systems. Plenum, New York, NY Wagenaar W, Sagaria S (1975) Misperception of exponential growth. Percept Psychophys 18:416–422 Webster D (2002) The fall of the ancient Maya. Thames and Hudson, New York, NY Whybrow P (2005) American mania: when more is not enough. WW Norton, New York, NY Wigley T (2005) The climate change commitment. Science 307:1766–1769 Wilmshurst J, Hunt T, Lipo C, Anderson A (2011) High-precision radiocarbon dating shows recent and rapid initial human colonization of East Polynesia. Proceedings of the National Academy of Sciences 108(5):1815–1820 Wilde G (2002) Target risk 2: a new psychology of safety and health. PDE Publications, New York, NY World Bank (2010) http://databank.worldbank.org. Accessed 29 March 2012 World Commission on Dams (2000) Dams and development. Earthscan, London, UK