2010 Fifth International Conference on Digital Telecommunications
SVM - MLP - PNN Classifiers on Speech Emotion Recognition Field A Comparative Study
Theodoros Iliou, Christos-Nikolaos Anagnostopoulos Cultural Technology and Communication Department University of the Aegean Mytilene, Lesvos Island, GR-81100
[email protected],
[email protected] exhibit higher flexibility while one works in uncertain or complex environments. Companion devices, such as digital pets, use ER abilities to enhance realism and provide a higher degree of autonomy. Other potential applications are centered around social monitoring. For example, a car can monitor the emotion of all occupants and engage in additional safety measures, such as alerting other vehicles if it detects the driver to be angry. ER has potential applications in human computer interaction, such as affective mirrors allowing the user to see how he or she performs; emotion monitoring agents sending a warning before one sends an angry email; or even music players selecting tracks based on mood [4]. ER is also being applied to the development of communicative technologies for use by people with autism. People with disabilities can benefit from speech emotion recognition programs. There is growing need for technologies to assist with the inhome care of the elderly and people with Alzheimer's, Parkinson's and other disabilities or traumas. Emotional speech processing recognizes the user's emotional state by analyzing speech patterns. Vocal parameters and prosody features such as fundamental frequency, intensity and speaking rate are strongly related with the emotion expressed in speech [7][1]. However, voice quality and short-term spectral features have also to be considered when studying emotional or affective speech [2][8][9] and speech rate are analyzed through pattern recognition [9][10]. In this work, we used and Multilayer Percepton(MLP), Probabilistic Neural Networks(PNN) and Support Vector Machine(SVM) to classify seven emotions. There are a variety of temporal and spectral features that can be extracted from human speech. We used statistical analysis in order to select features relating to the pitch, Mel Frequency Cepstral Coefficients (MFCCs) and Formants of speech as inputs to classification algorithms. The emotion recognition accuracy of these experiments allow us to show which features carry the most emotional information and which classifier reaches better accuracy.
Abstract— In this paper, we present a comparative analysis of three classifiers for speech signal emotion recognition. Recognition was performed on emotional Berlin Database. This work focuses on speaker and utterance (phrase) dependent and independent framework. One hundred thirty three (133) sound/speech features were extracted from Pitch, Mel Frequency Cepstral Coefficients, Energy and Formants and were evaluated in order to create a feature set sufficient to discriminate between seven emotions in acted speech. A set of 26 features was selected by statistical method and Multilayer Percepton, Probabilistic Neural Networks and Support Vector Machine were used for the Emotion Classification at seven classes: anger, happiness, anxiety/fear, sadness, boredom, disgust and neutral. In speaker dependent framework, Probabilistic Neural Network classifier reached very high accuracy of 94%, whereas in speaker independent framework, Support Vector Machine classification reached the best accuracy of 80%. The results of numerical experiments are given and discussed in the paper. Keywords - Emotion Recognition , Artificial Neural Networks, Support Vector Machine, Speech Processing.
I.
INTRODUCTION
Communication is an important capability, not only based on the linguistic part but also based on the emotional part. Therefore, emotion detection from speech could have many potential applications in order to make the computer more adaptive to the user’s needs [1][2]. Emotional inflection and modulation in synthesized speech, either through phrasing or acoustic features is useful in humancomputer interaction. Such capability makes speech natural and expressive. For example a dialog system might modulate its speech to be more puerile if it deems the emotional model of its current user is that of a child. In e-learning applications, Emotion Recognition (ER) can be used to adjust the presentation style of a computerized tutor when a learner is bored, interested, frustrated, or pleased [3][4]. Psychological health services, i.e. counseling, benefit from affective computing applications when determining a client's emotional state [5][6]. Affective computing sends a message via color or sound to express an emotional state to others. Robotic systems capable of processing affective information
978-0-7695-4071-9/10 $26.00 © 2010 IEEE DOI 10.1109/ICDT.2010.8
The paper is structured as follows. The following section describes a dimensional view of emotions. Section III reports analytically the sound features that have been tested and how these features were calculated. Section IV describes the selected classifiers, as well as the two separate testing
1
vector to correspond to that frame. If the speech is unvoiced the corresponding marker in the pitch vector was set to zero. In addition, for each 5ms frame of speech, the first four standard MFCC parameters were calculated by taking the absolute value of the Short-Time Fourier Transform (STFT), warping it to a Mel-frequency scale, taking the Discrete Cosine Transform (DCT) of the log-Mel spectrum and returning the first 4 components. The Matlab Code which performs the above calculation was provided in [23]. Energy, often referred to as the volume or intensity of the speech, is also known to contain valuable information. Energy provides information that can be used to differentiate sets of emotions, but this measurement alone is not sufficient to differentiate basic emotions. In [24] it is referred that fear, joy, and anger have increased energy level, whereas sadness has low energy level. The choice of the window in short-time speech processing determines the nature of the measurement representation. The energy frame size should be long enough to smooth the contour appropriately but short enough to retain the fast energy changes which are common in speech signals and it is suggested that a frame size of 10–20 ms would be adequate. Two representative windows are widely used, Rectangular and Hamming. The latter has almost twice the bandwidth of the former, for the same length. Furthermore, the attenuation for the Hamming window outside the passband is much greater. Short-Time energy is a simple short-time speech measurement. It is defined by (1):
frameworks (speaker dependent/ independent recognition). The paper ends with the conclusion section, which highlights also several aspects of the emotion recognition task on the basis of sound processing. II.
BASIC EMOTIONS
According to a dimensional view of emotions, large amounts of variation in emotions can be located in a twodimensional space, with coordinates of valence and arousal [8]. The valence dimension refers to the hedonic quality of an affective experience and ranges from unpleasant to pleasant. The arousal dimension refers to the perception of arousal associated with the experience, and ranges from very calm to very excited at the other etc. In this paper, the Berlin Emotional database (EMO-DB) [10] was used to conduct our experiments, which contains 535 utterances of 10 actors (5 male, 5 female) simulating 7 emotional states. The above set of seven emotion classes can also be well separated into two hyper classes, namely high arousal containing anger, happiness, anxiety/fear and low arousal containing neutral, boredom, disgust and sadness. The classification of disgust into low arousal can be challenged, but according to the literature disgust belongs to low arousal emotions [9]. In the experiments reported in this paper, always whole utterances have been analysed. III.
SOUND/SPEECH FEATURES
The fundamental frequency (F0), often referred to as the pitch, is one of the most important features for determining emotion in speech [11][12][13][14]. Bäzinger et al. argued that statistics related to pitch convey considerable information about emotional status [15]. However, pitch was also shown to be most gender-dependent feature [16]. If the recognition system ignores this issue a misclassification of utterances might be the consequence. It should be noted that most of the features that will be described below are genderdependent to varying degrees. Beside pitch, other commonly employed features are related to energy, speaking rate, formants, as well as spectral features, such as MFCCs. Wang & Guan [17] and [18] used prosodic, MFCCs and formant frequency features to represent the characteristics of the emotional speech while the facial expressions were represented by Gabor wavelet features. According to Kostoulas et al. [19], an individual’s emotional state is strongly related to pitch and energy while pitch and energy of a speech signal expressing happiness or anger is, usually, higher than those associated with sadness. MFCCs have been widely used for speech spectral representation in numerous applications, including speech, speaker, gender and emotion recognition [11]. They are also increasingly finding uses in music information retrieval applications such as genre classification and audio similarity measures [20]. In this paper, pitch was extracted from the speech waveform using a modified version of the algorithm for pitch tracking proposed in [21], which is offered in the VOICEBOX toolbox [22]. Using a frame length of 100ms, the pitch for each frame was calculated and placed in a
E n = ∑ [ x(m) ⋅ w(n − m)] 2
(1)
where m is the overlapping length of the original signal x and Hamming windowed signal w with length n. For the length of the window a practical choice is 160-320 samples (sample for each 10-20 msec) for sampling frequency 16kHz. For our experiments the Hamming window was used, taking samples every 20msecs. The resonant frequencies produced in the vocal tract are referred to as formant frequencies or formants [25]. Although some studies in automatic recognition have looked at the first two formant frequencies (F1 and F2) [13], [20], [26] the formants have not been extensively researched. For this reason, in our experiments, the first five formant frequencies are extracted using Praat, which offers a formant tracking algorithm [27]. A.
Feature selection
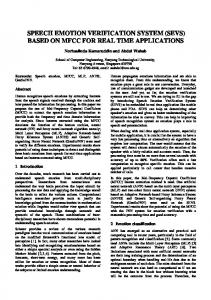
Based on the acoustic features described above and the literature relating to automatic emotion detection from speech, 133 prosodic features are calculated based which are represented as contours: the pitch, the 12 MFCCs, the energy, and the first 5 formant frequencies. From these 19 contours, extracted seven statistics have been extracted: the mean, the standard deviation, the minimum value, the maximum value, the range (max-min) of the original contour and the mean and standard deviation of the contour gradient. All the 133 measurements are shown in Table I (e.g., the mean of derivative for MFCC6 is the feature with ID 45).
2
TABLE I.
THE OVERALL 133 SPEECH FEATURES. SHADED CELLS
TABLE II. FEATURE EVALUATORS AND SEARCH METHODS THAT WERE CONSIDERED. SHADED CELLS INDICATE THE SELECTED COMBINATION
INDICATE THE SELECTED FEATURES
Prosodic
Mean
Std
Feature
Mean of
Std of
Max
Min
Range
derivative derivative
Feature evaluator
Feature search correlation coefficient
(offered in SPSS)
(offered in SPSS)
Pitch
1
2
3
4
5
6
7
MFCC1
8
9
10
11
12
13
14
Spearman's rho
MFCC2
15
16
17
18
19
20
21
Kendall's tau-b
MFCC3
22
23
24
25
26
27
28
MFCC4
29
30
31
32
33
34
35
MFCC5
36
37
38
39
40
41
42
MFCC6
43
44
45
46
47
48
49
MFCC7
50
51
52
53
54
55
56
MFCC8
57
58
59
60
61
62
63
MFCC9
64
65
66
67
68
69
70
MFCC10
71
72
73
74
75
76
77
MFCC11
78
79
80
81
82
83
84
MFCC12
85
86
87
88
89
90
91
Energy
92
93
94
95
96
97
98
F1
99
100
101
102
103
104
105
F2
106
107
108
109
110
111
112
F3
113
114
115
116
117
118
119
F4
120
121
122
123
124
125
126
F5
127
128
129
130
131
132
133
Bivariate Correlation
C. Spearman Correlation Coefficient For each of the variables X and Y (Bivariate Correlation) separately, the observations are sorted into ascending order and replaced by their ranks. In situations where t observations are tied, the average rank is assigned. Each time t >1, the quantity t3-t is calculated and summed separately for each variable. These sums will be designated STx and STy . For each of the N observations, the difference between the rank of X and rank of Y is computed as seen in (2).
(2)
d i = R ( X i ) − R (Y i )
Spearman’s rho (p) [28] is calculated by (3), (4) and (5) Tx + Ty − ps =
B.
Pearson's
Sound feature selection
and T y =
2 i
i =1
(3)
2 T xT y
Where: T x = N
In order to select the most important prosodic features and optimise the classification time, the Bivariate Correlation procedure and especially the Spearman's rho correlation coefficient was used [33]. The Bivariate Correlations procedure computes Pearson's correlation coefficient, Spearman's rho, and Kendall's tau-b with their significance levels. Spearman's rho correlation coefficient is a measure of not linear association. Two symmetric quantitative variables or variables with ordered categories can be perfectly related by Spearman's rho correlation coefficient. If the data are not normally distributed or have ordered categories, the Kendall's tau-b or Spearman are chosen, which measure the association between rank orders. Correlation coefficients range in value from –1 (a perfect negative relationship) and +1 (a perfect positive relationship). A value of 0 indicates no linear relationship [29][30][32]. For the method selection, the SPSS (Statistical Package for the Social Sciences) statistics software tool was used [31]. Among its features, the user may find modules for statistical data analysis, including descriptive statistics such as plots, frequencies, charts, and lists, as well as sophisticated inferential and multivariate statistical procedures like analysis of variance (ANOVA), factor analysis, cluster analysis, and categorical data analysis. Several correlation coefficients have been tested as shown in Table IV in order to assess the feature selection combination that gives the optimum performance for our problem. The shaded cells in Table II shows the feature evaluator and search correlation coefficients that presented the best performance in the data set.
N
∑d 3
− N − ST x 12
N 3 − N − ST y 12
(4) (5)
If Tx or Ty equals to 0, the statistic is not computed. The significance level is calculated assuming that, under the null hypothesis seen in (6), t is distributed as a t with N - 2 degrees of freedom. A one- or two-tailed significance level is printed depending on the user-selected option.
t = ps
N −2 1 − rs2
(6)
Two symmetric quantitative variables or variables with ordered categories can be perfectly related by Spearman's rho correlation coefficient. By this way we found the features that are highly correlated with the class variable (Emotion category). Spearman Correlation Coefficient (SCC) was selected as feature selection method, since it was proved after several tests, that it provides the most efficient sound measurements for the training of the Neural Network. The combination of the above mentioned methods proposed 35 from the total of 133 features that were originally extracted. The shaded cells in Table III indicate the selected features. It can be seen, that 1 feature has been selected from pitch, namely the mean pitch. In addition, 29 features related to MFCCs were found important, while for 3
TABLE III.
the third prosodic group (energy) 5 features have been selected. Finally, none of the formant features has been found significantly important.
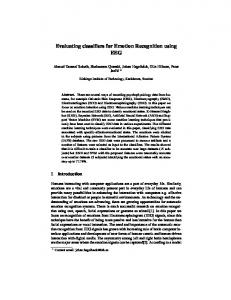
CONFUSION MATRIX FOR SPEAKER-DEPENDENT EMOTION RECOGNITION FOR MLP CLASSIFIER High arousal emotions
IV.
CLASSIFICATION
Classification was performed using DTREG [3]. In this research, the classifiers were MLP, PNN, and SVM. Neural Networks are predictive models loosely based on the action of biological neurons. A MLP is a model developed to simulate the function of neurons in a nervous system. Although the implementation is very different, PNN are conceptually similar to K-Nearest Neighbor (k-NN) models. The basic idea is that a predicted target value of an item is likely to be about the same as other items that have close values of the predictor variables [33]. SVMs are a set of related supervised learning methods used for classification and regression. A support vector machine constructs a hyperplane or set of hyperplanes in a high-dimensional space, which can be used for classification, regression or other tasks. Intuitively, a good separation is achieved by the hyperplane that has the largest distance to the nearest training datapoints of any class (so-called functional margin), since in general the larger the margin the lower the generalization error of the classification. After experimentation with various network topologies highest accuracy by MLP was found with 16 neurons in the hidden layer. The early stopping criterion was used based on a validation set consisting of 25% of the training set. This ensures that the training process stops when the meansquared error (MSE) begins to increase on the validation set avoiding the over-fitting problem in this problem. The 10 VFold validation method was used. Error backpropagation was used as a training algorithm. Moreover, all layers in DTREG follow the logistic activation function, while all attributes have been normalized for improved performance of the network. For PNN classifier with the 10 V-Fold validation method the highest accuracy was found with the Gaussian Kernel function, and Sigma values for each variable and class. For the rest of the settings we used the default settings. The highest accuracy by SVM using the 10 V-Fold validation method was found with C-SVC SVM Model using RBF Kernel function A.
Low arousal emotions
Anger HappinessAnxiety/Boredom DisgustSadness Neutral fear 0 0 0 Anger 1 115 6 (4.7%) 5 (3.9%) (0.0%) (0.7%) (0.0%) (0.0%) (90.5%) 0 1 Happiness 4 (5.6%)3 (4.2%) 4 5 54 (5.6%) (0.0%) (1.4%) (7.0%) (76.0%) Anxiety 5 (7.2%) 8 52 0 (0.0%) 2 1 1 /fear (11.5%) (75.3%) (2.8%) (1.4%) (1.4%)
1 3 (3.7%) 1 (1.2%) 65 2 1 8 (1.2%) (80.2%) (2.4%) (1.2%) (9.8%) 1 0 Disgust 3 (6.5%) 3 (6.5%) 0 5 34 (0.0%) (10.8%) (73.9%) (2.1%) (0.0%) 0 0 0 5 (8.0%) 0 Sadness 53 4 (0.0%) (0.0%) (0.0%) (0.0%) (85.4%) (6.4%) 0 0 5 (6.3%) 0 Neutral 0 2 72 (0.0%) (2.5%) (91.1%) (0.0%) (0.0%) (0.0%) Boredom
TABLE IV.
CONFUSION MATRIX FOR SPEAKER-DEPENDENT EMOTION RECOGNITION FOR PROBABILISTIC NEURAL NETWORK
Table III shows the confusion matrix for the 535 utterances of the Berlin database. Successful recognition is shown in the main diagonal. The overall success rate was 83%. However, considering the emotion classification in the two hyper-classes the correct classification reaches 95.1% for high arousal and 95.8% for low arousal emotions. After MLP, a PNN was trained. For the classification experiment the 10x10-fold stratified cross-validation method was employed over the data sets. Table IV shows the confusion matrix for the 535 utterances of the Berlin database. Successful recognition is shown in the main diagonal. The overall success rate was 94.1%. However, considering the emotion classification in the two hyper-classes the correct classification reaches 98.1% for high arousal and 97.7% for low arousal emotions. Finally, a SVM was trained using the 10-fold cross validation method. Table V shows the confusion matrix for the 535 utterances of the Berlin database. Successful recognition is shown in the main
Speaker dependent recognition in EMO-BD
The first experiment in our research corresponds to the problem of emotion recognition when the speakers are known to the classifier (i.e. at least on version of the each utterance/speaker is presented to the training set). Hence, this experiment corresponds to emotion recognition in a speaker dependent framework. For this case, from the 535 utterances provided in the Berlin Database we used three classifiers. First a MLP with 26-16-7 topology was trained using the 10fold cross validation method. For the classification experiment the 10x10-fold stratified cross-validation method was employed over the data sets.
4
TABLE VII.
diagonal. The overall success rate was 84%. However, considering the emotion classification in the two hyperclasses the correct classification reaches 97% for high arousal and 96.27% for low arousal emotions. TABLE
B.
V
CONFUSION MATRIX FOR SPEAKER-DEPENDENT EMOTION RECOGNITION FOR SVM
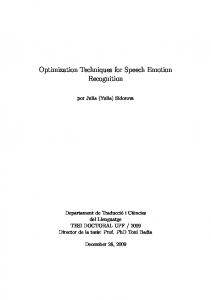
The confusion matrix of Table V and Table VI reveals that the SVMs performance (approximately 78% correct classification in the seven emotions) reach higher accuracy than MLP (approximately 53% correct classification in the seven emotions). However, observing the results for MLP in the two hyper-classes (low and high arousal), the recognition rate reach 89.1% for high arousal and 78.8% for low arousal emotions, while the results is surprising higher for SVM in the two hyper-classes (low and high arousal), the recognition rate reaches 100% for high arousal and 87% for low arousal emotions. We did not use the PNN classifier for Independent Emotion Recognition because the DTREG Tool had problems during the classification procedures
Speaker independent recognition in EMO-BD
Speaker independent emotion recognition in Berlin database by MLP was evaluated averaging the results of five separate experiments. In each experiment, the measurements of a pair of speakers (e.g. speaker 03 and speaker 08), were extracted from the training set and formed the testing set for the classifier. The pairs were selected in order to include one male and one female speaker at a time. TABLE VI.
SUPPORT VECTOR MACHINE - OVERALL PERFORMANCE
V.
The major finding in this work is that PNN achieved almost perfect correct classification (94%) in speaker dependent emotion recognition. This finding suggests that PNN proved the most adequate classifier for the dependent emotion recognition field. As well, in speaker independent emotion recognition, SVMs overall success rate was very high (78%), and the surprising finding is that SVM achieved perfect correct classification in High arousal emotions(100%), and significant success rate in Low arousal emotions(87%). The problem is extremely complicated and thus, the researchers usually deal with elicited and acted emotions in a lab setting from few actors, just like in our case. However, in the real problem, different individuals reveal their emotions in a diverse degree and manner. This difference between acted and real emotions is also demonstrated in a recent work [34]. The experimentations demonstrated some important differences on recognizing acted versus non-acted speech, which cause significant drop of performance, for the real-world data. A future work should encompass an Hybrid Mixed Classification Model combining PNN, SVM and maybe more classifiers so as to recognize emotions in non-acted speech.
MLP CLASSIFIER- OVERALL PERFORMANCE IN 7 EMOTION CLASSES AFTER THE 5 SPEAKER-INDEPENDENT EXPERIMENTS
High arousal emotions anger
happiness
anxiety/ fear
Low arousal emotions boredom
disgust
sadness
neutral
2(1.5%)
1(0.7%)
0(0.0%)
2(2.8%)
1(1.4%)
3(4.3%)
5(6.1%)
10 (12.3%) 2(4.3%)
0(0.0%) 1 (0.7%) 22 (17.4%) 83 18 (65.8%) (14.2%) Happiness 27(38.0%) 9 (12.6%) 3 (4.2%) 19 11 (26.7%) (15.4%) 4(5.7%) 0(0.0%) 5(7.2%) anxiety /fear 23 33 (33.3%) (47.8%) Boredom 1(1.2%) 1 (1.2%) 48(59.2%) 1 (1.2%) 15 (18.5%) Disgust 3(6.5%) 16 (34.7%) 4(8.6%) 3 (6.5%) 16 (34.7%) Sadness 0(0.0%) 1(1.6%) 1 (1.6%) 8(12.9%) 2 (3.2%)
39(62.9%)
neutral
5 (6.2%)
Anger
1(1.2%) 10 (12.5%)
4(5.0%)
10(12.5%) 0 (0.0%)
2(4.3%)
CONCLUSION AND D ISCUSSION
11 (17.7%) 50 (62.5%)
5
REFERENCES [1]
[2]
[3] [4]
[5]
[6]
[7]
[8]
[9]
[10]
[11]
[12]
[13]
[14]
[15]
[16]
M. Pantic and L. J. M. Rothkrantz, “Toward an affect-sensitive multimodal human-computer interaction”, Proceedings of the IEEE, vol. 91, Issue 9, Sept. 2003, pp. 1370–1390, doi: 10.1109/JPROC. 2003.817122. R. Cowie, E. Douglas-Cowie, N. Tsapatsoulis, G. Votsis, S. Kollias, W. Fellenz, and J. G. Taylor, “Emotion recognition in humancomputer interaction.”, IEEE Signal Processing Magazine, vol. 18, Issue 1, Jan. 2001, pp. pp. 32–80, doi: 10.1109/79.911197. DTREG, [Computer program], http://www.dtreg.com/; last access date [March 10, 2010]. Jef Raskin: The humane interface. New directions for designing interactive systems. Addison-Wesley, Boston 2000 ISBN 0-20137937-6 L. C. De Silva and P. C. Ng, “Bimodal emotion recognition”, Proc. 4th IEEE Intrnational Conference on Automatic Face and Gesture Recognition (FG), IEEE, March 2000, pp. 332–335, doi: 10.1109/AFGR.2000.840655. B. Shneiderman and C. Plaisant: Designing the User Interface: Strategies forEffective Human–Computer Interaction. 4th ed. Addison Wesley, 2004 ISBN 0-321-19786-0. Y. Yoshitomi, S. Kim, T. Kawano, and T. Kitazoe, “Effect of sensor fusion for recognition of emotional states using voice, face image and thermal image of face”, Proc. 9th IEEE International Workshop on Robot and Human Interactive Communication (ROMAN), IEEE, Sept. 2000, pp. 178–183, doi: 10.1109/ROMAN.2000.892491. P. J. Lang, “The Emotion Probe: Studies of Motivation and Attention”, American Psychologist, vol 50, no. 5, May 1995, pp. 37285. V. Hozjan and Z. Kacic, “Context-independent multilingual emotion recognition from speech signals”, International journal of Speech Technology, vol. 6, July 2003, pp. 311–320, doi: 10.1023/A:1023426522496. F. Burkhardt, A. Paeschke, M. Rolfes, W. Sendlmeier, and B. Weiss, “A database of german emotional speech” Proc. 9th International Conference on Spoken Language Processing (INTERSPEECHICSLP 2005), ISCA, Sept. 2005, pp. 1517-1520. S. Kim, P. Georgiou, S. Lee, and S. Narayanan. “Real-time emotion detection system using speech: Multi-modal fusion of different timescale features”, Proc. 9th IEEE Workshop on Multimedia Signal Processing Workshop, Oct. 2007, pp. 48-51, doi 10.1109/MMSP.2007.4412815. D. Morrison, R. Wang, and L. C. De Silva, “Ensemble methods for spoken emotion recognition in call-centres”, Speech Communication, vol. 49, issue 2, Feb. 2007, pp. 98–112, doi: 10.1016/j.specom.2006.11.004. J. Ang, R. Dhillon, A. Krupski, E. Shriberg, and A. Stolcke, “Prosody-based automatic detection of annoyance and frustration in human–computer dialog”, Proc. International Conference on Spoken Language Processing (ICSLP 2002), ISCA, Dec. 2002, pp. 20372040. V. Petrushin, “Emotion recognition in speech signal: experimental study, development, and application”, Proc. Sixth International Conference on Spoken Language Processing (ICSLP 2000), ISCA, Oct.2000. vol 2, pp. 222-225. T. Bänziger and K. R. Scherer, “The role of intonation in emotional expression”, Speech Communication, vol.46, issues 3-4, July 2005, pp. 252-267, doi:. 10.1016/j.specom.2005.02.016. W. H. Abdulla and N. K. Kasabov, “Improving speech recognition performance through gender separation”, Proc. Fifth Biannual
[17]
[18]
[19]
[20]
[21]
[22] [23] [24]
[25] [26]
[27]
[28] [29]
[30]
[31] [32] [33]
[34]
6
Conference on Artificial Neural Networks and Expert Systems (ANNES), University of Otago Printery, Nov. 2001, pages 218–222. Y. Wang and L. Guan, “Recognizing human emotion from audiovisual information”, Proc. IEEE International Conference on Acoustics, Speech, and Signal Processing (ICASP), March 2005, pp. 1125-1128. T.Vogt and E. Andre, “Improving Automatic Emotion Recognition from Speech via Gender Differentiation”, Proc. Language Resources and Evaluation Conference (LREC), May 2006, pp. 1123–1126. T. P. Kostoulas and N. Fakotakis, “A Speaker Dependent Emotion Recognition Framework”, Proc. 5th International Symposium, Communication Systems, Networks and Digital Signal Processing (CSNDSP), University of Patras, July 2006, pp. 305-309. M.Fingerhut, "Music Information Retrieval, or how to search for (and maybe find) music and do away with incipits", Proc. joint Conf. International Association of Music Libraries, International Association of Sound and Audiovisual Archives (IAML-IASA), Aug. 2004, CD proceedings. D. Talkin, “A Robust Algorithm for Pitch Tracking (RAPT)”, in Speech Coding & Synthesis, W. B. Kleijn, K. K. Paliwal, Eds., Elsevier Science Inc., 1995. http://www.ee.ic.ac.uk/hp/staff/dmb/voicebox/voicebox.html; last access date [March 10, 2010]. http://www.ee.columbia.edu/~dpwe/resources/matlab/rastamat/; last access date [March 10, 2010]. K.R. Scherer, “Vocal communication of emotion: a review of research paradigms”, Speech Communication, vol 40, issues 1-2, April 2003, pp. 227–256, doi: 10.1016/S0167-6393(02)00084-5. L.R. Rabiner and R.W. Schafer, Digital Processing of Speech Signals. Prentice-Hall, Englewood Cliffs, New Jersey, 1978. C. M. Lee, S. Yildirim, M. Bulut, A. Kazemzadeh, C. Busso, Z. Deng, S. Lee, and S. Narayanan, “Emotion recognition based on phoneme classes”, Proc. 8th International Conference on Spoken Language Processing (INTERSPEECH-ICSLP 2004), Oct. 2004, pp. 889-892. P. Boersma and D. Weenink, “Praat: doing phonetics by computer (Version 4.6.09)”, 2005 [Computer program], http://www.praat.org/; last access date [March 10, 2010]. C. Spearman, "The proof and measurement of association between two things" Amer. J. Psychol. , 15 (1904) pp. 72–101. T. Iliou and C. N. Anagnostopoulos, "Statistical Evaluation of Speech Features for Emotion Recognition," icdt, pp.121-126, 2009 Fourth International Conference on Digital Telecommunications, 2009. T. Iliou and C. N. Anagnostopoulos, " Comparison of Different Classifiers for Emotion Recognition," pci, pp.121-126, 2009 Fourth PanHellenic Conference on Informatics, 2009. http://www.spss.com/corpinfo/?source=homepage&hpzone=nav ; last access date [March 10, 2010]. S. Siegel, Non-parametric Statistics for the Behavioral Sciences. McGraw-Hill Book Co., Inc., New York, 1956. T. M. Cover and P. E. Hart, "Nearest neighbor pattern classification," IEEE Transactions on Information Theory, (1967) Vol. 13 (1) pp. 2127. T. Kostoulas, T. Ganchev, and N. Fakotakis, “Study on speakerindependent emotion recognition from speech on real-world data”, in Verbal and Nonverbal Features of Human-Human and HumanMachine Interaction, A. Esposito, Eds. Springer Verlag, Berlin, Heidelberg, 2008, pp. 235-242.