I.J. Intelligent Systems and Applications, 2012, 5, 23-29 Published Online May 2012 in MECS (http://www.mecs-press.org/) DOI: 10.5815/ijisa.2012.05.04
Swarm-Optimization-Based Affective Product Design Illustrated by a Mobile Phone Case-Study Koffka Khan Department of Computing and Information Technology, University of the West Indies, St. Augustine, Trinidad And Tobago (W.I.) Email:
[email protected] Ashok Sahai Department of Mathematics and Statistics, University of the West Indies, St. Augustine, Trinidad And Tobago (W.I.) Email:
[email protected]
Abstract— This paper presents a new approach of useroriented design for transforming users’ perception into product elements design. An experimental study on mobile phones is conducted to examine how product form and product design parameters affect consumer’s perception of a product. The concept of Kansei Engineering is used to extract the experimental samples as a data base for neural networks (NNs) with particle swarm optimization (PSO) analysis. The result of numerical analysis suggests that mobile phone makers need to focus on particular design parameters to attract specific target user groups, in addition to product forms. This paper demonstrates the advantage of using KE-PSO for determining the optimal combination of product design parameters. Based on the analysis, we can use KE-PSO to suggest customers’ preferences for mobile phone design attributes that would be considered optimal by various user groups of all surveyed. They can be used for improvement and development of new future products.
Index Terms— Product design, optimization, kansei engineering
I.
particle
The fitness functions in Kansei engineering are often highly multi-modal. Therefore, swarm intelligence algorithms (Kennedy and Eberhart 1995) are appropriate for these types of modeling. The first such studies applied particle swarm optimization (PSO) to analyze customers’ affective responses with regard to products, and use the results to propose relevant product design parameters. This approach will be applied in a case study of mobile phone design.
II. DESIGN OF EXPERIMENT A. Data Collection A checklist as illuminated in Figure 1 was prepared and issued to users. They were asked to answer it based on their feelings about each of the mobile phone demos. The checklist consisted of 5 semantic differential Kansei words measured in 7-point Likert scale.
swarm
INTRODUCTION
The affective product design is aimed at determining the relationships between consumers and products and to define the emotive properties that products intend to communicate through their physical attributes [4], [1], [10]. Kansei Engineering techniques support affective product design by linking the customer needs mathematically to the technical characteristics of the product [1], [10]. For mathematically connecting customer emotions mapped through Kansei words and the product properties methods like data mining [4], regression analysis, neural networks [7], evolutionary computation and fuzzy sets [9] are used.
B. Case Study Mobile phones have captured a big part of our daily life and the companies offer a great deal of options to the consumers. Besides, the relative distinctiveness of mobile phones is receiving increasing emphasis in manufacturers’ marketing strategies. Therefore, this
Copyright © 2012 MECS
I.J. Intelligent Systems and Applications, 2012, 5, 23-29
Figure 1. Appearance of the Checklist
24
Swarm-Optimization-Based Affective Product Design Illustrated by a Mobile Phone Case-Study
paper’s case study adopted the case of mobile phones to explore kansei engineering effect to be able to suggest product design properties
TABLE II.
FORM ELEMENTS EXTRACTED BY MORPHOLOGICAL ANALYSIS.
While conducting Kansei Engineering experiments, the two most crucial issues are; determining good “image word pairs” (Kansei words) and determining the “form elements” which are thought to influence the consumer’s impressions and feelings. “Image word pair”, in general, is a couple of feelings which are either opposite to or strongly different from each other [9]. In this study, “Image word pair” is a pair of words representing impressions and feelings that would be created in customers’ mind by the appearance of mobile phones. Basically by looking at a mobile phone, what would a person feel about the phone, and what variety of impressions would arise in his/her mind? Keeping these questions in mind, we had several brainstorming sessions. During these brainstorming sessions we were aware of the fact that there could be infinite number of feelings and impressions, therefore infinite number of image word pairs for a particular object. Our target was to think about as many of these feelings as possible and then extract the ones which are more likely to arise in a consumer’s mind. We finally concluded that the most appropriate image word pairs for a mobile phone might be: Cheap Expensive, Plain Elegant, Formal Sportive, Masculine Feminine, and Simple Complex. In other words, for a consumer a mobile phone would seem to be expensive, elegant, and formal and so on. These Kansei words are summarized in Table 1. TABLE I.
SEMANTIC DIFFERENTIAL KANSEI IMAGE WORD PAIRS FOR MOBILE PHONES
Possible Feelings & Impressions Cheap Plain Formal Masculine
Expensive Elegant Sportive Feminine
Simple
Complex
The next step was to determine the “form elements”. Form elements are the physical product parameters which would most likely have influence on customer’s feelings represented by the words in Table 1. A big volume of mobile phones were examined in the market and discussed about their physical parameters to come up with an ideal parameter list. The resulted physical product parameters are illustrated in Table 2: Top Shape, Length and Width Ratio of the Body, Number Buttons Arrangement, Screen Size, Thickness, and Form Factor.
Copyright © 2012 MECS
Final step was to select a set of sample mobile phones which are going to be in the checklist. This set of mobile phones should have been selected very carefully to ensure integrity and homogeneity. Integrity would be satisfied if every particular type form element in Table 2 can be found as a property of at least one of the mobile phones in our checklist. Homogeneity would be satisfied if every particular type of each form element in Table 2 is represented by the same number of representing mobile phones in the checklist. Taguchi method is the point where this desired integrity and homogeneity is certified: TABLE III.
THE OPTIMAL DISTRIBUTION OF PARAMETERS OVER SELECTED MOBILE PHONES.
1.Top 2.Length Shape Width ELEMENTS (X1) Ratio of Body (X2)
3.Number 4.Screen Buttons Size Arrangement (X4) (X3)
5.Thickness 6.Form Factor (X5) (X6)
Corresponding Mobile Phone Model
1
1
1
1
1
1
Nokia 2310
1
1
1
2
2
2
Nokia 6170
1
2
2
1
1
2
SE
Z530i
1
2
2
2
2
1
SE
K750i
2
1
2
1
2
1
Nokia 2600
2
1
2
2
1
2
Nokia 6822
2
2
1
1
2
2
SE
2
2
1
2
1
1
Nokia 6070
Type 1
Line
Type 2
Arc
Wide, Regular 2:1 Slender, Irregular 2.5:1
Types
TV Ratio =20mm
Z800i
Candy Bar Flip,Slide,Swivel
After generating Taguchi table for the form elements, we searched eight mobile phones which would exactly satisfy the features in Table 3. In Table 3, every column represents the list of form element types which I.J. Intelligent Systems and Applications, 2012, 5, 23-29
Swarm-Optimization-Based Affective Product Design Illustrated by a Mobile Phone Case-Study
should exactly belong to a one real mobile phone of our experiment. At the bottom of the table are the names of the possible types of each form element. For instance the values in the first column implies that we need to find a mobile phone which has a line top shape, length width ratio of 2/1, regular number buttons arrangement, TV ratio screen, height of less than or equal to 20 mm, and form of Candy Bar. We decided that Nokia 2310 was the one satisfying all the criteria. The rest of the best fitting appearances are also listed in Table 3. III. A PARTICLE SWARM OPTIMIZATION–BASED APPROACH FOR AFFECTIVE PRODUCT DESIGN A. Particle Swarm Optimization The particle swarm optimization algorithm is a stochastic optimization algorithm which maintains a swarm of candidate solutions, referred to as particles, they are members in the population, have their own positions and velocities, and they fly around the problem space in the swarms searching for the position of optima. PSO is initialized with a group of random particles and then searches for optima by updating generations. In every iteration, each particle is updated by following two "best" values. The first one is the best solution it has achieved so far. This value is called pbest . Another "best" value tracked by the particle swarm optimizer is the best value, obtained so far by any particle in the population. This best value is a global best and called gbest . After finding the two best values, the particle updates its velocity and positions with following formulas.
vidk 1 w vidk c1 rand () ( pid xidk )
(1)
c2 rand () ( pgd xidk )
xidk 1 xidk vidk 1
(2)
where d = 1, 2, . . .,N; i = 1, 2, . . . , M, and M is the size of the swarm; w is called inertia weight; c1, c2 are two positive constants, called cognitive and social parameter respectively; rand() are random numbers, uniformly distributed in (0, 1), and k = 1, 2, . . ., determines the iteration number ; p is the position at which the particle id
has achieved its best fitness so far, and p
gd
is the
position at which the best global fitness has been achieved so far; v is the ith particle's new velocity at the k 1
id
kth iteration; x
k 1 id
is the ith particle's next position, based
on its previous position and new velocity at the kth iteration. The particles find the optimal solution by cooperation and competition among the particles. In traditional PSO model, each particle of the particles updates its next velocity and position only according to the velocity and position at the previous time, as well as individual best position and the best position of groups, during the searching process, Copyright © 2012 MECS
25
because it lacks of collaboration and information sharing with other particles, most particles contact quickly a certain specific position. If it is a local optimum, then it is not easy for the particles escape from it. In such circumstances, in order to improve the speed and success rate of convergence, the centroid of particle swarm is introduced in the standard PSO model to improve global optimum efficiency and accuracy of algorithm through enhancing inter-particle collaboration and information sharing capabilities, then a new PSO model is proposed. Let pi be the best position of the ith particle then the centroid of particle swarm at the kth iteration can be defined as follow k
p =
1 M
M
p . i
(3)
i=1
Let pd xid be the distance of the particle’s k
k
current location and the centroid, so the formula (1) can be updated by vidk 1 w vidk c1 rand () ( pid xidk ) (4)
c2 rand () ( pgd xidk ) c3 rand () ( pdk xidk ).
where c3 is a positive constant similar to c1 and c2. Formula (4) and (2) are keeping track of each particle that is not only interrelated with individual best position and the best position of groups, but also with the centroid of the whole particle swarm, that is interrelated with individual best position of other particles too. So the collaboration and information sharing capabilities are enhanced greatly, the computing performance of algorithm is improved effectively. During the searching process, as the iterations go on, each particle will converge to the local or global optimum. At same time, the optimal location of each particle, the globally optimal location of all particles, each particle's current position closes to the same position, and each particle's velocity closes quickly to 0. All the particles tend to equilibrium. In this case, according to the gathering degree and the steady degree of particle swarm [11], it can be determined whether partial or all the particles of current group will be mutated to escape from local solution and obtain the global optimum. The algorithm can be summarized as follows: Step1 Initialize position and velocity of all the particles randomly in the N dimension space. Step2 Evaluate the fitness value of each particle, and update the global optimum position. Step3 According to changing of the gathering degree and the steady degree of particle swarm, determine whether all the particles are re-initialized or not. Step4 Determine the individual best fitness value. Compare the p of every individual with its current i
fitness value. If the current fitness value is better, assign the current fitness value to p . i
I.J. Intelligent Systems and Applications, 2012, 5, 23-29
26
Swarm-Optimization-Based Affective Product Design Illustrated by a Mobile Phone Case-Study
Step5 Determine the current best fitness value in the entire population. If the current best fitness value is better than the p g , assign the current best fitness value to pg .
Step6 For each particle, update particle velocity according formula (4), Update particle position according formula (2). Step7 Repeat Step2 - 6 until a stop criterion is satisfied or a predefined number of iterations are completed. B. Applied to Product Design The following steps of affective product design are proposed: 1. Determine mobile phone design parameters 2. Gather exemplars of existing mobile phones 3. Determine Kansei words 4. Gather data from mobile phone customers 5. Link Kansei hierarchy with mobile phone design properties and building of model by particle swarmoptimization. 6. Propose mobile phone design properties. 1
2
3
4
Determine mobile phone design parameters
Gather exemplars of existing mobile phones
Determine Kansei words
Gather data from mobile phone customers
5 Link Kansei hierarchy with mobile phone design properties and building of model Ykansei = f(property) by particle swarm optimization
6
Propose mobile phone design properties
Figure 2.Affective mobile phone design steps
Data is collected by a questionnaire that is completed by potential clients of the mobile phone under consideration. The questionnaire contained a set of feelings-based items. Each respondent is provided with multiple specimens of the mobile phone under consideration and for each, he/she is required to respond Copyright © 2012 MECS
to all items on the questionnaire. Data consisted of the participant’s response to the following Kansei Words on a [1, 7] rating scale: Q1: Cheap-Expensive Q2: Plain-Elegant Q3: Formal-Sportive Q4: Masculine-Feminine Q5: Simple-Complex. In order to evaluate the words individually, each question value [1, 7] was transformed to the binary scale [0, 1], for example, question one (Q1): Q1 [1, 7] Cheap
[1, 0]
Expensive
[0, 1]
This transformation would capture the participant’s response regarding the Cheap-Expensive Kansei word pair. This numeric scaling would be done for all words, resulting in five binary numeric input pair values ([0, 1]). This transformation would capture the participant’s response regarding the Cheap-Expensive Kansei word pair. This numeric scaling would be done for all words, resulting in five binary numeric input pair values ([0, 1]). Particle swarm optimization (PSO) is an algorithm that is inspired by social interactions of insects, animals, and even human beings [6], 0. Given the problem of finding a minimiser of the optimization function , (where R is the set of real numbers) the PSO algorithm works on a set of candidate solutions called particles, “flying” them through the solution space for a certain number of generations until a solution is found, or time constraints force the termination of the algorithm. Each particle ( ) consists of a position vector , a velocity vector , a previous best position , a fitness value and a previous best fitness value . The set of particles used by the algorithm called population 𝑃𝑂𝑃 𝑃0 … 𝑃𝑚−1 is represented by a vector of particles. They exchange information with others in the population, and it is thus that evolution of the candidate solutions takes place. The manner in which information is exchanged between particles is constrained by neighborhoods. Each particle P has a neighbourhood, which is a subset of the population, 𝑁 𝑃 ⊆ 𝑃𝑂𝑃 and each element of 𝑁 𝑃 is called a neighbor of 𝑃 . The neighbors in 𝑁 𝑃 are not determined based on their positions in the search space; they can be completely arbitrary. On each iteration of the algorithm, for each particle, a new velocity vector is computed by among other things, consulting with neighbors to determine their best positions encountered thus far, as well as using the particle’s own previous best experience. And then the position vector is updated by adding the newly calculated velocity vector to the current position. This velocity update is a very important aspect of the algorithm. Modified versions I.J. Intelligent Systems and Applications, 2012, 5, 23-29
Swarm-Optimization-Based Affective Product Design Illustrated by a Mobile Phone Case-Study
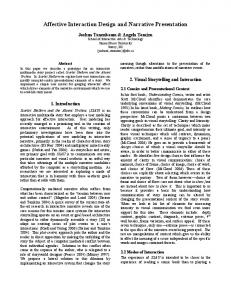
are common [2], introduced the constriction factor with a typical value used in experimental work is 0.729. There were six feature pairs regarding the mobile phones, of either type 1 or type 2 (see Table 3). In this study the design parameter paired inputs to the neural network consisting of a single binary value. This input flag was indicative of the presence or absence of the design parameter for the particular mobile phone under consideration. The neural network diagram below shows the configuration for the Nokia 2310 phone with the Plain-Elegant Kansei Word pair being the target optimization variable under consideration.
Q1: [1,0]
Q1: [0,1]
Cheap Expensive
MasculineFeminine
FormalSportive
SimpleComplex
Q3: [1,0]
Q3: [0,1]
Q4: [1,0]
Q4: [0,1]
Formal
Sportive
Masc
Femi
Top Shape
Body Ratio
Q5: [1,0]
Q5: [0,1]
[0,1]
[0,1]
[0,1]
Simple
Complex
Line
Arc
Wide
Screen Size
Buttons Arrange
[0,1]
[0,1]
[0,1]
Slender Regular Irregular
Form Factor
Thickness
[0,1]
[0,1]
[0,1]
[0,1]
[0,1]
[0,1]
TV Ratio
Movie Ratio
= 20mm
Candy Bar
Flip/ Slide/ Swivel
Figure 3.CELL-KE-PSO neural network structure for a PlainElegant Kansei Word pair
Figure 2 shows the answer to the question of what design parameters would be considered if elegant was the optimization target variable (output). For the question pertaining to the other Kansei Words the neural networks inputs and target would have to be adjusted accordingly. The KE-PSO input layer weight values would be used to judge the importance of the relevant feature when evaluating the desired Kansei Word. The optimization targets for the respective Kansei Word pairs while running the CELL-KE-PSO algorithm for the mobile phones data set in this study were: 1. Elegant (Plain-Elegant) 2. Sportive (Formal-Sportive) 3. Masculine (Masculine-Feminine) 4. Feminine (Masculine-Feminine) 5. Cheap (Cheap-Expensive) For example, the Plain-Elegant Kansei Word pair optimization target can be expressed as: (5)
Where P-E is plain or elegant, PhoneModels are those used in this survey, DesignParameters are those applying to the respective model. The linear design model was as defined as follows: D
i
KE-PSO target function. The PSOt [1] package was used for the neural network back-propagation algorithm. The rate of convergence for the Cleric Type 1 PSO model is shown on Figure 4.
Q2: PlainElegant
Output
CheapExpensive
27
w0 + w1
1
+ ⋯ + w19
19
6
Where i is the optimization target, w1 the relevant weights and ϵ[ 9]. Manufacturers of cellular phones would be interested in the following question, “What design parameters do customers consider in mobile phones to create the impression of elegance?” The other target Kansei words can be substituted according to the Copyright © 2012 MECS
Figure 4.CELL-KE-PSO training
The algorithm achieved a satisfactory target value after roughly 450 iterations. The prediction of the KEPSO model was based on the average relative mean squared error (RMSE) induced by the set of weights over the entire sample responses collected for all the mobile phones in the survey. The result of the KE-PSO optimization pD and interpreted weights of the best particle suggest the choices for the design parameters influencing the target Kansei emotive response(s) the most. The PSO is subject to some stochastic instability inasmuch as it uses (uniform) pseudo-random numbers in its optimization algorithm. A scale-invariant/ dimensionless measure of this stochastic instability is provided by the “coefficient of variation” (C.V. = standard deviation / mean) of the relative mean squared errors (RMSE) over the 1000 runs of PSO. The optimization criterion RMSE (unlike MSE usually employed in similar papers in the literature) is also a scale-invariant/dimensionless measure of the solution at hand. This concept of RMSE is frequently applied in the analogous area of statistical estimation to determine the most desirable robust method amongst the ones competing [3].
IV. ANALYSIS OF RESULTS Based on the KE-PSO final weightings (cf. Table 4) and input parameter values the best design parameters for each phone type were discovered. The attributes that were selected to be most popular from this set to users were cost (expensive being a deterrent), appearance (elegant being a positive factor), complexity (users being attracted to phone with more features) and size (slender phones being more sought after). The least important design parameters were sex (man/woman), ratio
I.J. Intelligent Systems and Applications, 2012, 5, 23-29
28
Swarm-Optimization-Based Affective Product Design Illustrated by a Mobile Phone Case-Study
(TV/Movie) and screen factor (candy bar versus flip/slide/swivel). These results were to be expected as the user demographic was mainly within the age group 18-23 years, so cost, appearance, complexity and size would be key element those users would look for in choosing a mobile phone. Gender and sportiness were factors that this group would ignore. Strangely, it would seem that screen factor was a factor lowly considered, probably as these users were looking for more graphic and screen display features instead. TABLE IV.
# Pairs
OPTIMIZATION BASED RESULT SUBSETS (CELLKE-PSO WEIGHTINGS)
into account customer perception of product design parameters. A model evolved by the particle swarm predicts the desired values of product design properties. Depending on these values relevant product designs can be proposed. For illustrating and validating the KE-PSO-based approach a case study of mobile phones was carried out. Relevant Kansei words, eleven product design elements and sample mobiles were defined. Based on data gathered and using the approach, a relevant phone design was determined. The proposed approach can be used for selecting optimal product design parameters for various selected products. Some advantages of the approach proposed are: • Particle swarm optimization is a very flexible evolutionary computation method that can be adapted to different optimization tasks and as was done in this paper, it can be re-used in different phases to help solve a problem. • Providing a standard method of aggregating Kansei words based on numeric weights, without having to consider the semantics of the words themselves. This work is preliminary and there is room for further developments, such as: • PSO neighborhood and dynamism parameters such as the number of nodes, the uniform-out degree and the dynamism probability could be investigated with a view to improving the optimization of the approach. • Emotional PSOs [3], which presents a modification of the PSO algorithm introducing some psychology factor of emotion into the algorithm may be considered for use in this application.
Elega nt
Sporti ve
Mascu line
Femin ine
Chea p
Inputs
Final Weight
Final Weight
Final Weight
Final Weight
Final Weight
Cheap
0.40
0.42
0.48
0.40
-
Expensive
0.60
0.58
0.52
0.60
-
Plain
-
0.63
0.59
0.47
0.54
Elegant
-
0.37
0.41
0.53
0.46
Formal
0.53
-
0.25
0.89
0.48
Sportive
0.47
-
0.75
0.11
0.52
Man
0.37
0.64
-
-
0.57
Woman
0.63
0.36
-
-
0.43
Simple
0.42
0.58
0.53
0.35
0.67
Complex
0.58
0.42
0.47
0.65
0.33
Line
0.03
0.50
0.57
0.26
0.53
Arc
0.97
0.50
0.43
0.74
0.47
Wide
0.42
0.70
0.66
0.21
0.58
REFERENCES
Slender
0.58
0.30
0.34
0.79
0.42
Regular
0.21
0.46
0.81
0.38
0.57
Irregular
0.79
0.54
0.19
0.62
0.43
TV Ratio
0.43
0.57
0.59
0.30
0.80
Movie Ratio
0.57
0.43
0.41
0.70
0.20
= 20mm
0.34
0.62
0.77
0.44
0.58
Candy Bar
0.34
0.25
0.54
0.43
0.66
Flip/Slide/ Swivel
0.66
0.75
0.46
0.57
0.34
[1] Birge, B., PSOt - A Particle Swarm Optimization Toolbox for Use With Matlab. IEEE 2003 Swarm Intelligence Symposium, 2003, pp. 182-186. [2] Clerc M. and Kennedy J., The Particle Swarm - Explosion, Stability, and Convergence in a Multidimensional Complex Space. IEEE Transactions on Evolutionary Computation, 2002, 6(1), 58-73. [3] Ge Y. and Rubo Z., An Emotional Particle Swarm Optimization Algorithm. Springer Berlin / Heidelberg, 2005, pp. 553-561. [4] Jiao J., Zhang Y., and Helander M., A Kansei mining system for affective design, Expert Systems with Applications. Expert Systems with Applications Vol. 30, No. 4, 2006, pp. 658-673. [5] Kennedy J. and Eberhart R., Particle swarm optimization. In Proceedings of the IEEE International Conference on Neural Networks, IEEE Press, 1995, pp.1942-1948. [6] Kennedy J., and Eberhart R., An Improved Particle Swarm Optimization for Evolving Feedforward Artificial Neural Networks. Kluwer Academic Publishers, 1995, pp.217-231. [7] Lai H., Lin Y., and Yeh C., Form design of product image using grey relational analysis and neural network models. Computers & Operations Research, Vol. 32, No. 10, 2005, pp. 2689-2711.
1
2
3
4
5
6
7
8
9
10
11
V. CONCLUSION A particle-swarm-optimization-neural-network(KEPSO)-based approach for emotive product design was proposed. The most popular swarm intelligence method, the particle swarm optimization algorithm, was used to model the relationship between Kansei words and product design properties. It is a simple, feasible and versatile approach determining the combination of product properties that could results in designs taking Copyright © 2012 MECS
I.J. Intelligent Systems and Applications, 2012, 5, 23-29
Swarm-Optimization-Based Affective Product Design Illustrated by a Mobile Phone Case-Study
[8] Lee S.H., Harada A. and P. J. Stappers P.J., Pleasure with Products: Design based on Kansei. Taylor and Francis, 2000, pp. 219-230. [9] Lin Y., Lai H. and Yeh C., Consumer-oriented product form design based on fuzzy logic: A case study of mobile phones. Int. J. of Industrial Ergonomics, Vol. 37, No. 6, 2007, pp. 531-543. [10] Nagamachi M., Kansei engineering as a powerful consumer-oriented technology for product development. Applied Ergonomics, Vol. 33, No. 3, 2002, pp. 289-294. [11] Su Rijian, Kong Li, Song Shengli et al. A new ridgelet neural network training algorithm based on improved particle swarm optimization. Proceedings - Third International Conference on Natural Computation, ICNC 2007, 2007, v3, pp.411-415.
29
Statistics at University of Swaziland (Southern Africa) during the period: July 1993- June 2003. He worked as a Guest Scholar @ PharmacoEconomic Research Centre; University of Arizona, TUCSON during the period from July 2003 to October 2003 and as Visiting Professor @ Hyderabad; INDIA during December 2003 to January 2006 in ICFAI Tech. University, Medchel Rd.; in Aurora School of Management at Chikkadpally; and in St. Ann’s P.G. (Management) College For Women at Mallapur.
Mr. Koffka Khan was born in San Fernando, Trinidad and Tobago in 1978. He received the B.Sc. and M.Sc. degrees from University of the West Indies, in 2002 and 2008, respectively. He is working presently at The University of The West Indies; St. Augustine Campus (TRINIDAD & TOBAGO) as a Tutor in Computer Science in the Department of Computing and Information Technology (Faculty of Science & Agriculture) since September 2006. Mr. Khan started his teaching-n-research career as a Demonstrator in Computer Science at the University of The West Indies at the Department of Mathematics and Computer Science. He has up-to-date, published seven research papers in journals of international repute & in the proceedings of international conferences.
Dr. Ashok Sahai is working presently at The University of The West Indies; St. Augustine Campus (TRINIDAD & TOBAGO) as a Professor of Statistics in the Department of Mathematics & Computer Science(Faculty of Science & Agriculture) since February 2006. Dr. Sahai started his teaching-n-research career as a Lecturer in Statistics Department at Lucknow University (INDIA) in July 1966, and continued thereat till April 1980. He has, upto-date, published more than one hundred research papers in journals of international repute & in the proceedings of international conferences. He worked as Reader in Statistics and as Professor of Statistics in the Department of Mathematics at University of Roorkee (Now IIT Roorkee) during the period: April 1980- July 1995. Prof. Sahai had also worked as an Assoc. Professor of Statistics at University of Dar-Es-Salaam; TANZANIA (East Africa) during the period: July 1982- June 1984, and as a Professor of Copyright © 2012 MECS
I.J. Intelligent Systems and Applications, 2012, 5, 23-29