These cycles are the time series analysis units and have sev- .... plied by the subject S1 to the rear wheel of a Manual Wheelchair for a rectilinear movement.
Symbolic representation of cyclic time series: application to biomechanics
Vanel Steve SIYOU FOTSO Clermont University, Blaise Pascal University, CNRS, UMR 6158, LIMOS, F-63173 AUBIERE
SIYOU @ ISIMA . FR
Engelbert MEPHU-NGUIFO Clermont University, Blaise Pascal University, CNRS, UMR 6158, LIMOS, F-63173 AUBIERE
MEPHU @ ISIMA . FR
Philippe VASLIN Clermont University,Blaise Pascal University, CNRS, UMR 6158, LIMOS, F-63173 AUBIERE
VASLIN @ ISIMA . FR
Abstract The analysis of cyclic time series from biomechanics is based on the comparison of the properties of their cycles. As usual algorithms of time series classification ignore this particularity, we propose a symbolic representation of cyclic time series based on the properties of cycles, named SAX-P. The resulting character strings can be compared using the Dynamic Time Warping distance. The application of SAX-P to propulsive moments of three subjects (S1, S2, S3) moving in Manual Wheelchair highlight the asymmetry of their propulsion. The symbolic representation SAX-P facilitates the reading of the cyclic time series and the clinical interpretation of the classification results. Keywords: cyclic time series, symbolic representation, SAX, Biomechanics, Manual Wheelchair.
1. Introduction Generally, during his locomotion, the human being performs cyclic movements (eg walking, running, swimming, cycling). The biomechanical analysis of these movements is performed with various measuring instruments (eg force and acceleration sensors, kinematic analysis systems) that enable continuous recording over long periods of many kinematic and dynamic parameters. These recordings produce long time series composed of many cycles or patterns, representative of the movements made and effort produced by the subject during his displacement (Figure 2). Proceedings of the 32 nd International Conference on Machine Learning, Lille, France, 2015. JMLR: W&CP volume 37. Copyright 2015 by the author(s).
These cycles are the time series analysis units and have several characteristic properties such as the minimum value, the area under the cycle (Vegter et al., 2014). For comparing time series, several previous studies suggested to break them into small segments and then to compare the properties of their segments. A segment of a time series is a sequence of consecutive values belonging to it (Abonyi et al., 2003). (Keogh et al., 2001) proposed replacing each segment of a time series X = x1 , x2 , · · · , xn by its mean values; P( Nn )i x ¯i = N n (i−1)+1 xj transforming the time series, j= N n which is a sequence of values, in the suite of the means of ¯ =x its N segments X ¯1 ,¯x2 , · · · , x ¯N This method is known as Piecewise Aggregate Approximation (PAA). The time series C and Q are then compared by calculating the dis¯ of the means of their tance DR between the suite C¯ and Q segments : v u N un X t ¯ ¯ (¯ ci − q¯i )2 DR(C, Q) = N i=1
(1)
The main objective of PAA was to reduce the length of the time series. However, as it computes the segments means, it also allows us to compare two time series C and Q from the properties of their segments (Equation 1 ). (Lin et al., 2003) were based on the PAA method to provide a symbolic representation of time series called Symbolic Aggregate Approximation (SAX). The objective of SAX is to assign a letter to each segment. To do this, the domain of the values of the time series is divided into intervals so that every point of the temporal series has approximately the same probability to belong to an interval and a letter is associated with each of these intervals. Then each segment of the time series is associated with the letter of the interval to which belongs its average. With SAX, the distance ˆ and Cˆ of length N M IN DIST between two strings Q
Symbolic representation of cyclic time series: application to biomechanics
is calculated from the distance between the borders of the intervals represented by each character in the string (Equation 2).
v u N u X ˆ C) ˆ =tn M IN DIST (Q, (dist(ˆ qi , cˆi ))2 N i=1
(2)
qˆi et cˆi are characters and dist() is the distance between the borders of the intervals which represent these characters (Lin et al., 2003). However, two segments with very different shapes can have the same average and be represented by the same letter: the mean is not enough to define a segment. In order to solve this problem, (Lkhagva & Kawagoe, 2006) proposed the ESAX model that considers three properties for each segment: its mean, its minimum and maximum. Thereafter, (Sun et al., 2014) proposed the SAX-TD model that takes into account two properties for each segment: its mean and trend. They then adjust the distance used by the SAX method for it to take into account the trend. Both methods provide better results than the SAX method (Sun et al., 2014). However, they have the disadvantage of increasing the number of symbols required to represent the time series. Indeed, the method ESAX triple the size of the representation of a time series provided by the SAX method, while the SAX-TD method the double. In addition, the previous four methods have two major drawbacks: they consider fixed-size segments, while the cycles are variable-sized segments (Figure 2), and they do not take into account the characteristic properties of cycles such as the duration and the surface under a cycle. Our goal is to provide a symbolic representation that takes into account several properties for each cycle, but without increasing the number of symbols used for the representation. The symbolic representations obtained have another advantage; they allow to use a large number algorithms available for sequence analysis like novelty detection (finding unusual shapes or subsequences), motif discovery (finding repeated shapes or subsequences) (Begum & Keogh, 2014), clustering, classification, indexing and also some interesting algorithms for text processing or the bioinformatics community (Aach & Church, 2001) (Papapetrou et al., 2011) (Dietterich, 2002).
2. Several parameters (properties) are computed on each segment: cycle time, push time, mean, median, standard deviation, minimum and maximum values, and the area under the time series curve. As all these parameters have different units, they must be normalized (i.e. centred and reduced); 3. Segments are then gathered in clusters using a classification algorithm (Esling & Agon, 2012) and each cluster is named by a capital letter; 4. Each segment is replaced by the letter of the cluster to which it belongs, so that the initial cyclic time series is then represented by a string of characters; The distance between two strings, which may have different numbers of characters, is computed using Dynamic Time Warping (Petitjean et al., 2014) which is known as the best distance measure for several domains (Ding et al., 2008). The distance between two characters is the euclidian distance between the centers of the classes represented by those characters. Figure 1 illustrates the operation of SAX-P. Unlike SAX, ESAX and SAX-TD methods that require to fix the length of segments to consider when building the symbolic representation of a time series, SAX-P considers the cycles which constitute basic unit of analysis of time series recorded during cyclic movements and also allows taking into account several characteristic features for each cycle. Figure 2 presents the symbolic representations obtained with the SAX method (in small letters) and SAX-P (in capital letters). It illustrates that SAX-P unlike SAX considers cycles of the time series during the construction of the symbolic representation.
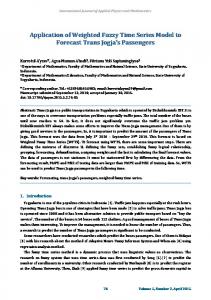
Figure 1. A cyclic time series is segmented in 5 propulsion cycles (X1, X2, X3, X4, X5). For each cycle, a set of properties was calculated and cycles with similar properties are gathered in the same class (A or B). The original time series is thus transformed into a string (here: AAABB).
2. SAX-P The method SAX-P is based on SAX and works as follows: 1. A cyclic time series is split in successive segments using a threshold for identifying the beginning and the end of cycles, which have variable durations;
3. Application to manual wheelchair locomotion This method has been applied to the axial moment (Mz) measured by both right and left rear wheels of an instru-
Symbolic representation of cyclic time series: application to biomechanics
Figure 2. Example of cyclic time series: propulsive moment applied by the subject S1 to the rear wheel of a Manual Wheelchair for a rectilinear movement. Vertical bars delimit the propulsion cycles (segments) identified during this run, and the capital letter above each cycle indicates the cluster to which it belongs. Applying SAX to the propulsive moment divide the time series into 10 segments of equal size (lowercase letter) regardless of propulsion cycles. The area under the cycle, the cycle time and the pushed time are not taken into account by SAX.
Cluster Nb of cycles Cycle time (s) Push time (s) Mz Min (Nm) Mz Max (Nm) Mean (Nm) Median (Nm) IRQ (Nm) SD (Nm) Area (Nm.s)
A 18 1.2 0.6 -22.3 0.1 13.6 -16.1 12.4 7.1 -7.1
B 36 1.0 0.3 -17.4 0.1 -8.1 -10.8 10.7 5.6 -2.3
C 59 1.0 0.4 -11.4 0.1 -6.2 -7.4 6.0 3.4 -2.2
D 18 1.7 1.0 -8.7 0.7 -3.0 -4.2 4.3 2.6 -1.8
E 104 0.8 0.3 -6.4 0.1 -3.3 -3.9 3.1 1.8 -1.0
Table 1. Average vectors of the properties of classes (A, B, C, D, E) used for the symbolic representation of the axial moment (Mz) SAX-P takes into account the surface under the push, the timepush and the time-cycle.
mented Manual WheelChair (MWC) during five there and back 10-m linear displacements between two cones performed by three handicapped subjects. We group propulsion cycles into 5 clusters (Table 1) and we obtained a symbolic representation for Mz (Table 2). An important task of analyzing manual wheelchair locomotion is the comparison of its rolling movement. Experts from the fields seek to compare two movements simultaneously taking into account several criteria or properties. Applying SAX-P method to the time series of axial moments exerted by a wheelchair user on the right and left wheels greatly facilitates the comparaison, the analysis and the interpretation of these time series: • At first sight (Table 2), it immediately appears that during their second 10-m run the three subjects anal-
Subject Push 1 2 3 4 5 6 7 8 9 10 11 12 13 DTW
S1 Right C B B B B C B E
268
Left A B B B B B C
S2 Right C E C C C E E E C E C C 354
Left D E E E D C E E C E E E E
S3 Right E D C E E
Left D E E E E D E
44
Table 2. Strings of characters obtained with SAX-P method on times series of axial moments applied by the three subjects on right and left rear wheels of an instrumented MWC during their second 10-m run.
ysed here did not exert the same number of pushes for moving a MWC on the same distance (S1: 7-8; S2: 12-13; S3: 5-7); • It is also obvious that each subject did not exert the same number of pushes on both rear wheels. Moreover, although right and left pushes exerted by one subject globally belong to the same clusters, the total distance between all these pushes can be more (S2: 354) or less (S3: 44) high. Both these observations clearly demonstrate that the three subjects did not propel their MWC symmetrically during this particular exercise. The first results of the evalutation of SAX-P on a classification task are presented on the web page (Val)
4. Conclusion In this ongoing work, we proposed a method of symbolic representation of cyclic time series called SAX-P. This method is used to represent a cyclic time series as a string, each character representing a class of the cycles of the considered time series. The character strings obtained were then compared using the Dynamic Time Warping distance. The SAX-P model has been applied to propulsive moments measured during the movements in a straight line by three subjects in MWC. The preliminary results obtained have particularly showed that these subjects had different modes of propulsion and propulsion cycles of the same subject were not symmetrical. Ongoing research is devoted on applying this new symbolic representation to a supervised classification of cyclic time-series in biomechanics.
Symbolic representation of cyclic time series: application to biomechanics
References Empirical validation of sax-p. URL http://fc. isima.fr/˜siyou/resultats.php. Aach, J. and Church, G. M. Aligning gene expression time series with time warping algorithms. Bioinformatics, 17(6):495–508, June 2001. ISSN 13674803. doi: 10.1093/bioinformatics/17.6.495. URL http://bioinformatics.oxfordjournals. org/cgi/content/long/17/6/495. Abonyi, Janos, Feil, Balazs, Nemeth, Sandor, and Arva, Peter. Fuzzy clustering based segmentation of timeseries. Advances in Intelligent Data Analysis V, pp. 275– 285, 2003. URL http://link.springer.com/ chapter/10.1007/978-3-540-45231-7_26. Begum, Nurjahan and Keogh, Eamonn. Rare time series motif discovery from unbounded streams. Proceedings of the VLDB Endowment, 8(2):149–160, October 2014. ISSN 2150-8097. URL http://dl.acm. org/citation.cfm?id=2735471.2735476. Dietterich, Thomas G. Machine Learning for Sequential Data: A Review. Proceedings of the Joint IAPR International Workshop on Structural, Syntactic, and Statistical Pattern Recognition, pp. 16–30, August 2002. ISSN 87567016. doi: 10.1146/annurev.cs.04.060190. 001351. URL http://dl.acm.org/citation. cfm?id=645890.671269. Ding, Hui, Trajcevski, Goce, Scheuermann, Peter, Wang, Xiaoyue, and Keogh, Eamonn. Querying and mining of time series data. Proceedings of the VLDB Endowment, 1(2):1542–1552, August 2008. ISSN 21508097. doi: 10.14778/1454159.1454226. URL http://dl.acm. org/citation.cfm?id=1454159.1454226. Esling, Philippe and Agon, Carlos. Time-series data mining. ACM Computing Surveys (CSUR), 45(1):1–34, 2012. ISSN 03600300. doi: 10.1145/2379776.2379788. URL http://dl. acm.org/citation.cfm?doid=2379776. 2379788$\delimiter"026E30F$nhttp: //dl.acm.org/citation.cfm?id=2379788. Keogh, Eamonn, Chakrabarti, Kaushik, Pazzani, Michael, and Mehrotra, Sharad. Dimensionality Reduction for Fast Similarity Search in Large Time Series Databases. Knowledge and Information Systems, 3(January):263– 286, 2001. ISSN 0219-1377. doi: 10.1007/PL00011669. Lin, Jessica, Keogh, Eamonn, Lonardi, Stefano, and Chiu, Bill. A symbolic representation of time series, with implications for streaming algorithms. Proceedings of the 8th ACM SIGMOD workshop on Re-
search issues in data mining and knowledge discovery - DMKD ’03, pp. 2, 2003. doi: 10.1145/ 882085.882086. URL http://portal.acm.org/ citation.cfm?doid=882082.882086. Lkhagva, B. and Kawagoe, K. New Time Series Data Representation ESAX for Financial Applications. In 22nd International Conference on Data Engineering Workshops (ICDEW’06), pp. x115–x115. IEEE, April 2006. ISBN 0-7695-25717. doi: 10.1109/ICDEW.2006.99. URL http: //www.computer.org/csdl/proceedings/ icdew/2006/2571/00/2571x115-abs.html. Papapetrou, Panagiotis, Athitsos, Vassilis, Potamias, Michalis, Kollios, George, and Gunopulos, Dimitrios. Embedding-based subsequence matching in time-series databases. ACM Transactions on Database Systems, 36(3):1–39, August 2011. ISSN 03625915. doi: 10.1145/2000824.2000827. URL http://dl.acm. org/citation.cfm?id=2000824.2000827. Petitjean, Franc¸ois Francois, Forestier, Germain, Webb, Geoffrey I., Nicholson, Ann E., Chen, Yanping, and Keogh, Eamonn. Dynamic Time Warping Averaging of Time Series Allows Faster and More Accurate Classification. In 2014 IEEE International Conference on Data Mining, pp. 470–479. IEEE, December 2014. ISBN 978-1-4799-4302-9. doi: 10.1109/ICDM.2014.27. URL http://ieeexplore.ieee.org/lpdocs/ epic03/wrapper.htm?arnumber=7023364. Sun, Youqiang, Li, Jiuyong, Liu, Jixue, Sun, Bingyu, and Chow, Christopher. An improvement of symbolic aggregate approximation distance measure for time series. Neurocomputing, 138:189–198, August 2014. ISSN 09252312. doi: 10.1016/j.neucom.2014. 01.045. URL http://linkinghub.elsevier. com/retrieve/pii/S0925231214002872. Vegter, Riemer J K, Lamoth, Claudine J, de Groot, Sonja, Veeger, Dirkjan H E J, and van der Woude, Lucas H V. Inter-individual differences in the initial 80 minutes of motor learning of handrim wheelchair propulsion. PloS one, 9(2):e89729, January 2014. ISSN 1932-6203. doi: 10.1371/journal.pone.0089729. URL http://dx. plos.org/10.1371/journal.pone.0089729.