Synaptic activity-responsive element in the Arc/Arg3.1 promoter essential for synapse-to-nucleus signaling in activated neurons Takashi Kawashimaa,1, Hiroyuki Okunoa,1,2, Mio Nonakaa, Aki Adachi-Morishimaa, Nan Kyoa, Michiko Okamuraa, Sayaka Takemoto-Kimuraa, Paul F. Worleyb, and Haruhiko Bitoa,c,2 aDepartment
of Neurochemistry, Graduate School of Medicine, University of Tokyo, Bunkyo-ku, Tokyo 113-0033, Japan; cCREST-JST, Kawaguchi, Saitama 332-0012, Japan; and bDepartment of Neuroscience, Johns Hopkins University School of Medicine, Baltimore, MD 21205 Edited by Yoshito Kaziro, Kyoto University, Kyoto, Japan, and approved November 17, 2008 (received for review July 14, 2008)
The neuronal immediate early gene Arc/Arg-3.1 is widely used as one of the most reliable molecular markers for intense synaptic activity in vivo. However, the cis-acting elements responsible for such stringent activity dependence have not been firmly identified. Here we combined luciferase reporter assays in cultured cortical neurons and comparative genome mapping to identify the critical synaptic activityresponsive elements (SARE) of the Arc/Arg-3.1 gene. A major SARE was found as a unique ⬇100-bp element located at >5 kb upstream of the Arc/Arg-3.1 transcription initiation site in the mouse genome. This single element, when positioned immediately upstream of a minimal promoter, was necessary and sufficient to replicate crucial properties of endogenous Arc/Arg-3.1’s transcriptional regulation, including rapid onset of transcription triggered by synaptic activity and low basal expression during synaptic inactivity. We identified the major determinants of SARE as a unique cluster of neuronal activitydependent cis-regulatory elements consisting of closely localized binding sites for CREB, MEF2, and SRF. Consistently, a SARE reporter could readily trace and mark an ensemble of cells that have experienced intense activity in the recent past in vivo. Taken together, our work uncovers a novel transcriptional mechanism by which a critical 100-bp element, SARE, mediates a predominant component of the synapse-to-nucleus signaling in ensembles of Arc/Arg-3.1-positive activated neurons. immediate-early genes 兩 MEF2 兩 SRF 兩 calcium 兩 CREB
F
ine tuning of gene expression and protein translation in mature neurons is of vital importance to brain function (1). Aberrance of adaptive responses such as long-term memory or late-phase synaptic plasticity has indeed been the hallmark of several genetically engineered mouse mutants in which the expression or the function of key transcription factors have been altered (2, 3). Thus it appears that the supply of neuronal proteins must be tightly matched to the cellular demand at any given time, to maintain proper neuronal circuit function. One critical determinant of neuronal gene expression is the neuron’s own activity. Dramatic changes in gene expression have been reported upon robust reorganization of sensory information processing (such as during critical period plasticity of the visual cortex), or through characteristic cognitive processes (such as establishment of long-term memory) (4–6). Barrages of synaptic activity that alters synaptic strength can directly up- or downregulate various constituents of the synaptic machinery and many signaling molecules (7–9). Studies of the transcriptional activation mechanisms leading to upregulation of the immediate early genes c-fos, zif268, and of the brain-derived neurotrophic factor (BDNF) indicated that transcription factors such as the Ca2⫹/cAMP-response element binding protein (CREB) and the serum response factor (SRF) may play a privileged role as key neuronal activity sensors in the nucleus (10–12). An activity-regulated cytoskeleton-associated protein (Arc/Arg3.1) has recently emerged as an attractive candidate effector molecule/immediate early gene product (13, 14), whose induction 316 –321 兩 PNAS 兩 January 6, 2009 兩 vol. 106 兩 no. 1
may correlate, at least in part, with the induced synaptic alteration phenotype (15–18). Furthermore, Arc/Arg-3.1 transcription is induced extremely rapidly and Arc/Arg-3.1 mRNA detection, by fluorescence in situ hybridization, has now been validated as a reliable trace of intense synaptic activity within a neuronal ensemble in the hippocampus (e.g., during novelty exposure), in the amygdala (e.g., during acquisition of long-term fear memory), or in the sensory cortices (e.g., after intense sensory experience following sensory deprivation) (19–22). Despite the growing interest in Arc/Arg-3.1 function, however, surprisingly little is yet known about the genomic mechanism by which acute delivery of synaptic information can be reliably encoded into Arc/Arg-3.1 transcriptional events in the nucleus. To address this question, we investigated the cis-acting enhancer elements responsible for such stringent neuronal activity dependence. Results Presence of a Strong Synaptic Activity-Responsive Element in a Distal Portion of the Mouse Arc/Arg-3.1 Promoter. We performed tran-
scriptional reporter assays using primary culture neurons in which endogenous Arc/Arg-3.1 is rapidly and transiently induced by 4AP/ BIC stimulation (Fig. 1A). In the mouse genome, 7 conserved regions exceeding 65% identity per 100 bp with humans were found between 0 and ⫺5 kb (from the transcription initiation site), and 1 distal region was mapped between ⫺6 kb and ⫺7 kb (Fig. 1B). No further conserved regions were found between ⫺7 kb and ⫺10 kb. Prior studies have demonstrated the role of a proximal region (⬍2 kb) of the Arc/Arg-3.1 promoter in its activity dependence (23, 24). Consistent with this, proximal regions [Arc1000 (⫺996 to ⫹198) and Arc2000 (⫺1996 to ⫹198)] showed 2- to 3-fold induction after stimulation in our assays (Fig. 1C). Genomic regions up to 3 kb (Arc3000, ⫺2996 to ⫹198) conferred an 8-fold induction (Fig. 1C). The activated levels of 4-kb and 5-kb fragments [Arc4000 (⫺3996 to ⫹198) and Arc5000 (⫺4996 to ⫹198)] were similar to that of Arc3000, but their basal levels in TTX were significantly lower than those of Arc1000, Arc2000, and Arc3000 (P ⬍ 0.01), resulting in an ⬇20-fold induction (Fig. 1C). Unexpectedly, extension of the genomic sequence up to 7 kb (Arc7000, ⫺7065 to ⫹198) resulted in further increase in its induction ability, of ⬎150-fold, in Author contributions: H.O. and H.B. designed research; T.K., H.O., M.N., and N.K. performed research; A.A.-M., M.O., S.T.-K., and P.F.W. contributed new reagents/analytic tools; T.K., H.O., M.N., N.K., and H.B. analyzed data; and T.K., H.O., M.N., and H.B. wrote the paper. The authors declare no conflict of interest. This article is a PNAS Direct Submission. 1T.K.
and H.O. contributed equally to this work.
2To
whom correspondence may be addressed. E-mail:
[email protected] or okuno@ m.u-tokyo.ac.jp.
This article contains supporting information online at www.pnas.org/cgi/content/full/ 0806518106/DCSupplemental. © 2008 by The National Academy of Sciences of the USA
www.pnas.org兾cgi兾doi兾10.1073兾pnas.0806518106
4AP/BIC 4h
4AP/BIC 8h
4AP/BIC 16h
A Human
Anti-Arc
B -10000 -9000
-8000 -7000 -6000 -5000 -4000 -3000 -2000 -1000
0
Human
Arc
Mouse
Arc Luc
Reporter
Luciferase Activity
TTX 4AP/BIC
*
*
D100
*
8 6 4 2
***
**
0.6
80
ns
**
0.2
40
0.0
0 Arc4000 Arc7000 Normal 4AP/BIC TTX Medium
4AP/BIC 4h Arc Tubulin
Luc Activity
1000
Anti-Arc
4AP/BIC
100
del#1
Luc
del#2
Luc
1
TTX 4AP/BIC
100
80 0.6 * 0.4 ** 60 0.2 0.1 40 #1 #2 7
*** **
20 0
-7000
-8000
C
-1h
-6000
0h
4h
8h
del#1
0
1h
12h
D
del#2 Arc7000
5 4 3 2 1 0 -2 0
2
4
6
8 10 12 14 16 18
Time (h) 100 pulses, 100Hz, 10 times
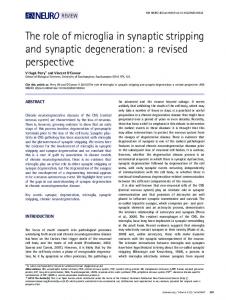
Fig. 2. The distal conserved region is crucial for the Arc7000 promoter activity. (A) Arc7000 deletion mutants. The genomic locus framed by a dashed box in Fig. 1 B is expanded and shown. (B) Presence of a potent enhancer element between Arc7000-del no. 1 and Arc7000-del no. 2. n ⫽ 6 independent experiments. *, P ⬍ 0.05; **, P ⬍ 0.01; ***, P ⬍ 0.001, compared with the TTX or the 4AP/BIC value of Arc7000-del no. 1 (1-way ANOVA with Tukey’s test). (C and D) Rapid and transient induction of luciferase luminescence by Arc7000 after high-frequency electrical stimulation. Hippocampal neurons transfected with a click beetle luciferase (ELuc) vector was electrically stimulated at 0 h (triangle), and luminescence in the soma was monitored. Representative images were shown in C. n ⫽ 9 neurons. (Scale bar, 50 m.)
Normal
10
TTX
0.1 0.1
1
10
100
endogenous Arc / Tubulin
Fig. 1. Multiple regulatory elements in the mouse Arc/Arg-3.1 promoter. (A) Time course of endogenous Arc/Arg-3.1 protein induction by 4AP/BIC stimulation. Cultured cortical neurons pretreated with TTX were stimulated with 4AP/BIC for indicated hours. (Scale bar, 100 m.) (B) Evolutionarily conserved genomic regions in the upstream of the Arc/Arg-3.1 gene. Regions conserved between mice and humans are shown as white boxes. A destabilized luciferase (Luc-PEST) gene was used as a reporter. (C) Transcriptional regulatory activities of Arc1000 – 5000. Cultured cortical neurons were stimulated with 4AP/BIC for 4 h. Luciferase activities are normalized relative to the activity of Arc1000 under the TTX treatment. This normalization applies to all luciferase assay data in this study. Statistical analyses were performed separately for the TTX and 4AP/BIC data sets. n ⫽ 5 independent experiments. *, P ⬍ 0.05; **, P ⬍ 0.01; ***, P ⬍ 0.001 compared with the TTX or the 4AP/BIC value of Arc1000 (1-way ANOVA with Tukey’s test). (D) Strong activation ability of Arc7000. The y axis for the basal levels were expanded and shown in the inset for clarity. n ⫽ 7 independent experiments. **, P ⬍ 0.01; ns, not significant (paired t test) compared with the 4AP/BIC or the TTX value of Arc4000. (E) Arc7000-driven luciferase correlates with endogenous Arc induction. Left, coexpression of luciferase and endogenous Arc protein after stimulation. (Scale bar, 50 m.) Right, simultaneous quantification of luciferase activities and endogenous Arc protein levels in the same samples. Cell lysates were prepared from neurons with no treatment (normal medium), with TTX, or with 4AP/BIC for 4 h. Arc protein levels were quantified by Western blotting and plotted against the reporter luciferase activities. Duplicated samples were analyzed and shown.
response to stimulation (P ⬍ 0.01) (Fig. 1D), indicating the presence of a very potent enhancer in the most distal conserved region. We also examined the relative potency of Arc7000 at single-cell resolution, using a destabilized GFP as a fluorescent reporter. As expected from the results of luciferase assays, GFP signals in individual neurons were more elevated downstream of Arc7000 than of Arc4000 (P ⬍ 0.001) [supporting information (SI) Fig. S1]. Additionally, no GFP signals were detected in glial cells (data not shown), indicating that Arc7000 may also determine the neuronspecific expression pattern of the Arc/Arg-3.1 gene. Kawashima et al.
Luc
Arc7000-Luciferase 4 7
20
None Arc1000 Arc2000 Arc3000 Arc4000 Arc5000
TTX Anti-Luc
Arc7000
0.4 60
0
E
Arc
Arc5000 Arc4000 Arc3000 Arc2000 Arc1000
Luciferase Activity
Arc7000
C 10
(bp)
B
Arc
Mouse
The Arc7000 activity correlated well with the endogenous Arc/Arg3.1 expression, because the reporter luciferase after stimulation was mostly coexpressed in the same cells as endogenously induced Arc/ Arg-3.1 (Fig. 1E), and Western blots showed a linear relation between luciferase activity and endogenous Arc protein levels (Fig. 1E). Identification of a Synaptic Activity-Responsive Element (SARE) in Arc7000 That Is Critical for Activity-Regulated Gene Expression. To
pin down the critical enhancer element, we next examined a genomic deletion (del) mutant Arc7000-del no. 1 (⫺6667 to ⫹198), in which the most distal conserved region was truncated (Fig. 2A). This mutant revealed a striking decrease in activity dependence compared with Arc7000 (P ⬍ 0.01) (Fig. 2B). In contrast, Arc7000del no. 2 (⫺6893 to ⫹198), in which the conserved region was spared, possessed an activity dependence indistinguishable from Arc7000 (Fig. 2 A and B). Intriguingly, the basal level of Arc7000del no. 2 in TTX was indistinguishable from that of Arc7000, but was significantly lower than that of Arc7000-del no. 1 (P ⬍ 0.05) (Fig. 2B). We then tested whether robust high-frequency synaptic activity triggered by electrical stimulation could induce reporter gene expression downstream of Arc7000 in single neurons. Hippocampal neurons transfected with an Arc7000-ELuc-PEST plasmid were stimulated with field electrical pulses. In responding neurons, luminescence started to increase immediately after the stimulation, reached plateau after 4–6 h, and attenuated gradually after 8 h (Fig. 2 C and D). This activation time course closely resembled the induction time course of endogenous Arc/Arg-3.1 following electrical stimulation in vivo (25). These findings were most consistent with the presence of a potent enhancer, which we termed SARE, in a region between Arc7000del no. 1 and Arc7000-del no. 2 (Fig. 2 A and B). Close examination of the evolutionarily conserved region present in del no. 2 but truncated in del no. 1 revealed a series of short conserved sequence stretches, of ⬇100 bp (Fig. 3A). To directly test the role of these sequence stretches, we fused a 104-bp fragment (⫺6793 to ⫺6690) to a TATA-containing short PNAS 兩 January 6, 2009 兩 vol. 106 兩 no. 1 兩 317
NEUROSCIENCE
4AP/BIC 2h
Luciferase Activity
4AP/BIC 1h
TTX
Luminescence (L/L0)
A
A
mouse cow macaque human
-6905 -7118 -4386 -7851
TGGCAGGGACA--ATGTCACCAGTCTCC---------AGCCAGGGACTCTGGTCCCCACCTCTCCTTCAGGGCAGGGGCTGAGCAGGTGTAGGG-CAGGGTGGGCCCT--GGGTGGTGGCAGGCT--CAGC-GGGCAGGGAAGGAGAGGCTACAGGGAGAATGG-----AGGC-GGGACCCTGGGCCTCCTC-CGGGCTGGCCGCCACCGTTTCCCGCGCGCGGGGGCGGAGCTGGGACAGAGCCTGCCTTCCGCCCGCCTGC-G AGGCAGGGCTGT-GTGACTCTTGGCCCCTGACCTCCCAGCCGGGGGCCCAGGTCATCCACTCCTGGT-AGGGCTGGGGCTGGGCAGGGGTCCCTTCAGGCCAGCACCTCAGAGAGCTGGCGGGCGGGCAGGTG AGGCAGGGCTGC-ATGACCCCTGGCTCCTGACCTCCCAGCCGGGGTCCCAGGTTGTCCAATCCTGGT-AGGGCTGGGGCTGGGCGGGGGGCCCTTCAGGCCAGCACCTCAGAGAGCAGGCGGGCGGGCGGGTG
del#2
SARE (Synaptic Activity-Responsive Element) GCACAGAGCCTTCCTGCGTGGGGAAGCTCCTTGCTGCGTCATGGCTCAGCTATTCTCAGCCTCTCTCCTTTTATGGTGCCGGAAGCAGGCAGG--CTGCT----GCTGG-GCTGGCTCTGGG-AGGTATTTAAATGGAATTGC GCGCCGCCTGCACCTGCGTGGGGAAGCTCC---CCGCGTCACAGC-GAGCTATTCTCAGCCCCACTCCTTTTATGGCCCCGGAACTGAGTGGTGGAGGCTGGCGCACTGCGCTGGCTC-----AGAGATGTAAATGGGAACGC GCGCAGAGCCTGCATGCGTGAGGA-GCTCCTGGCGGCGTCACAGCCGCGCTATTCTCAGTCTCTCTCCTTTTATGGCTCCGGAAGTGAGCTGGGGATGCTGGCAGCCTG-GCTGGCACCGGGGAGAGATGTAAATGGAGATGC GTGCAGAGTCTGCATGCGTGAGGA-GCTCCTGGGCGCGTCACAGCCGCGCTATTCTCAGCGTCTCTCCTTTTATGGCTCCGGAAGTGAGCTGGGGTTGCTGGCAGCCTG-GCTGGCACTGGGGAGAGATTGAAATGGAGATGC
B
0.12
B
Mouse Rat 0.12 Cavy 0.08 0.16 Cow 0.09 0.03 Macaque 0.02 0.12 0.05 Human 0.32 Opossum Platypus 0.05
0.04
0.11
0.30
C
del#1
D
C -7000
D -5000
-3000
-1000
0 (bp)
Arc
SARE
ArcMin
104 bp
421 bp
Reporter
Luciferase Activity
A
-6656 -6860 -4115 -7580
TTX *** 4AP/BIC
100 80
***
ns
0.8
ns
60 0.6 0.4
40 0.2 0.0
20
A S 7
0 ArcMin SARE-ArcMin Arc7000
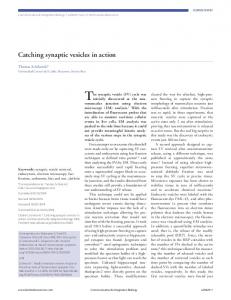
Fig. 3. Arc/Arg-3.1 SARE replicates Arc7000 promoter activity. (A) Comparison across multiple mammalian species. Conserved sequences were highlighted in gray. A short stretch of sequences (thick line) consisted of 4 highly conserved boxes (boxes A–D) was termed a synaptic activity responsive element (SARE). (B) Dendrogram showing the divergence of SARE sequences across various mammalian species. The numbers represent the branch length, which indicates the degree of nucleotide differences. Detailed nucleotide information for this analysis is shown in Fig. S3. (C) SARE-ArcMin reporter vector. SARE was fused directly upstream of ArcMin, a TATA-containing sequence around the transcription initiation site of the Arc/Arg-3.1 gene. (D) SARE-ArcMin replicates the activation ability of Arc7000. n ⫽ 5 independent experiments. ***, P ⬍ 0.001; ns, not significant, compared with the TTX or the 4AP/BIC value of ArcMin (1-way ANOVA with Tukey’s test).
promoter (⫺222 to ⫹198) of the Arc/Arg-3.1 gene (SARE-ArcMin) (Fig. 3 A and C). Luciferase activity driven by SARE-ArcMin was increased ⬎100-fold in response to stimulation (Fig. 3D). The basal levels did not differ between SARE-ArcMin and ArcMin (Fig. 3D). Importantly, the activation level of SARE-ArcMin was indistinguishable from that of Arc7000 (Fig. 3D). The fluorescent protein reporter assay also revealed a dramatic increase in GFP signal positivity in SARE-ArcMin reporter-transfected neurons, following synaptic stimulation in individual cells (Fig. S2). None of the other conserved genomic regions showed such strong enhancer activities on their own (data not shown). Taken together, these results indicate the existence of a novel SARE in the distal Arc/Arg-3.1 promoter, which appeared to be critical for replicating the amplitude of activity-induced transcriptional response of the full promoter in the absence of any other adjacent genomic regions, when placed immediately upstream of the minimal Arc/Arg-3.1 promoter. Contribution of 3 Activity-Regulated Transcription Factors, CREB, MEF2, and SRF, in SARE Activation. SARE contained 4 conserved
sequence stretches (Fig. 3A). This raised the possibility that perhaps distinct transcription factors could in principle bind to SARE, and thus, these putative binding sites were tentatively called boxes A⫺D (Fig. 3A). All 4 boxes were conserved in most mammals, except some species such as the opossum and the platypus (Fig. 3B and Fig. S3). To address their requirements, we introduced mutations in each of these boxes, and tested them either in the upstream of a TATA-containing minimal CMV promoter (minCMV, which has virtually no transcriptional activity per se), or in the context of the full Arc7000 promoter (Fig. 4 A and B). Luciferase activity of SARE-minCMV was increased ⬎80-fold in response to stimulation, and this induction was dramatically diminished by single mutations in boxes B, C, and D (P ⬍ 0.001). In contrast, a mutation in box A had no significant effect (Fig. 4A). Combined mutations in both boxes B and D almost completely blocked the induction (Fig. 4A). Similar results were obtained in the context of the full Arc7000 promoter (Fig. 4B). These data suggested that boxes B, C, and D were required for the enhancer activity of SARE, and some cooperativity might exist between them. Additionally, the basal level of SARE-minCMV was significantly elevated by mutating box D (P ⬍ 0.001) (Fig. 4A), indicating that box D might also contribute to attenuating transcription during synaptic inactivity. We next sought to identify the transcription factors that bound to these sites. Box B contained a sequence matching a half site of the consensus binding sequence for CREB (Fig. 4C). Box C matched 318 兩 www.pnas.org兾cgi兾doi兾10.1073兾pnas.0806518106
the consensus for myocyte enhancer factor 2 (MEF2) with the exception of 2 nucleotides (Fig. 4C). The 5⬘-end of box D perfectly matched the consensus for SRF, while the 3⬘-end perfectly matched the consensus for the ternary complex factors (TCFs), the wellcharacterized accessory proteins of SRF (Fig. 4C). An electrophoretic mobility-shift assay (EMSA) revealed the formation of each specific protein-DNA complex for boxes B, C, and D in nuclear extracts obtained from electroconvulsive shock-treated rat cortices (Fig. 4C). Consistent with the consensus sequence matches, each complex was disrupted by adding excess amounts of competitor DNA, and gel supershifts were detected using CREB-, MEF2-, and SRF-specific antibodies. Furthermore, chromatin immunoprecipitation (ChIP) assay using neuronal culture confirmed physical binding of CREB, MEF2, and SRF to SARE in cultured neurons (Fig. 4D and Fig. S4). Together, these data strongly suggest that CREB, MEF2, and SRF play critical roles in SARE activation via binding to boxes B, C, and D, respectively (Fig. 4C). We further investigated the intracellular signaling pathways upstream of these transcription factors. The SARE activation in the context of Arc7000 by 4AP/BIC treatment was almost completely suppressed when both AMPA-R and NMDA-R were blocked, confirming that excitatory synaptic inputs trigger the activation (Fig. S5A). In addition, the activation was reduced 80% when only NMDA-R was blocked, indicating that synaptic Ca2⫹ influx through NMDA-R is critical for the SARE activation (Fig. S5A). The activation was also significantly diminished by KN-93, a Ca2⫹/ calmodulin-dependent protein kinase (CaMK) inhibitor, and U0126, a mitogen-activated protein kinase kinase (MEK) inhibitor (Fig. S5B). An essentially similar pharmacological profile was obtained when the SARE activity was tested in the upstream of the minimal CMV promoter (Fig. S5C). These results confirmed that SARE was crucial for a large part of the transcriptional response of the Arc/Arg-3.1 gene that lied downstream of activity-regulated signaling mechanisms, such as CaMK and MAPK cascades, both of which were previously shown to underlie many aspects of neuronal adaptive responses (8, 26). Visualization of Activated Cells in a Neuronal Circuit Using a SARE Reporter Lentivirus Vector. One potential caveat of the above
experiments was that these in vitro assays did not involve genomic integration of the reporter genes. Therefore, we designed a lentivirus-based gene delivery system to introduce SARE-driven reporters into the neuronal genome (Fig. 5). We constructed a lentivirus vector containing 2 expression cassettes placed in opposite directions and separated by an insulator sequence. In 1 cassette, Kawashima et al.
A
B 0.4
***
8
ns
100
***
ns
TTX 4AP/BIC
A
ArcMin SARE
LTR FLAP d2EGFP
80
B
Arc SARE Reporter Vector PGK RFP
0.0
min W A B C D B&D
2
***
**
40
***
**
*
20
***
0 minCMV WT mutA mutB mutC mutD mutB&D
0
CREB
MEF2
SRF
TCF
TTAAAAATAA C TTTT G
AAAAA CCA TTTTTTGG
AAGGAA CC T
D
+ Input
+ -
-
-
CREB Myc
antiCREB
IgG
Box D
-
+ -
Input
+ -
-
-
MEF2 Myc
antiMEF2
IgG
Input
+ -
+ antiSRF
-
-
SRF Myc
IgG
SARE Negative Control Positive Somatostatin Control
Nur77
β-actin
Fig. 4. Involvement of coclustered CREB, MEF2, and SRF in the SARE activation. (A) Loss of the SARE activity by mutations in the boxes B, C, and D, but not A, in the context of a minimal CMV promoter (SARE-minCMV). Note that the basal level (TTX) was elevated by a mutation in the box D (inset). WT, wild-type; ***, P ⬍ 0.001; ns, not significant, compared with the TTX or the 4AP/BIC value of WT (1-way ANOVA with Tukey’s test). (B) Loss of the Arc7000 activity by mutations in the boxes B, C, and D. WT, wild-type; *, P ⬍ 0.05; **, P ⬍ 0.01; ***, P ⬍ 0.001; ns, not significant, compared with the 4AP/BIC value of WT (1-way ANOVA with Tukey’s test). (C) EMSA revealed binding of CREB, MEF2, and SRF to the boxes B, C, and D. Top, the matched nucleotides are indicated by dots. The evolutionarily conserved nucleotides are highlighted in gray. The mutated nucleotides are shown with white letters. Bottom, representative results of EMSA. The brain nuclear extracts were added with probes of the boxes B, C, and D. Specific DNA-protein complexes (arrows) were observed, which disappeared by adding excessive amounts of unlabeled competitors (Comp), but not by mutated competitors (Mut Comp). Antibodies against CREB, MEF2, and SRF disrupted or supershifted the complexes, whereas a control antibody (anti-Myc) had no effects. (D) Chromatin immunoprecipitation (ChIP) assays revealed physical binding of CREB, MEF2, and SRF to SARE in the genome. Target genomic sequences were amplified with specific primer sets by qPCR. Left, the genomic region adjacent to the SARE sequence (within 200 bp) was detected in the immunoprecipitates obtained using an anti-CREB antibody, while a negative control sequence 10 kb downstream of SARE was not. The Somatostatin promoter was used as a positive control. Middle, detection of SARE in the immunoprecipitates obtained using an anti-MEF2 antibody. The Nur77 promoter was used as a positive control. Right, detection of SARE in the immunoprecipitates obtained using an anti-SRF antibody. The -actin promoter was used as a positive control.
an RFP marker (TurboFP635) was driven under the control of a constitutive pgk promoter, while in the other, a d2EGFP reporter was expressed under the control of SARE-ArcMin. A control virus vector contained all these elements except for SARE (Fig. 5A). BDNF is known to effectively induce endogenous Arc/Arg-3.1 expression in neurons. When SARE-ArcMin lentivirus-infected neurons were stimulated with BDNF, GFP signals became detectable in individual neurons (Fig. 5B). We further examined, by time-lapse live-cell fluorescence imaging, the activation time course of the genome-integrated SARE, upon high-frequency electrical Kawashima et al.
PGK RFP
WPRE LTR
BDNF
5.8 kb
C
Box C
box B CTGCGTCATGGCTC box C CAGCTATTCTCAGCC box D CTCCTTTTATGGTGCCGGAA mut B CTGAAACATGGCTC mut C CAGATATGCTCCGCC mut D CTACTTGTATTGTGCCGGAA
Comp. Mut Comp. Antibody -
Insulator
Arc7000
Box B
consensus TGACGTCA
LTR FLAP d2EGFP
WT mutA mutB mutC mutD mutB&D
SARE-minCMV
C
BstBI
Control Vector ***
Fluorescence (F/F0)
***
GFP
TTX EcoRI
60
4
RFP
WPRE LTR
0.2
6
SARE-ArcMin-d2EGFP
SARE-ArcMin
7
Highly Reactive Cells Average All Cells Average
6
D
All Cells Average
6
5
5
4
4
3
3
2
2
1
1
0
ArcMin
7
0 0
2
4
6
8 10 12 14 16
Time (h)
0
2
4
6
8 10 12 14 16
Time (h)
Fig. 5. Lentivirus-based genomic integration of the SARE reporter. (A) Design of lentiviral vectors. Top, the SARE reporter vector encodes an inducible reporter GFP (d2EGFP) under the control of SARE-ArcMin and a constitutively expressed infection marker RFP (TurboFP635) under the control of a pgk promoter. Bottom, a control vector lacking SARE. (B) Hippocampal neurons infected with the SARE reporter lentivirus were stimulated with BDNF for 6 h at 14 days postinfection. (Scale bar, 50 m.) (C) GFP live-cell imaging of SARE-virus-infected neurons stimulated with high-frequency electrical pulses. Hippocampal neurons infected with the SARE reporter lentivirus were stimulated with field electrical pulses at time 0 h (triangle, 100 pulses at 100 Hz, 9 times), and GFP fluorescence was monitored. Gray lines, traces of individual neurons. Filled squares, the average trace of all neuronsexamined(n⫽59).Opencircles,theaveragetraceofhighlyreactiveneurons (top 10% of all neurons sorted by the F/F0 value at the time of 8 h, n ⫽ 6). (D) No GFP fluorescence changes were observed in control-virus-infected neurons. Filled squares, the average trace of all neurons examined (n ⫽ 18).
stimulation (9 bursts of 100 Hz, 1 sec applied by field stimulation). In most of the SARE-ArcMin lentivirus-infected neurons, GFP fluorescence consistently increased immediately after the stimulation and started to saturate at ⬇6–8 h (Fig. 5C), while the control virus-infected neurons showed virtually no GFP responses (Fig. 5D). Some of the neurons were particularly responsive (Fig. 5C), indicative of high copy number expression from multiple and/or transcriptionally favorable genomic loci. Alternatively, these neurons might have been favored because of their highly excitable properties within the neuronal network in culture as previously reported (10). The above results suggested that the SARE-ArcMin lentivirus might provide a way to visualize specific sets of activated neurons in a given neural circuit in the brain. As a model, we designed an in vivo SARE-ArcMin reporter assay by directly injecting into mouse brains a d2EGFP reporter lentivirus. Consistent with prior reports (27), viral injection into the lateral ventricles of E15 mouse embryos reproducibly resulted in selective integration of infected neurons into layers 2/3 throughout the neocortex, as identified by RFP fluorescence and morphological criteria. No systematic differences were observed in the numbers of infected neurons between the 2 hemispheres. In our conditions, the infection rate was ranging 2–5% of the total cells in layers 2/3. Cortical activity in the primary visual cortex (V1) was then stimulated by direct manipulation of the visual sensory inputs. Virus-infected mice (3–4 week-old) were sensory-deprived on 1 eye by suture, dark-reared for 1–3 days, and the intact open eye was exposed to light (Fig. 6A). Such sensory manipulation produced unilateral activation of the V1, as visualized by high immunoreactivities of endogenous Arc/Arg-3.1 at layers 2/3 and 4 in the PNAS 兩 January 6, 2009 兩 vol. 106 兩 no. 1 兩 319
NEUROSCIENCE
Luciferase Activity
10
Light on open eye
Ipsi
Contra
B
Contralateral I II/III IV V VI
Ipsilateral
D
Contra **
GFP+ cells / RFP+ cells (%)
A
Ipsi
60
ns
40
20
0
SARE-ArcMin
C
Infected Cells (RFP) Reporter (GFP)
ArcMin
DAPI
Contralateral
Ipsilateral
Fig. 6. Visualization of activated neurons in vivo by the SARE viral vector. (A) Manipulation of neuronal activity in the mouse visual cortex. The virus-infected mice were sensory-deprived on 1 eye by suture, dark reared for 2–3 days, and exposed to light on the intact open eye. (B) Endogenous Arc/Arg-3.1 immunohistochemistry showing unilateral activation of the visual cortex. (Scale bar, 0.5 mm.) (C) The SARE reporter virus-infected neurons in layers 2/3 of the visual cortex. Activity-reporter GFP signals were detected in the contralateral side, but not in the ipsilateral side. (Scale bar, 20 m.) (D) The percentages of GFP-positive neurons over RFP-positive neurons in each hemisphere. n ⫽ 6 mice for SAREArcMin, n ⫽ 5 mice for ArcMin. **, P ⬍ 0.01; ns, not significant, compared to the ipsilateral side (paired t test).
contralateral, but not in the ipsilateral, visual cortex (Fig. 6B) (21). Consistent with this pattern, we found that the majority (58.3 ⫾ 7.9%) of RFP-positive neurons were GFP-positive in the contralateral hemisphere that received visual inputs, whereas only a small number (19.3 ⫾ 4.4%) of neurons were positive in the ipsilateral hemisphere (Fig. 6 C and D). The percentage of GFP- and RFP-double positive neurons in the contralateral hemisphere were comparable with that of Arc/Arg-3.1- and RFP-double positive neurons (57.8 ⫾ 4.6%) (Fig. S6), consistent with coexpression of reporter GFP and endogenous Arc/Arg-3.1. The control ArcMin virus-infected neurons showed low GFP positivity (about 20%) and did not show imbalances between hemispheres (Fig. 6D). Taken together, these results indicate that SARE-ArcMin lentivirus could reliably mark activated neurons within a targeted neuronal circuit. Discussion Elucidation of a Novel Transcriptional Switch Mechanism That Links Synaptic Activity with Nuclear Transcription: Participation of 3 Major Activity-Regulated Transcription Factors CREB, SRF, and MEF2 in Arc/Arg-3.1 Transcriptional Response. Our work indicates that the
Arc7000 promoter essentially replicates the transcriptional profile of endogenous Arc/Arg-3.1, and that a relatively short DNA sequence of ⬇100 bp provides a key regulatory mechanism for synapse-to-nucleus signaling. This novel cis-acting element contains 320 兩 www.pnas.org兾cgi兾doi兾10.1073兾pnas.0806518106
binding sites for 3 major activity-dependent transcription factors, CREB, MEF2, and SRF, and drove as much reporter induction as Arc7000, in response to synaptic stimuli, when placed upstream of the Arc/Arg-3.1 minimal promoter. Mutations in either one of the binding sequences resulted in a severe block of transcriptional activity. Thus, intact promoter occupancy by all 3 factors appears to be essential for proper transcriptional activation upon synaptic activity. Pharmacological analyses revealed that synaptic Ca2⫹ influx through NMDA-R was critical for its activation. On the basis of these findings, we named this main activity-sensor for Arc/Arg-3.1 transcription ‘‘synaptic activity-responsive element (SARE).’’ A functional CRE is present on many activity-regulated neuronal genes, and CREB has repeatedly been demonstrated to be a critical factor in establishment of long-term plasticity and long-term memory (1, 2, 20). Similarly, a critical role for SRE and SRF in activity-dependent gene expression has extensively been documented (3). Recent evidence also supports a role for MEF2 upstream of various activity-induced genes which directly regulate synaptic functions (28). However, the discovery of a physical clustering, corequirement and sufficiency of the 3 activitydependent cis-regulatory elements located in such close proximity (⬇100 bp) in SARE is particularly striking, suggesting that SARE may have a unique role as a coincidence detector for the 3 activity-dependent transcription factors. Intriguingly, we observed that mutations in the SRF-binding site not only abolished SARE activation, but also significantly augmented basal activity under silenced conditions, suggesting an additional role of SRF for transcriptional repression as previously reported in certain contexts in nonneuronal cells (29). Although distally located SARE likely acts as a major element for activity-dependent Arc/Arg-3.1 induction, other proximal elements may further cooperate with SARE. Our own data suggested that a proximal region possessed a 2- to 3-fold transcriptional activation ability, consistent with a previous study that showed the contribution of cAMP/MAPK pathways in the activity-dependent response mediated by this region (23). Furthermore, Egr-1/3 may also mediate the late, protein-synthesis dependent phase of Arc/ Arg-3.1 induction via binding to this proximal region (24). Mapping of Active Ensembles Within a Neuronal Circuit Can Be Achieved Using SARE-Based Reporters. Detailed analyses of Arc/Arg-
3.1 expression using in situ hybridization have revealed that Arc/ Arg-3.1 transcription is specifically triggered by task- or sensory input-related information processing in several brain areas, including the hippocampus, amygdala, and cerebral cortex (19–21). The shortness of SARE sequence allows designing a virus-based tool to monitor Arc/Arg-3.1 expression for both in vitro and in vivo imaging. We here performed an experiment where we injected a SAREreporter lentivirus into embryonic mouse cerebral ventricles in utero, at embryonic day 15 (E15). Prior work established that only the neuronal progenitor cells, present in the ventricular zone (VZ) on the day of injection, are susceptible to viral infection. VZ cells at E15 are destined to become layers 2/3 neurons in the cerebral cortex (27). More than 20 days after lentiviral infection, when the viral integration into the genome has been completed, we quantified the extent of visual activation in layers 2/3 of the primary visual cortex. The virus-injected mice were first dark reared for more than 24 h, which suppressed the reporter expression to the baseline. Following light exposure to 1 eye for 2–3 h, we found that ⬇60% of the infected neurons of layers 2/3 were GFP reporter positive, which is consistent with prior functional mapping/electrophysiological reports (30), indicating that the majority of neurons indeed experienced an intense period of input activity, presumably emanating from layer 4 neurons. Taken together, our work demonstrates that a SARE reporter, both in vitro and in vivo, can readily trace and mark an ensemble of cells that have experienced intense activity in the recent past. Further works are ongoing to design novel pharmacogenetical and Kawashima et al.
Materials and Methods Plasmids, Lentiviruses, and Reagents. Reporter plasmid construction, lentiviral vector preparation, and reagents are described in SI Materials and Methods. Neuronal Culture Preparation, Luciferase Reporter Assay, Fluorescent Protein Reporter Assay, and Luciferase Live-Cell Imaging. Dissociated neuronal culture was prepared from rat embryonic neocortex or postnatal hippocampus as described previously (10, 33). For luciferase assay, cortical neurons were transfected with a firefly luciferase reporter plasmid and an internal control Renilla luciferase plasmid by electroporation. At 10 days in vitro (div), the cells were silenced with TTX for 12–24 h, stimulated with a 4-aminopyridine/bicuculline (4AP/BIC) mixture for 4 h, and lysed. Luciferase activities were measured using the Dual Luciferase assay system (Promega). For lentiviral reporter assay, hippocampal neurons cultured on coverslips were infected with lentiviruses at 2 div. At 15 div, neurons were silenced with TTX and then stimulated with BDNF (a gift from Dainippon Sumitomo Pharma, Osaka, Japan). For luciferase live-cell imaging, hippocampal neurons transfected with the Arc7000-ELuc-PEST plasmid were imaged in a culture medium containing d-luciferin (0.5 mM, Toyobo) at 14 –18 div. All animal experiments were carried out in accordance with regulations and guidelines of the University of Tokyo and approved by the institutional review committee of University of Tokyo Graduate School of Medicine. More information is provided in SI Materials and Methods.
Protein-DNA complexes were separated on acrylamide gels and analyzed by an image analyzer (BAS2500, Fujifilm). Chromatin immunoprecipitation was performed using a kit (Active Motif) essentially following the manufacture’s instructions. Precipitates were analyzed using a real-time PCR system (Roche) and gel electrophoresis. More information is provided in SI Materials and Methods. Viral Reporter Assay in Mouse Visual Cortex. Production of lentivirus-infected mice is described in SI Materials and Methods. After 3– 4 postnatal weeks, the infected mice were subjected to monocular deprivation, dark reared for 1–3 days, exposed to a bright environment for 2–3 h, and then perfused for immunohistochemical analysis. For quantification, infected neurons were identified by native RFP signals and TSA-enhanced GFP-immunoreactive cells were counted. More information is provided in SI Materials and Methods. Statistical Analysis. Statistical analyses were performed using Prism 4.0 (Graphpad Software). Student’s paired t test and 1-way analysis of variance with repeated measures (ANOVA) followed by Tukey’s post hoc test were used for comparisons between 2 groups and 3 groups, respectively. Mann-Whitney U test was used for fluorescence reporter assay. All data are shown as mean ⫾ standard error of the mean (SEM), unless otherwise stated.
Electrophoretic Mobility Shift Assay (EMSA) and Chromatin Immunoprecipitation (ChIP) Assay. Preparation of brain nuclear extracts is described in SI Materials and Methods. The nuclear extracts (2 g for CREB and SRF and 10 g for MEF2) were reacted with 32P-radiolabeled DNA probes. Excess amounts (300-fold) of unlabeled probes were added to the reaction mixture for competition assay.
ACKNOWLEDGMENTS. We thank H. Miyoshi and D. Trono for the lentiviral vector and packaging constructs, respectively; Dainippon Sumitomo Pharma (Osaka, Japan) for supply of BDNF through the courtesy of C. Nakayama and T. Ishiyama; C. Tohyama, M. Kakeyama, and W. Yoshioka (University of Tokyo) for technical help in qPCR analyses; T. Furukawa (Olympus-Japan) for assistance in building a live luciferase imaging microscope. We also thank all members of the Bito laboratory for support and discussion. We are particularly indebted to K. Saiki, Y. Kondo, and T. Kinbara for assistance. This work was supported in part by grants-in-aid from the Ministry of Education, Culture, Sports, Science and Technology (to H.O., M.O., S.T.-K., and H.B.) and from the Ministry of Health, Labor and Welfare (to H.O. and H.B.), by 21st century Center of excellence (COE) and Global COE programs (to H.B.), by a grant from National Institute of Mental Health (MH053608 to P.F.W.), and by awards from the Human Frontier Science Program Organization (career development award to H.O. and a program grant to H.B.), from the Takeda Foundation, from the Toray Science Foundation, and from the Yamada Science Foundation (to H.B.).
1. Kandel ER (2001) The molecular biology of memory storage: a dialogue between genes and synapses. Science 294:1030 –1038. 2. Bourtchuladze R, et al. (1994) Deficient long-term memory in mice with a targeted mutation of the cAMP-responsive element-binding protein. Cell 79:59 – 68. 3. Ramanan N, et al. (2005) SRF mediates activity-induced gene expression and synaptic plasticity but not neuronal viability. Nat Neurosci 8:759 –767. 4. Tokuyama W, Okuno H, Hashimoto T, Xin Li Y, Miyashita Y (2000) BDNF upregulation during declarative memory formation in monkey inferior temporal cortex. Nat Neurosci 3:1134 –1142. 5. Morris RG (2006) Elements of a neurobiological theory of hippocampal function: the role of synaptic plasticity, synaptic tagging and schemas. Eur J Neurosci 23:2829 –2846. 6. Pham TA, Impey S, Storm DR, Stryker MP (1999) CRE-mediated gene transcription in neocortical neuronal plasticity during the developmental critical period. Neuron 22:63–72. 7. Bliss TV, Collingridge GL (1993) A synaptic model of memory: long-term potentiation in the hippocampus. Nature 361:31–39. 8. Bito H, Deisseroth K, Tsien RW (1997) Ca2⫹-dependent regulation in neuronal gene expression. Curr Opin Neurobiol 7:419 – 429. 9. West AE, Griffith EC, Greenberg ME (2002) Regulation of transcription factors by neuronal activity. Nat Rev Neurosci 3:921–931. 10. Bito H, Deisseroth K, Tsien RW (1996) CREB phosphorylation and dephosphorylation: a Ca(2⫹)- and stimulus duration-dependent switch for hippocampal gene expression. Cell 87:1203–1214. 11. Robertson LM, et al. (1995) Regulation of c-fos expression in transgenic mice requires multiple interdependent transcription control elements. Neuron 14:241–252. 12. Flavell SW, Greenberg ME (2008) Signaling mechanisms linking neuronal activity to gene expression and plasticity of the nervous system. Annu Rev Neurosci 31:563–590. 13. Link W, et al. (1995) Somatodendritic expression of an immediate early gene is regulated by synaptic activity. Proc Natl Acad Sci USA 92:5734 –5738. 14. Lyford GL, et al. (1995) Arc, a growth factor and activity-regulated gene, encodes a novel cytoskeleton-associated protein that is enriched in neuronal dendrites. Neuron 14:433– 445. 15. Plath N, et al. (2006) Arc/Arg3.1 is essential for the consolidation of synaptic plasticity and memories. Neuron 52:437– 444. 16. Shepherd JD, et al. (2006) Arc/Arg3.1 mediates homeostatic synaptic scaling of AMPA receptors. Neuron 52:475– 484. 17. Chowdhury S, et al. (2006) Arc/Arg3.1 interacts with the endocytic machinery to regulate AMPA receptor trafficking. Neuron 52:445– 459. 18. Guzowski JF, et al. (2000) Inhibition of activity-dependent arc protein expression in the rat hippocampus impairs the maintenance of long-term potentiation and the consolidation of long-term memory. J Neurosci 20:3993– 4001.
19. Guzowski JF, McNaughton BL, Barnes CA, Worley PF (1999) Environment-specific expression of the immediate-early gene Arc in hippocampal neuronal ensembles. Nat Neurosci 2:1120 –1124. 20. Han JH, et al. (2007) Neuronal competition and selection during memory formation. Science 316:457– 460. 21. Tagawa Y, Kanold PO, Majdan M, Shatz CJ (2005) Multiple periods of functional ocular dominance plasticity in mouse visual cortex. Nat Neurosci 8:380 –388. 22. Ramirez-Amaya V, et al. (2005) Spatial exploration-induced Arc mRNA and protein expression: evidence for selective, network-specific reactivation. J Neurosci 25:1761– 1768. 23. Waltereit R, et al. (2001) Arg3.1/Arc mRNA induction by Ca2⫹ and cAMP requires protein kinase A and mitogen-activated protein kinase/extracellular regulated kinase activation. J Neurosci 21:5484 –5493. 24. Li L, Carter J, Gao X, Whitehead J, Tourtellotte WG (2005) The neuroplasticityassociated arc gene is a direct transcriptional target of early growth response (Egr) transcription factors. Mol Cell Biol 25:10286 –10300. 25. Wallace CS, Lyford GL, Worley PF, Steward O (1998) Differential intracellular sorting of immediate early gene mRNAs depends on signals in the mRNA sequence. J Neurosci 18:26 –35. 26. Thomas GM, Huganir RL (2004) MAPK cascade signalling and synaptic plasticity. Nat Rev Neurosci 5:173–183. 27. Hashimoto M, Mikoshiba K (2004) Neuronal birthdate-specific gene transfer with adenoviral vectors. J Neurosci 24:286 –296. 28. Flavell SW, et al. (2006) Activity-dependent regulation of MEF2 transcription factors suppresses excitatory synapse number. Science 311:1008 –1012. 29. Davis FJ, Gupta M, Camoretti-Mercado B, Schwartz RJ, Gupta MP (2003) Calcium/calmodulin-dependent protein kinase activates serum response factor transcription activity by its dissociation from histone deacetylase, HDAC4. Implications in cardiac muscle gene regulation during hypertrophy. J Biol Chem 278:20047–20058. 30. Bear MF, Kleinschmidt A, Gu QA, Singer W (1990) Disruption of experience-dependent synaptic modifications in striate cortex by infusion of an NMDA receptor antagonist. J Neurosci 10:909 –925. 31. Feil R, Wagner J, Metzger D, Chambon P (1997) Regulation of Cre recombinase activity by mutated estrogen receptor ligand-binding domains. Biochem Biophys Res Commun 237:752–757. 32. Zhang F, Aravanis AM, Adamantidis A, de Lecea L, Deisseroth K (2007) Circuit-breakers: optical technologies for probing neural signals and systems. Nat Rev Neurosci 8:577– 581. 33. Takemoto-Kimura S, et al. (2007) Regulation of dendritogenesis via a lipid-raftassociated Ca2⫹/calmodulin-dependent protein kinase CLICK-III/CaMKIgamma. Neuron 54:755–770.
Kawashima et al.
PNAS 兩 January 6, 2009 兩 vol. 106 兩 no. 1 兩 321
NEUROSCIENCE
optogenetical experiments using SARE as a driver for conditional Cre recombinase such as hormone-activated CreERT2 (31), or for channelrhodopsins/halorhodopsins (32), with a view to manipulating specific gene expression or neuronal excitability in an activated ensemble of neurons within a circuit.