J Neurophysiol 89: 1363–1377, 2003; 10.1152/jn.00732.2002.
Synaptic Modulation of the Interspike Interval Signatures of Bursting Pyloric Neurons ˝ CS,1,3 REYNALDO D. PINTO,1,4 MICHAIL I. RABINOVICH,1 HENRY D. I. ABARBANEL,1,2 AND ATTILA SZU ALLEN I. SELVERSTON1 1 Institute for Nonlinear Science and 2Department of Physics and Marine Research Laboratory, Scripps Institution of Oceanography, University of California San Diego, La Jolla, California 92093-0402; 3Balaton Limnological Research Institute of the Hungarian Academy of Sciences, H-8237 Tihany, Hungary; and 4Instituto de Fisica da Universidade de Sao Paulo, 05315-970, Sao Paulo, Brazil Submitted 27 August 2002; accepted in final form 28 October 2002
Szu˝cs, Attila, Reynaldo D. Pinto, Michail I. Rabinovich, Henry D. I. Abarbanel, and Allen I. Selverston. Synaptic modulation of the interspike interval signatures of bursting pyloric neurons. J Neurophysiol 89: 1363–1377, 2003; 10.1152/jn.00732.2002. The pyloric network of the lobster stomatogastric nervous system is one of the best described assemblies of oscillatory neurons producing bursts of action potentials. While the temporal patterns of bursts have been investigated in detail, those of spikes have received less attention. Here we analyze the intraburst firing patterns of pyloric neurons and the synaptic interactions shaping their dynamics in millisecond time scales not performed before. We find that different pyloric neurons express characteristic, cell-specific firing patterns in their bursts. Nonlinear analysis of the interspike intervals (ISIs) reveals distinctive temporal structures (‘interspike interval signatures’), which are found to depend on the synaptic connectivity of the network. We compare ISI patterns of the pyloric dilator (PD), lateral pyloric (LP), and ventricular dilator (VD) neurons in 1) normal conditions, 2) after blocking glutamatergic synaptic connections, and 3) in various functional configurations of the three neurons. Manipulation of the synaptic connectivity results in characteristic changes in the ISI signatures of the postsynaptic neurons. The intraburst firing pattern of the PD neuron is regularized by the inhibitory synaptic connection from the LP neuron as revealed in current-clamp experiments and also as reconstructed with a dynamic clamp. On the other hand, mutual inhibition between the LP and VD neurons tend to produce more irregular bursts with increased spike jitter. The results show that synaptic interactions fine-tune the output of pyloric neurons. The present data also suggest a way of processing of synaptic information: bursting neurons are capable of encoding incoming signals by altering the fine structure of their intraburst spike patterns.
Rhythmic bursts of action potentials are commonly produced by neurons of oscillatory networks found in virtually every nervous system. Central pattern generators (CPGs) controlling motor function are among the best understood examples of such bursting networks (Marder and Calabrese 1996; Stein et al. 1997). The muscles receive discrete spike trains from their presynaptic neurons. The temporal structure of these spike trains determines the motor output in a strongly nonlinear
fashion (Brezina et al. 2000; Hooper and Weaver 2000). As a consequence, the number and timing of spikes in bursting motoneurons need to be properly tuned to achieve the desired response in the muscles. The pyloric central pattern generator of the crustacean stomatogastric nervous system is one of the best described and understood oscillatory neural circuits presently available (Marder 1997; Selverston and Moulins 1987). The biophysical and neuromodulatory factors shaping the overall network activity (Ayali and Harris-Warrick 1999; Nadim et al. 1999; Nusbaum et al. 2001; Swensen and Marder 2001) and the phase-relations between the component neurons (Hooper 1997) have been extensively studied. At the same time, the temporal structures of intraburst spikes have received less attention and have not been analyzed in detail. One reason for this is that motoneurons in this system are able to generate oscillatory patterns without spiking (Graubard 1978; Raper 1979). Spikes riding on the depolarizing phase of membrane oscillations play a definitive role in controlling muscle contraction, but they were thought to be relatively unimportant in organizing the overall network activity. Furthermore, muscles in crustacea are slow and have only a few axons innervating them, which suggested the timing of spikes is less critical than in vertebrate muscles. Since recent studies on pyloric muscles indicate that the temporal structure of the spike train (Hooper and Weaver 2000; Morris et al. 2000) may play a more important role that previously thought, a fresh examination of spike patterns is necessary from the point of view of how they are affected by synaptic factors. The synaptic connectivity of the network clearly plays a definitive role in shaping the phase-relationship among the component neurons. On the other hand, synaptic interactions might result in variations in the spike patterns of the component neurons. We address this issue by performing a comparative analysis of the interspike interval (ISI) patterns of different pyloric neurons using various linear and nonlinear techniques. Quantitative characterization of the bursts is often performed by using gross measures of the activity such as mean intraburst spike frequency or the number of spikes in a burst (Morris and
Address for reprint requests: A. Szu˝cs, Institute for Nonlinear Science, Univ. of California San Diego, 9500 Gilman Dr., La Jolla, CA 92093-0402 (E-mail:
[email protected]).
The costs of publication of this article were defrayed in part by the payment of page charges. The article must therefore be hereby marked ‘‘advertisement’’ in accordance with 18 U.S.C. Section 1734 solely to indicate this fact.
INTRODUCTION
www.jn.org
0022-3077/03 $5.00 Copyright © 2003 The American Physiological Society
1363
1364
˝ CS, PINTO, RABINOVICH, ABARBANEL, AND SELVERSTON SZU
Hooper 1998; Snider et al. 1998). These metrics do not emphasize the distinctive features of the bursts in different neurons; hence, we need a more appropriate method. In the recent paper, using return maps of ISIs, we examine the temporal structure of pyloric firing patterns. We investigate whether and how the temporal patterns of intraburst spikes are modulated by fast phasic synaptic inputs. Our results show that the intraburst ISI patterns of different pyloric neurons are highly reproducible, cell-specific, and that they depend on the synaptic interactions in the neural network.
METHODS
The experiments were performed on adult intermolt spiny lobsters Panulirus interruptus. The animals were obtained from Don Tomlinson Commercial Fishing (San Diego, CA). The lobsters were kept in aerated seawater at 15–16°C. Prior to dissection, the animals were cold anesthetized by packing them in ice for 30 – 40 min.
by comparing intracellular membrane potential traces with simultaneous extracellular recordings. Extracellular signals were measured using an A-M 1700 differential AC amplifier (A-M Systems).
Dynamic clamp To simulate inhibitory synaptic connections between neurons we utilized the dynamic clamp method (Sharp et al. 1993). Our version of the dynamic clamp was developed on a Windows platform and used a Digidata 1200B data acquisition interface (Axon Instruments, Union City, CA) (Pinto et al. 2001). The dynamic clamp program was used to deliver phasic inhibition to the pyloric dilator (PD) neuron. To achieve this, we used a computerized spike train generator producing bursts during the hyperpolarization phases of the pyloric oscillation in the PD neuron. The artificial “spikes” were computed using the following function designed to reproduce the shape of real LP neuron spikes V AN共t兲 ⫽ Af1 ⫹ Bf2 f 1 ⫽ 共tanh 关A1t兴 ⫹ 1兲e⫺t/1
tⱖ0
if
and
Preparation and recording The complete stomatogastric nervous system containing the stomatogastric ganglion (STG) and the anterior commissural and esophageal ganglia was separated from the stomach (Mulloney and Selverston 1974) and pinned on a silicone elastomer (Silgard 184, Dow Corning, Midland, MI)-lined petri dish. Interconnecting nerves as well as the output motor nerves of the STG were left intact. The connective sheath of the stomatogastric ganglion was removed using sharp forceps to facilitate access to the somata of the neurons. The STG was enclosed in a small petroleum jelly well that served as a separate perfusion chamber of approximately 2 ml volume. In experiments involving normal circuitry of the pyloric CPG (Fig. 1A), we used standard Panulirus physiological saline composed of (in mM) 483 NaCl, 12.7 KCl, 13.7 CaCl2, 10 MgSO4, 4 NaSO4, 5 HEPES, and 5 TES; pH 7.4. Partial isolation of the pyloric neurons was achieved by adding picrotoxin to the STG perfusion chamber while anterior ganglia were bathed in normal physiological saline (PTX, 8 M). PTX effectively blocked fast glutamatergic synapses (Bidaut 1980; Marder and Eisen 1984) while not affecting cholinergic connections (Fig. 1B). The temperature of the preparation was held at 16 –18°C using a thermoelectric Peltier-device attached to the bottom surface of the preparation dish. Intracellular recordings were made using Neuroprobe 1600 bridge amplifiers (A-M Systems, Carlsborg, WA). Microelectrodes were filled with 3 M K-acetate plus 0.1 M KCl solution with resistances ranging from 10 to 15 M⍀. Neurons were identified
where
f2 ⫽ 共tanh 关A2t兴 ⫹ 1兲et/2
if
t⬍0
The rising and falling parts of the action potential were fitted with different functions. The amplitudes A and B are normalization constants and were chosen to obtain precise connection of the two functions at the top of the spike (t ⫽ 0). The parameters A1, A2, 1, and 2 are time constants used to adjust the shape and width of the spike. Simulated chemical synaptic currents were computed using the formula I PD ⫽ gsynS共t兲关Vrev ⫺ VPD共t兲兴
where IPD is the postsynaptic current (into the PD neuron), gsyn is the maximal synaptic conductance, Vrev is the synaptic reversal potential and VPD(t) is the PD neuron’s membrane potential. Transmitter release is modeled by an instantaneous activation term S(t) given by the differential equation 关1 ⫺ S ⬁共VAN兲兴S S ⬁共VAN兲 ⫽ tanh
冋
dS共t兲 ⫽ 关S⬁共VAN兲 ⫺ S共t兲兴, dt
册
VAN共t兲 ⫺ Vth Vslope
when VAN ⬎ Vth,
where
otherwise S⬁共VAN兲 ⫽ 0
VAN is the membrane potential of the presynaptic (artificial) neuron (AN), S⬁ is the steady-state synaptic activation, S is the synaptic characteristic time constant, Vth is the synaptic threshold voltage, and Vslope is the synaptic slope parameter. In the experiments we used separate electrodes for measuring the membrane potential of the pyloric neuron and injecting the time-varying synaptic current.
Data acquisition and analysis
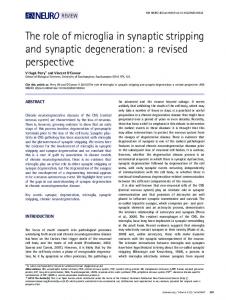
FIG. 1. Connectivity diagrams of the two pyloric subcircuits used in this study. The neurons are interconnected with electrotonic and inhibitory chemical synapses (A). Resistors indicate nonrectifying coupling, while diodes indicate rectifying connections (Johnson et al. 1993). Picrotoxin (PTX) blocks fast glutamatergic synapses (F) while not affecting cholinergic connections (E) (B). The ventricular dilator (VD) and lateral pyloric (LP) neurons in normal conditions receive glutamatergic connections from additional pyloric neurons not shown here. Functional removal of the LP and/or VD neurons is achieved by hyperpolarizing them below spike threshold. Abbreviations: AB, anterior burster; PD, pyloric dilator; VD, ventricular dilator; LP, lateral pyloric.
J Neurophysiol • VOL
Voltage traces of both the pyloric neurons and the simulated neuronal input were displayed and acquired at 10 kHz by a Pentium III computer equipped by a PCI-MIO-16E4 data acquisition board (National Instruments, Austin, TX) and running the DASYLab 5.6 program (Datalog GmbH, Mo¨ nchengladbach, Germany). Action potential (spike) occurrences were detected in real-time by calculating the first time-derivative of the intracellular membrane potential and observing its local maxima (Fig. 2B). Nerve recordings were occasionally used for spike train analysis when the traces were not contaminated by overlapping spikes of multiple units and spike identification was straightforward (e.g., VD neuron spikes in the medial ventricular nerve). Spike arrival times of each recorded neuron were saved sequentially in separate ASCII files. Care was taken to monitor the stationarity of the ongoing pyloric rhythm as well as the reliability of the spike detection. We excluded data from the analysis when the
89 • MARCH 2003 •
www.jn.org
INTERSPIKE INTERVAL SIGNATURES OF BURSTING NEURONS
1365
FIG. 2. Spike train analysis methods used in the paper. Two bursts of the VD neuron are shown in A. The time derivative (B) of the trace is used to detect spikes. Interspike intervals (ISIs) are displayed in a sequential plot (C) to illustrate the long-term behavior of firing patterns. Each point represents a single ISI between a pair of spikes. The sequence consists of 2 populations, a consequence of the neurons firing bursts. ISI histogram (D) calculated from the data in C contains 2 main peaks indicating short (intraburst) and long (interburst) ISIs. Return map of ISI data (E) reveal serial dependencies of ISIs. The 2 arms parallel to the axes correspond to interburst interval (IBI) vs. ISI and ISI vs. IBI pairs. Density distribution of the points in the return map is displayed in F. Grayscale colors change from white to black as the local density of the clusters is increasing. To separate the clusters from the 0-density areas, a light-gray background is used.
pyloric activity was occasionally interrupted by cardiac sac (CS) episodes. Firing patterns normally recovered from CS episodes within 10 –15 cycle periods. The typical length of the spike trains was 1,000 s per experiment (single data file). The neurons produced ⱖ200 bursts (approximately 2,000 spikes) per epoch, depending on their burst cycle period and intraburst firing rate. Detailed quantitative analysis was performed using the spike trains {ti} ⫽ {t1,t2,t3,. . . tN}, where t1 ⬍ t2 ⬍ t3. . . are successive spike arrival times available for each neuron recorded. These were analyzed with several techniques. All the calculations were done using the authors’ computer program. Timing of the spikes relative to the preceding one was characterized by the interspike interval (1st-order ISI): ISIi ⫽ ti⫹1 ⫺ ti. ISI sequential graphs were constructed by plotting interspike intervals ISIi as a function of elapsed time (Fig. 2C). ISI histograms (ISIHs) were obtained using a Gaussian kernelbased density estimator (Parzen 1962; Sanderson and Kobler 1976) (Fig. 2D). Briefly, data points were convolved with a unity-area kernel rather than placed in separated bins. We preferred the Parzen-type estimation over the conventional binning due to its lower sensitivity to the choice of the kernel-width parameter and the resultant “smooth” distribution. Relations between successive ISIs were graphically demonstrated by ISI return maps also called joint interspike interval plots or Poincare´ maps (Dekhuijzen and Bagust 1996; Fitzurka and Tam 1999; Segundo et al. 1998) (Fig. 2E). Here, ISIi⫹1 was scatter-plotted against ISIi for each i ⱕ N – 2. Simply, we plotted the ISI of the second and third spikes against the ISI of the first and second. Then we moved one spike further into the burst and repeated the procedure with the second, third, and fourth spikes, etc. Consequently, points in these plots correspond to pairs of consecutive ISIs among three adjacent spikes. Return maps, besides their use in nonlinear dynamics, graphically demonstrate the serial dependence of interspike intervals and the precision of recurrent spike patterns (Faure et al. 2000). The diagonal of the return map divides it into two halves. Points falling into the right-lower part indicate a spike triplet with a short ISI following a longer one. Points in the left-upper half correspond to J Neurophysiol • VOL
triplets with a longer ISI following a shorter one. The return maps we obtained exhibit a wide variety of scattered structures and clusters. The overall spread of the return map and the relative size of the clusters measure the serial dependence of ISIs. To characterize the local density of the return maps, we calculated joint-interval density histograms using a two-variable Gaussian kernel in a way similar to that with ISIHs (Parzen-estimation; Fig. 2F). These histograms appear in the figures as grayscale coded maps. Hues changing from white to black indicate increasing density of spike triplet occurrences, i.e., when pairs of ISIs are more likely to appear. Pixels appear black if the local density is above 66% of the maximum density. The boundary of the clusters is defined where the local density drops below 1% of the maximum density. Due to the bursting nature of the pyloric neurons, the ISI graphs exhibit two main populations of ISIs (Fig. 2, C and D). Short ISIs (⬍0.1 s) correspond to the spike events within bursts, while long ISIs (⬎0.2 s) separate the last spike of the recent burst from the first spike of the following one. In the paper we focus on analysis of spike patterns within bursts (intraburst ISIs). Hence, interspike intervals, when not indicated otherwise, correspond to intraburst events, while the long, burst-separating ISIs are called interburst intervals (IBI; Fig. 2A). Return maps of a bursting neuron show a characteristic triangular form; points located near the origin correspond to intraburst interspike intervals (ISI vs. ISI); the two far legs of the triangle parallel with the axes correspond to burst start and termination: ISI versus IBI and IBI versus ISI, respectively. We analyze the timing and serial dependencies of intraburst spikes; hence, “legs” are omitted.
Statistics on data To characterize changes in the ISI return maps due to alterations of the synaptic connectivity, we used two statistical parameters. Entropy characterizes the uniformity of the intraburst ISI distribution or the degree of randomness observed in the return maps (Rogers et al. 2001; Tock and Inbar 1999). Values of the density histograms were normal-
89 • MARCH 2003 •
www.jn.org
˝ CS, PINTO, RABINOVICH, ABARBANEL, AND SELVERSTON SZU
1366
ized to the total count and joint probabilities pi,j were achieved. Normalized entropy H was computed by the formula
冘 n
H⫽⫺
pi,j log2 共pi,j兲
i,j
log2 共n2兲
The denominator of the expression is the logarithm of the total number of values used in the density distribution (n2 bins). H is normalized into a unitless measure and it is scaled between 0 and 1. Zero (minimal) entropy is obtained when there is only one nonzero probability in the distribution, the most “peaked” distribution. If all the probabilities in the joint density distribution are equal, then H ⫽ 1 and the maximal entropy is obtained. The other statistical parameter we used was a measure of the “area” occupied by the forms appearing in the return maps. This was done by summing up the fractions of the return map where the local density exceeded 10% of the maximal density. This parameter has the unit of seconds squared. A more spreadout and random return map occupies a larger area. Statistical parameters were computed in various functional configurations of the pyloric neurons, expressed as means ⫾ SD, and the differences were evaluated using the paired t-test for mean in MS Excel. RESULTS
The pyloric neurons used in our experiments exhibited robust and stationary burst patterns both in normal solution and when the glutamatergic synapses were blocked by PTX (Figs. 4 and 6). Pyloric burst frequency averaged 1.82 ⫾ 0.06 Hz (n ⫽ 11) when using normal saline and 1.81 ⫾ 0.05 Hz (n ⫽ 8) with PTX in the bath. The neurons produced bursts of similar shape and nearly equal spike numbers. Ten consecutive bursts of the PD and LP neurons are superimposed in Fig. 3, A
and B. The traces are aligned at the position of the first spike in the bursts. The PD neuron generated identical bursts containing virtually overlapping spikes. At the same time, the LP neuron exhibited more variability in the burst fine structure, especially during the termination phase (both records in normal saline). We find a typical accelerating-decelerating interspike interval structure in the PD neuron with a nearly parabolic, chain-like pattern (Fig. 3E, zoomed part). The LP neuron displays a different type of bursting, deceleration with gradually increasing ISIs as the burst develops (Fig. 3F). Instantaneous firing rate (the reciprocal of interspike interval) develops in a characteristic manner in both neurons. PD neuron firing frequency is greatest in the second half of the burst, with instantaneous firing rate slowly increasing and then decreasing as the burst develops. For the LP neuron, the highest frequency firing occurs in the early part of the burst and is followed by a nearly linear deceleration phase. Averaged reciprocals of ISIs from hundreds of successive bursts show small SDs for the PD neuron and greater deviations for the LP (Fig. 3, C and D). This indicates that firing precision and reliability is greater in the normal bursting PD than the LP neuron. The same analysis shows that VD neuron firing has even greater variability (data not shown). Pyloric cycle frequency was not constant but varied slightly reflecting input from other stomatogastric networks (Nagy and Moulins 1987; Thuma and Hooper 2002). We identified two characteristic rhythms influencing the pyloric oscillation. A nearly periodic gastric modulation at 0.1– 0.2 Hz was observed in the majority of the cells and preparations (Clemens et al. 1998; Morris et al. 2000; Russell and Hartline 1982; Szu˝ cs et al. 2001). The gastric modulation resulted in periodic fluctua-
FIG. 3. Reliability of bursting in 2 pyloric neurons recorded simultaneously. Ten traces of consecutive bursts of a PD neuron are superimposed in A. Spikes are overlapping, indicating accurate repetition of spikes in the successive bursts. The early part of the LP bursts in B are also precisely repeated, but the termination phase of the bursts is more variable. Average instantaneous firing rate (reciprocal of the ISI) is depicted in C and D for the same neurons with the SDs as error bars (155 bursts averaged from both neurons). The ISI sequence of the normal bursting PD neuron is shown in E. Interburst intervals (IBIs, the population above 0.3 s) exhibit periodic fluctuation due to gastric modulation. Short (intraburst) ISIs from 2 successive bursts are zoomed in the right panel. The ISIs follow a pattern resembling a parabola. The ISI sequence in F demonstrates the firing pattern of the LP neuron acquired simultaneously. Here, intraburst ISIs are more scattered than those in the PD neuron. A zoomed part of the sequence shows 2 LP bursts. ISIs gradually increase as the burst develops.
J Neurophysiol • VOL
89 • MARCH 2003 •
www.jn.org
INTERSPIKE INTERVAL SIGNATURES OF BURSTING NEURONS
tions in the intraburst spike density as well as the burst cycle period of the pyloric neurons (Fig. 7B). Cardiac sac (CS) episodes occurred in a more sporadic manner (Ayali and Harris-Warrick 1998; Nagy and Moulins 1987). They arrived in 50-s or longer intervals with decreasing frequency or were absent (CS in Fig. 7, A and B). Interspike interval patterns were temporarily disrupted by CS episodes in all pyloric neurons studied (Ayali and Harris-Warrick 1998). The histograms and return maps we present below were obtained from stationary sections of the spike trains with no CS episodes and when transients due to changes in chemical concentrations of the bathing solution were absent. Pyloric neurons exhibit cell-specific ISI patterns The membrane potential waveforms of the normally bursting pyloric neurons show cell-specific features that are often sufficient to identify the neurons from their intracellular traces alone. The cell-specific features include the relative size of action potentials and the asymmetric shape of the bursts. In this respect the pyloric neurons display characteristic “signatures” in their voltage outputs. We found that the temporal structure of the intraburst spikes is also cell-specific. Depending on the shape of the individual
bursts, the neurons develop characteristic patterns in their interspike intervals. Relatively longer ISIs appear when the neuron’s membrane potential is rising or falling (burst onset or termination) and short ones appear when the neuron is most depolarized. As an example, the rising phase of PD burst is slower than that of the termination phase (Figs. 3A and 4A), leading to asymmetry in the intraburst ISI sequence (Fig. 3E, zoomed part). LP neuron firing changes in the opposite way— rapid onset at the start of the burst and slower hyperpolarization during its termination (Figs. 3B and 4D). The VD neuron produces the most complex burst waveforms (Fig. 4G) among the pyloric neurons we studied. A “saddle” in the middle of the burst is often observed as a consequence of phasic inhibition from the LP and the inferior cardiac (IC) neurons. This transient hyperpolarization divides the VD burst of into two parts. A comparison of firing patterns with corresponding ISI distributions of three different neurons is shown in Fig. 4. Note that only the short, intraburst ISIs are evaluated (i.e., the histograms are truncated and the “legs” corresponding to ISI vs. IBI and IBI vs. ISI are not shown). PD neurons in the normal bursting network display interspike intervals that can be divided into separate subpopulations (Fig. 4B). This histogram— obtained from ISIs of 230 successive bursts— contains well-separated peaks of decreasing amplitude. When compar-
FIG. 4. ISI patterns of 3 types of bursting pyloric neurons are characteristic and clearly distinguishable. Membrane potential of the 3 neurons was recorded simultaneously (A, D, and G). ISI histograms obtained from the intraburst spike time data of the same neurons are displayed in B, E, and H. The distribution of the PD neuron is multi-peaked (B), while those of the LP (E) and VD (H) neurons are smoother. ISI return maps of the same data are depicted in C, F, and I. A typical V-shaped structure appears in C, indicating precisely replicating ISI patterns of the PD neuron. The diffuse cloud in F demonstrates gradually increasing ISIs in the LP neuron. The most complex behavior is seen in the VD neuron (I).
J Neurophysiol • VOL
1367
89 • MARCH 2003 •
www.jn.org
1368
˝ CS, PINTO, RABINOVICH, ABARBANEL, AND SELVERSTON SZU
ing the ISI data with the intracellular waveforms, we find that the longest ISI (approximately 26 ms) corresponds to the interval between the first and second spike in the burst. Gradually decreasing ISIs correspond to the pairs of second and third, third and fourth, etc. spikes. The main peak (at 15 ms) is due to the numerous spikes produced with the shortest ISI duration at the top of the burst. The sharpness of the peaks in the ISI histogram indicates high reliability and reproducibility of spike timing in successive bursts, and in this respect, the PD neuron exceeds all the other type of pyloric neurons we studied (in normal saline and connectivity). In contrast with the PD neuron, the LP produces bursts with no distinguishable ISI subpopulations (Fig. 4E); the histogram contains a single slanted peak. The probability of spike generation during the burst is therefore a “smooth” function of ISI duration, there are no local maxima in the distribution above 30 ms, and gradually increasing ISIs are less and less likely to occur. The VD neuron generates more elongated bursts than the PD or the LP neurons. Strong inhibition from the LP and IC neurons results in a short local depression in the VD neuron bursts (Miller 1987) (Fig. 4G) with increased ISI duration. This results in a broad distribution of interspike intervals (Fig. 4H). The ISI histogram is similar to that of the LP neuron with a long tail and no separated peaks. In normal conditions, the LP and VD neurons exhibit partially overlapping bursts resulting in coincident mutual inhibition and interference during the generation of their spikes. The PD neuron, on the other hand, receives no inhibitory input during its spiking phase and development of its burst is primarily determined by the neuron’s intrinsic (rebound) properties. Return maps of the interspike intervals of bursting pyloric neurons revealed a wide variety of nonlinear structures called attractors (Debus and Sandkuhler 1996; Dekhuijzen and Bagust 1996; Fitzurka and Tam 1999). Remarkably, the structures were cell-specific and very reproducible among different preparations. The return maps of Fig. 4, C, F, and I, demonstrate the typical appearance of the ISI attractors for the three neuron types. We used large number of ISIs from stationary spike trains to construct these graphs (2,500 for the PD, 1,700 for the LP, and 7,250 for the VD neuron). The slanted V-shaped form of Fig. 4C was characteristic of normally bursting PD neurons (n ⫽ 25, numbers indicate the number of preparations). The right leg of the V is formed by a chain of compact point clusters. We find pairs of gradually decreasing interspike intervals here. The rightmost cluster corresponds to the ISI pairs among the first, second, and third spikes at the beginning of the PD burst. Analogously, the following cluster corresponds to the pair of ISIs among the second, third, and fourth spikes. The tip of the V-shape contains a very dense cluster, corresponding the spikes generated in the most depolarized part of the burst with the shortest ISI duration. The top-left part of the plot contains a tail-like cluster, which indicates gradually increasing ISIs. This behavior appears at the termination phase of the PD burst when ISI duration becomes prolonged. Clearly, the timing of the spikes is more reliable at the beginning of the PD burst than at the termination (see also Fig. 3A). The small extent of the burst-onset clusters indicates remarkably reproducible spike triplets and small jitter in spike generation (2–3 ms for the 1st 5 spikes). This type of V-shaped and clustered return map is typical only for the PD neurons when kept in normal physiological solution. Strong gastric modulation or J Neurophysiol • VOL
other extrinsic synaptic effects, however, often “smear” the sharp clusters, while leaving the V still recognizable. During CS episodes, however, the characteristic signature is completely destroyed (data not shown). The return map of the LP neuron (Fig. 4F) reveals different dynamics. Scattered points form a comet-like attractor all of which are above the diagonal of the map (n ⫽ 17). This shape indicates that interspike intervals are gradually increasing as the LP burst develops. The form is not divided into smaller clusters, hence, the timing of the actual spikes is not strongly influenced by the timing of past spikes. Spike generation is far more irregular than in the PD. Return maps of the VD neuron reflect the overall variability and rich repertoire of its firing pattern (Fig. 4I; n ⫽ 24). A V-shaped form is noticeable, similar to that of the PD neuron, but no sharp densities are seen. Furthermore, relatively long ISIs are often again followed by long ISIs (in the “saddle”), resulting in a large scattered cloud of points far from the tip of the V. There are also empty areas not visited by any points. Linear statistical analysis of the interspike intervals—the ISI histograms—show similar behavior in the LP and VD neurons. Return maps, alternatively, clearly distinguish the two neurons. The return maps are cell type specific in the normal functioning pyloric CPG and in many cases the neurons can be identified by observing their ISI return maps alone. The PD and LP neurons are the easiest to identify this way, while the VD neuron return maps show more variability between preparations. We refer to these maps and the underlying temporal structures as “interspike interval signatures” of the neurons. The ISI signatures depend on intrinsic as well as synaptic factors. As a result, these forms exhibit moderate variations among preparations even in similar experimental conditions. Figure 5 shows the ISI signatures of the three pyloric neuron from three different animals under identical experimental conditions in normal saline. While the number of clusters, their location and spread are variable, the shape of the attractor is clearly characteristic for the PD neurons (Fig. 5, A–C). The return map in Fig. 5B shows more scattered points than that in Fig. 5A. This is because, in this preparation, the PD neuron was receiving sporadic synaptic inputs. These synaptic inputs mostly appear as occasional excitatory postsynaptic potentials (EPSPs) on the PD voltage trace, reflecting baseline activity in the presynaptic cardiac sac network neurons or unidentified sources. In the return map in Fig. 5C, the clusters are elongated along the diagonal of the map. This occurred because in this preparation a stable, strong gastric mill modulation of the pyloric rhythm was present, and this resulted in the clusters of the PD neuron signature moving back and forth along the diagonal. The LP neuron exhibit the slanted comet-structure in all preparations (Fig. 5, D–F) and these maps do not change in the presence of irregular synaptic inputs or gastric modulation. As mentioned, the VD neuron shows the richest behavior with broad ISI distribution and scattered return maps (Fig. 5, G–I). Although the VD neuron return maps from different preparations show wide variation, they are easily distinguished from the signatures of other types of neurons. This feature helps the identification of the VD neuron even when its attractor is spread and “fuzzy.” In general, the observation of the ISI signatures indicates a robust, stationary, “healthy” pyloric CPG with intact synaptic interconnections.
89 • MARCH 2003 •
www.jn.org
INTERSPIKE INTERVAL SIGNATURES OF BURSTING NEURONS
1369
FIG. 5. Signatures of 3 pyloric neurons from 3 different preparations. Top: PD; middle: LP; bottom: VD. All data were recorded from stationary bursting neurons in normal saline. A typical V-shape and separated clusters are the most prominent features of the PD neuron (A–C). In B, the clusters are fuzzy, a sign of sporadic but weak synaptic inputs. Clusters in C are stretched parallel with the diagonal; this is an effect of strong underlying gastric modulation. LP neurons exhibit a comet-shaped (decelerating-type) return map in each preparation (D–F). The VD neuron shows the most variability in ISIs (G–I). Common features of VD neuron return maps are their spread and complex structure. The most structured return map is seen in H. Here the pyloric rhythm was relatively slow (1.2 Hz) and the VD neuron exhibited very strong bursts.
Reduced synaptic connectivity in the pyloric CPG affects the ISI patterns To test how synaptic inputs affect the fine structure of the firing patterns and ISI signatures, we compared spike trains of the pyloric neurons in normal conditions and when a large portion of the interconnecting synapses were blocked. Picrotoxin at 8 M concentration is an effective blocker of fast inhibitory glutamatergic connections in the pyloric CPG. Since many of the known inhibitory connections are glutamatergic, PTX application significantly reduces the connectivity of the network (Fig. 1B). The pyloric oscillation did not fail in the presence of PTX; the neurons still produced robust bursts of action potentials. Electrotonic and cholinergic connections not blocked by PTX were sufficient to sustain phase-locked pyloric oscillation, since the LP neuron was still inhibited by the PD neuron through cholinergic connections, and the VD neuron received electrotonic inhibition from the pacemaker neurons through the rectifying electrical connection. At the same time, the membrane potential traces changed considerably after blocking glutamatergic synapses (Fig. 6, A, D, and G). Typically, fast inhibitory postsynaptic potentials (IPSPs) disappeared and the oscillations became smoother. Changes in individual neurons were specific: the PD neuron was no longer inhibited by the LP and fast IPSPs were absent (Fig. 6A, cf. Fig. 4A). The burst envelope of the LP neuron became more symmetric and its plateau spiking was more prolonged (Fig. 6D). The prominent variations in the VD bursts were also J Neurophysiol • VOL
strongly reduced (no “saddle” was present because inhibition from the LP neuron was blocked; Fig. 6G). Picrotoxin, while removing IPSPs and smoothing the membrane potential waveforms, did not enhance the precision and reliability of intraburst ISI patterns. When comparing the ISI histograms and return maps of neurons in normal and PTXcontaining saline, we find less structured distributions (n ⫽ 15). The multi-peaked ISIH of the PD neuron in normal conditions turns into a narrower distribution with only two significant peaks (Fig. 6B). The return map reveals two slightly overlapping clusters plus the central density, the latter again corresponding to the rapid firing at the top of the burst (Fig. 6C). The ISI pattern of the LP neuron is reminiscent of that in normal saline (Fig. 4E) with a slanted ISI histogram (Fig. 6E) and comet-shaped return map (Fig. 6F; n ⫽ 14), except that the whole distribution shifts toward shorter values. The VD neuron firing pattern changes the most prominently. The structured and spread ISI return map seen in normal conditions (Fig. 4I) is lost, and a comet-shaped, LP-type form appears (Fig. 6I). Similarly, the ISI histogram is single-peaked with an exponential tail (Fig. 6H; n ⫽ 14). The primary effect of picrotoxin is the block of fast inhibitory connections, leading to a reduction of the complexity of the pyloric network. With decreased overall inhibition, most cells generate stronger bursts with shortened intervals between spikes. At the same time, the characteristic nonlinear signatures seen in normal conditions change in a neuron-specific manner: it is lost in the VD neuron, reduced in the PD neuron, and
89 • MARCH 2003 •
www.jn.org
1370
˝ CS, PINTO, RABINOVICH, ABARBANEL, AND SELVERSTON SZU
FIG. 6. Picrotoxin reshapes the ISI signatures of the neurons. This figure is analogous to Fig. 4 but here all glutamatergic synapses were blocked by 8 M PTX. The membrane potential traces of the pyloric neurons are smooth and there are no detectable postsynaptic potentials (A, D, and G). Spike time data show more uniform distribution of the ISIs in each neuron. The ISI histogram of the PD neuron (B) still contains a secondary peak but is much less complex than that in normal saline (Fig. 4B). The histograms of both the LP (E) and VD (H) neurons are single-peaked and sharp. ISI return maps of the same neurons altered differentially after the PTX block of fast inhibitory connections. The V-shaped form of the PD neuron is still identifiable; however, it is now more compact and the clusters are not clearly separated (C). The return map of the LP neuron (F) is similar to that in control (Fig. 4F). Changes in the ISI signature of the VD neuron are the most striking: the complex attractor of Fig. 4I turned into a narrow homogeneous cluster (I) similar to that of the LP (F).
remains essentially the same in the LP neuron. Since picrotoxin does not affect the intrinsic membrane properties and voltagegated conductances of the neurons, the observed changes in the ISI patterns are due to the loss of the fast synaptic interactions. ISI signature of the PD neuron with and without LP inhibition Differences in the data from neurons in normal and synaptically reduced circuits suggest the involvement of fast (glutamatergic) synaptic inputs in shaping intraburst ISI patterns. To test this hypothesis we compared the ISI patterns of a single postsynaptic neuron with and without incoming synaptic signals. Picrotoxin blocks all glutamatergic synapses in the pyloric network. The two electrically coupled PD neurons, however, receive inhibitory input only from the LP neuron. Therefore by hyperpolarizing the LP neuron below spike threshold, one can reversibly turn off the LP–PD synapse. A summary of the experiment is shown in Fig. 7. Spike arrival times of the PD neuron were continuously acquired while the LP neuron was hyperpolarized using –10 nA DC current injection. The hyperJ Neurophysiol • VOL
polarization was abandoned at t ⫽ 150 s into the experiment, and data acquisition was continued for another 200 s. As a first observation, the ISI sequence graph clearly demonstrates the increase of interburst intervals after the termination of the hyperpolarization (Fig. 7A). The burst cycle period (BCP) sequence of the PD neuron shows a similar behavior (Fig. 7B). Clearly, the LP neuron, by inhibiting the neurons of the pacemaker group, decreases pyloric cycle frequency in agreement with earlier observations (Ayali and Harris-Warrick 1999; Massabuau and Meyrand 1996). The sequential graphs (Fig. 7, A and B) also reveal two transients in the time series caused by cardiac sac (CS) activity, one of them appearing just after termination of the LP hyperpolarization. Also note that ongoing gastric mill rhythm results in periodic fluctuation in the pyloric BCP, consequently, the pyloric cycle frequency is not constant even in the absence of cardiac sac episodes. The grayscale density maps in Fig. 7 were constructed from stationary (CS-free) parts of the ISI sequence. The V-shaped PD signature is clearly present in both graphs, but with noteworthy differences. The LP-inhibited PD neuron exhibits a chain of three separated clusters in the return map, indicating
89 • MARCH 2003 •
www.jn.org
INTERSPIKE INTERVAL SIGNATURES OF BURSTING NEURONS
1371
configurations of the pyloric network by temporarily hyperpolarizing selected presynaptic components. The spike train of the postsynaptic PD neuron was recorded and analyzed while the presynaptic LP and VD neurons were hyperpolarized. Figure 8 shows the effects of changing presynaptic activity on the PD neuron signature. In normal conditions (all neurons functional) the PD displays a characteristic, V-shaped return map, although in this preparation the clusters are not clearly separated (Fig. 8B). Turning off the VD neuron alters the picture significantly, as three clusters are now sharply separated from the central density (Fig. 8C). To explain this behavior, we note that a robustly bursting VD neuron delivers strong inhibition to the LP neuron and simultaneously alters the PD’s activity through the electrotonic connection. The LP neuron tends to produce wide variations in burst spike number when receiving inhibition from the VD neuron. This irregular bursting of the LP neuron, in turn, acts as an irregularizing factor on the PD activity. As a result, when the VD neuron is quiescent, both the LP (Fig. 9, A and C) and the PD neurons produce more regular bursts and the ISI signature of the PD is
FIG. 7. Synaptic inhibition from the LP neuron affects pyloric frequency and regularizes the ISI patterns of the PD neuron. PD spike times were acquired for 350 s. The LP neuron was hyperpolarized below threshold using –10 nA current injection in the 1st part of the recording. PD neuron interspike intervals are shown in A. Interburst ISIs became prolonged after the LP neuron was released from hyperpolarization (t ⫽ 150 s). Burst cycle periods (BCPs) are also prolonged when LP inhibition on PD was present (B). The periodic fluctuation of BCP values is due to ongoing gastric modulation. “CS” indicates 2 cardiac sac episodes appearing after LP neuron hyperpolarization was abandoned. ISI return map density plots of the PD neuron show marked differences before (C) and after (D) releasing the LP. Clustering of the return map is more pronounced with LP inhibition present. Hence, spike timing is more reliable and the intraburst patterns more precisely replicating in D than in C.
precise interspike interval replication (Fig. 7D) and strong serial dependence. Spike timing of the same neuron is less reliable and the attractor is more spread out when the inhibitory synaptic input from the LP neuron is turned off (Fig. 7C). These data together with the results of the PTX experiments confirm that the timing of PD neuron intraburst spikes depends on incoming synaptic signals, even though the synaptic potentials from the LP neuron appear tens of milliseconds before the PD neuron burst begins. Various functional configurations of the pyloric neurons The LP, being the only neuron in the pyloric network that inhibits the PD neuron, plays an important role in shaping the PD’s firing pattern. Nevertheless, the characteristic PD signature might reflect the action of further, more complex synaptic interactions. To study this, we established various functional J Neurophysiol • VOL
FIG. 8. ISI signature of the PD neuron depends on synaptic inputs and network interactions. The activity of the PD neuron was recorded for 1,000 s, while the presynaptic LP and VD neurons were hyperpolarized below threshold. The VD was hyperpolarized from t ⫽ 250 to 750 s, LP was off from t ⫽ 500 to 930 s. The PD neuron ISI sequence plot (A) reveals changes in both interburst and intraburst ISIs during the selective hyperpolarization of the presynaptic cells. B: density distribution of the ISI return map of the PD in normal conditions while all cells functional. C–E: same type of graphs for the PD neuron in 3 reduced circuits (only VD hyperpolarized, both LP and VD hyperpolarized, and only LP hyperpolarized, respectively).
89 • MARCH 2003 •
www.jn.org
˝ CS, PINTO, RABINOVICH, ABARBANEL, AND SELVERSTON SZU
1372
FIG. 9. ISI signatures of the LP and VD neurons depend on their mutual inhibition. A and B: ISI sequential plots of the LP and VD neurons in a 1,000-s experiment. The LP neuron was hyperpolarized from t ⫽ 250 to 750 s (no ISI values during this period) while the VD neuron was turned off between t ⫽ 500 to 930 s. C and E: density distributions of the ISI return maps of the LP and VD neurons, when all the recorded neurons were bursting in normal conditions. D and F: same type of plots for the LP and VD when the presynaptic neuron was hyperpolarized. Both signatures shrunk and became more compact.
far more discrete with minimal cluster spread (Fig. 8C). This effect of hyperpolarizing the VD neuron is also shown by its reducing both the entropy and area of the PD return maps (Table 1). When the LP and VD are both hyperpolarized below threshold, the PD signature changes again. The sharp clustering is not observed and the interspike intervals are more evenly distributed in a narrow range. Under these conditions, the PD neuron receives no chemical inhibitory input, and in addition, is functionally disconnected from the VD neuron. This configuration allows us to study the intraburst firing pattern of the PD when almost completely isolated from the rest of the pyloric network. The return map reveals that the spike timing is less precise in these conditions than when the PD neuron receives inhibitory synaptic inputs (Fig. 8C). At the same time, the entropy is slightly lower than in normal conditions, when the VD and LP neurons are both firing (Fig. 8B; Table 1). Finally, when the VD neuron is released from hyperpolarization and the LP neuron is still held below threshold, the PD signature again slightly changes. The clusters are not clear and the attractor is scattered similarly to the isolated situation, but with even wider “legs.” Consequently, the VD neuron tends to irregularize the firing of the PD smearing its characteristic ISI signature. Thus TABLE
the observation of a V-shaped return map with compact clusters in PD indicates the presence of a robustly bursting, stationary LP neuron and a moderate or weak interference from the VD neuron. Intraburst firing patterns of the LP and VD neurons also depend on network interactions. These neurons generate overlapping bursts, and their mutual inhibition tends to increase the spike jitter within the bursts. This action is clearly shown in Fig. 9. Firing patterns of both neurons were recorded for 1,000 s. The LP neuron was hyperpolarized below spike threshold at t ⫽ 250 s while the activity of the VD neuron was recorded (Fig. 9, A and B). The LP was then released from hyperpolarization and the VD neuron was turned of by hyperpolarization. The density plots of ISI return maps from the postsynaptic neuron reveal significant changes when the presynaptic partner was hyperpolarized. In control, both neurons express the typical signatures, a comet-shaped form for the LP neuron (Fig. 9C) and a scattered, roughly triangular cloud for the VD neuron (Fig. 9E). When the presynaptic partners are hyperpolarized, the attractors shrink meaning that the scattered clouds develop into more dense clusters. Obviously, the “saddle” of the VD neuron is not present or greatly decreased when the LP
1. Changes in the statistical parameters of ISI return maps after functional removal of selected pyloric neurons LP Off
PD LP VD
VD Off
LP and VD Off
⌬H (%)
⌬a (%)
⌬H (%)
⌬a (%)
⌬H (%)
⌬a (%)
3.8 ⫾ 1.8 (8)* N/A ⫺11.3 ⫾ 5.3 (8)*
31.3 ⫾ 20.8 (6)* N/A ⫺43.8 ⫾ 23.9 (4)
⫺6.4 ⫾ 3.2 (8)* ⫺7.1 ⫾ 3.3 (5)* N/A
⫺37.6 ⫾ 21.3 (7)* ⫺35.9 ⫾ 13.2 (5)* N/A
⫺2.5 ⫾ 1.1 (4)* N/A N/A
7.9 ⫾ 39.3 (4) N/A N/A
Manipulation of the pyloric network affects the entropy (⌬H) and area (10% ⫺ threshold, ⌬a) of the return map density distributions. The data were calculated for the cells appearing in the leftmost column. Entropy increases indicate more irregular patterns like those produced by the PD neuron without LP inhibition. Entropies for the LP and VD neurons decrease when the partner neuron is turned off. Asterisks indicates significant differences at P ⬍ 0.05. The number of observations is indicated in parentheses. N/A appears when the neuron is held below spike threshold. J Neurophysiol • VOL
89 • MARCH 2003 •
www.jn.org
INTERSPIKE INTERVAL SIGNATURES OF BURSTING NEURONS
neuron is hyperpolarized below threshold. As a result, the intraburst ISI distribution becomes more even and smooth (Fig. 9F). Most points of the return map fall below the diagonal indicating a smoothly accelerating pattern during the burst. This feature is similar to that of a normal bursting PD neuron, but here no separated clusters are observed. With respect to the LP neuron, the long tail of the LP signature is greatly reduced when the VD neuron is turned off (Fig. 9D). Therefore spike timing is more precise when the LP neuron receives no input from the VD. Clearly, VD neuron activity strongly affects the deceleration phase of the LP burst. In this aspect, an elongated “tail” in the LP signature indicates the presence of a robustly bursting VD neuron in the preparation. This observation supports the explanation of the previous experiment when PD neuron activity was more regular without ongoing VD activity (Fig. 8C). Note that the return map of the LP neuron does not shrink after PTX application (Fig. 6F), because the VD to LP synapse is cholinergic. Summarized data of the experiments are shown in Table 1. Reduction in the entropy (⌬H) and the area of the return maps (⌬a) reflects the regularizing effect in the LP and VD activity when their counterpart is hyperpolarized below threshold. An opposite effect is seen in the PD neuron when the LP neuron is turned off. When both presynaptic neurons are hyperpolarized, the entropy is decreased to a lesser degree than when only the VD neuron is turned off. Here, the net entropy change is close to the algebraic sum of the relative changes of the only LP and only VD hyperpolarization cases. The relative changes in entropy following the manipulation of synaptic connectivity are small, typically ⬍10%. The areas changes more, but their SDs are higher. Using the dynamic clamp to simulate synaptic inhibition on PD To further test the involvement of fast (spike-mediated) synaptic inputs in shaping the ISI signatures of the pyloric neurons, we utilized the dynamic clamp (DCL) method. We were interested in determining whether simulated IPSPs delivered to synaptically isolated PD neurons could reproduce the LP-induced enhancement of spike timing precision seen in the current clamp experiments. We therefore generated artificial spike trains by computer containing bursts of spikes with time courses similar to those observed in real neurons. The artificial spike train waveform was then connected to PTX-treated PD neurons via simulated synapses using variable strengths and reversal potentials. The artificial spikes were designed to mimic those in real pyloric neurons, i.e., their shape and width was properly adjusted (see Fig. 10, AN traces). Interburst sections of the waveform were set to a constant voltage level of –50 mV. An important requirement was that the burst frequency of the artificial firing pattern matched the pyloric frequency ( fp) of the preparation. This latter parameter was typically not constant in time but slightly varied due to extrinsic inputs and rhythmic modulation (gastric mill; e.g., Fig. 7B) To obtain the most precise tracking of pyloric burst frequency and hence to deliver artificial bursts in the right phase, we used a trigger method. The PD neuron’s membrane potential waveform was continuously monitored and the termination of the burst was detected. A trigger condition occurred when the PD neuron’s membrane potential had fallen below a preset voltage J Neurophysiol • VOL
1373
level, typically – 45 mV (transition from the plateau to the hyperpolarized phase). This event triggered the delivery of the artificial burst and the generation of postsynaptic current. Parameters of the burst waveforms including spike number, posttrigger delay, and ISI distribution, as well as parameters of the DCL synapse (reversal potential, maximal conductance), were adjusted prior to the experiments. These experiment were, in several aspects, similar to those performed by Manor and Nadim (2001), but without real-time modeling of the presynaptic LP neuron. Results of three dynamic clamp experiments as well as the stimulation-free behavior of the PD neuron are illustrated in Fig. 10. The preparation was held in PTX-containing saline; hence, the natural inhibition from the LP neuron was blocked. Without stimulation, the density plot of the ISI return map was a V-shaped form with no clearly separated densities (Fig. 10B) similar to Fig. 7C. Next, we delivered a 6-spike burst waveform to the PD neuron via a simulated inhibitory connection (Fig. 10C). Large IPSPs appeared during the interburst hyperpolarization simulating an LP neuron type inhibition. The PD neuron’s membrane potential trace is displayed together with the inhibitory DCL current and the artificial spike train (middle pair of traces). Separation of clusters in the ISI return map is apparent in Fig. 10D as a result of the LP-type inhibition (note the similarity to Fig. 7, C and D). Next we changed the parameters of the artificial burst, while keeping the DCL synapse parameters as previously. A burst of four spikes separated by equal 20-ms ISIs was delivered to the PD neuron. The shape of the return map in PD changed slightly displaying two separated clusters and a longer burst-termination “tail.” Comparing this return map to the previous ones, we find that the clustering of ISIs at burst onset is more expressed than that in control (Fig. 10B), but less expressed than that during the LP-like inhibition (Fig. 10D). This observation indicates that ISI clustering depends on the strength of the synaptic inhibition. This strength-dependent regularization of intraburst firing of PD neurons was highly reproducible in the DCL experiments (n ⫽ 12). The last experiment performed with the same PD neuron was to test the effects of excitatory DCL stimulation. The reversal potential of the artificial synapse was set to –20 mV, hence, producing excitatory postsynaptic currents in the PD neuron (Fig. 10G). The attractor of the ISI return map contracted and the separated clusters disappeared, which indicates the loss of precisely replicating ISIs during the burst (Fig. 10H). Spike timing reliability with interburst excitation is even worse than when the PD neuron receives no inhibition at all (Fig. 10B). The emerging return map is similar to those seen in normal bursting LP neurons, a comet-like structure (Fig. 9C). DISCUSSION
The data presented here demonstrate synaptic modulation of the intraburst spike patterns of bursting neurons in the crustacean nervous system. This kind of modulation has not yet been studied in the pyloric pattern generating network or in other assemblies of robust bursting neurons. Electrical or PTX manipulation of the synaptic connectivity among pyloric neurons reshape the fine structure of the spike trains while affecting the frequency of bursting to a lesser degree. When using dynamic clamp stimulation of the bursting PD neuron, we observe modulations of the intraburst firing patterns similar to those
89 • MARCH 2003 •
www.jn.org
1374
˝ CS, PINTO, RABINOVICH, ABARBANEL, AND SELVERSTON SZU
FIG. 10. Simulated synaptic inhibition to the PD neuron regularizes its ISI patterns and reproduces the ISI signature found in intact pyloric networks. Control data and results of 3 dynamic clamp experiments are shown. The natural LP to PD inhibition was blocked by PTX. In A, no current was injected into the PD neuron (the dynamic clamp current, IPD was a constant 0). Membrane potential of the artificial neuron AN was also constant at –50 mV. B: return map density of the noninhibited PD neuron. In C, the PD was inhibited via simulated chemical synapse (gsyn ⫽ 250 nS, Vrev ⫽ ⫺80 mV). The presynaptic AN was set to generate a 6-spike decelerating-type burst waveform. Note the pronounced inhibitory postsynaptic potentials (IPSPs) in the PD neuron. The simulated inhibitory input reproduced the ISI signature of the PD neuron with natural LP-inhibition (D). In E, the intraburst pattern of AN was changed into a 4-spike burst with equal 20-ms intervals between spikes. The resulting return map of the PD neuron (F) is less clustered than that in D. Finally, the reversal potential of the simulated synapse was changed to Vrev ⫽ –20 mV, resulting in excitatory postsynaptic potentials (EPSPs) in the PD neuron (G). The ISI signature of the PD is now lost, and the return map displays no clustering (H).
observed with natural LP neuron inhibition. This again indicates the significance of phasic synaptic inputs in shaping the fine temporal structure of the postsynaptic firing pattern. ISI signatures: classification and characterization Membrane potential waveforms of the same type of pyloric neurons are remarkably consistent among different preparations. Moreover, bursts of a single neuron are replicated with high reliability when transient synaptic inputs (e.g., CS episodes) are not interfering with the ongoing pyloric oscillation. Hence, careful observation of the membrane potential traces is often sufficient to identify the neurons. At the same time, it is difficult to quantify the visual clues which help identify a neuron in the pyloric CPG. This is a general problem in the neurophysiology of bursting neurons. To classify and characterize neural bursters, ISI return maps present a very efficient and straightforward solution revealing how the neurons fire inside their bursts. Our analysis of the pyloric bursters showed that not only the membrane potential waveforms, but also intraburst firing patterns are reproducible and cell-specific J Neurophysiol • VOL
among different preparations. The ISI signatures appear in stationary bursting pyloric preparations, when interfering synaptic episodes are absent. In this aspect, the observation of the ISI signatures clearly indicates the good condition and stable function of the component neurons. Voltage-clamp studies on pyloric neurons showed that they have their own ion current signature by which they can be uniquely identified (Hartline and Graubard 1991). The authors suggested that the existence of such signatures or fingerprints indicate the individual functionality and characteristics of each stomatogastric cell. The existence of ISI signatures further support this idea and they offer a direct link between the intrinsic, biophysical properties of the neurons and their firing dynamics. The ISI return map is a sensitive and accurate quantitative metric of the temporal structure within bursts unlike other, more gross parameters of the neuronal activity such as burst spike number and mean intraburst spike frequency. This is because the return map clearly shows the mutual relations between successive spike events and their exact timing. Naturally we observe variations in the number and location
89 • MARCH 2003 •
www.jn.org
INTERSPIKE INTERVAL SIGNATURES OF BURSTING NEURONS
of clusters in the return maps of the same neuron from different preparations. Hence, it is challenging to “average” return maps or derive single statistical measures, which properly characterize the shape and spread of the attractors. In practice, visual observation of the signatures can quickly inform the experimenter as to the condition of the recorded neuron as well as the synaptic inputs. In this article, we utilized two statistical measures of the randomness of the return maps: the entropy and the 10% threshold area. While both these parameters indicated significant effects in the ISI patterns following manipulation of the synaptic connectivity, visual comparison of the return maps was more expressive. In our experience, the entropy performed better in characterizing the compactness of return maps and the regularity of intraburst spiking. The return map technique we utilized is a widely used tool of nonlinear dynamics. The main use of the method is phasespace reconstruction of a nonlinear dynamical system to obtain information on the underlying dynamics producing the observed time series (Abarbanel 1996). One of the benefits of the ISI return map method is that we can display a large number of successive spike events in a convenient format and quickly determine the degree of regularity or periodicity in the underlying firing patterns (Dekhuijzen and Bagust 1996). Points concentrating in compact densities indicate precisely replicating patterns and strong serial dependence of interspike intervals (like in the PD neuron). As we demonstrated, the return map technique provides an additional tool for identifying neurons of the pyloric circuit and possibly in a wide range of oscillating neural networks. This technique does not need intracellular recording of the neurons, only the reliable detection of their spikes (i.e., units in extracellular recording). While the interspike interval patterns of pyloric neurons were not described before, those of thalamic bursters have been receiving increasing attention (Magnin et al. 2000; Radhakrishnan et al. 1999; Zirh et al. 1998). These studies have revealed characteristic, cell- and conductance-specific features in the intraburst firing patterns of thalamic neurons, which can be used in the classification of the neurons and behavior-related events. The time course of bursts in thalamocortical nerve cells are similar to those in pyloric neurons, specifically, decelerating (LP-like) and accelerating/decelerating (parabolic, PDlike) bursts have been observed (Zirh et al. 1998). Joint interspike interval (return map) analysis of thalamocortical firing patterns are not yet available; however, this method might reveal signatures as we saw with pyloric neurons. Synaptic inputs reshape the ISI signatures of pyloric neurons Our observations demonstrate that synaptic inputs influence the temporal patterns of intraburst spikes in pyloric neurons. The ISI return maps offer a very sensitive method to quantify these changes. The experimenter can quickly obtain information on the functional state and synaptic environment of the cells. Under normal conditions, the LP and the VD neurons receive phasic synaptic inputs during their plateau potentials. These inputs affect the interspike interval patterns of the LP and VD neurons and result in broad ISI distributions with scattered return maps. The PD neuron, alternatively, receives IPSPs (from the LP) only during its hyperpolarized periods. However, the preburst IPSPs influence the intraburst ISI-patterns of the PD neuron in a manner that depends on the strength J Neurophysiol • VOL
1375
and timing of IPSPs. We note that the IPSPs precede the PD burst by a long duration, typically more than 50 ms. Further experiments are required to explain how IPSPs during the interburst hyperpolarization can affect the timing of PD spikes in the PD neuron tens of milliseconds later. However, we point out a clear difference between the voltage behavior of PD neurons with and without inhibition; IPSPs cause additional hyperpolarization in the PD neuron’s membrane potential. Lower level of the postsynaptic Vm results in changes in the function of voltage-gated ionic channels, particularly in the activation properties of Na, Ca, and transient (A-type) K channels (Graubard and Hartline 1991; Hartline and Graubard 1991). With more negative membrane potential preceding the burst, the amount of de-inactivated channels is higher than without IPSPs. The transient K-current (IA) may play a particularly important role, as the burst onset is slower and spiking delay is longer when the burst is preceded by larger hyperpolarization (Hartline and Graubard 1991). Alternatively, when the PD neuron receives EPSPs during its interburst periods, the activation properties of the channels change in the opposite direction. Careful observation of the membrane potential trace of the PD neuron shows that a slower burst onset results in more clustered return maps than when the rising phase is rapid (Fig. 10E vs. Fig. 10G). It is therefore most likely that ISI signatures of intraburst spike patterns are the outcome of a complex dynamic interplay between voltage-dependent gating processes and synaptic inputs. Clearly, there is a strong relationship between the shape or “envelope” of the bursts and the temporal patterns of intraburst spikes. On the other hand, burst envelope and spike number are strongly determined by the rebound properties of the neuron (Aizenman and Linden 1999; Fan et al. 2000). Given the power of ISI return maps to classify neural bursters and the effects of their synaptic inputs, they can be equally efficient in checking and fine-tuning mathematical models of bursting neurons. Indeed, the return maps can be constructed for model neurons the same way as is done with biological neurons (Fig. 11 in Szu˝ cs et al. 2001). Our earlier data show that fine changes in parameters of such model neurons dramatically reshape their ISI signatures; consequently, this method can contribute to the development of more realistic models of neurons. ISI signatures: considerations of functional significance Bursts play an important role in sensory processing. Oscillatory neural activity has been described in auditory (Lewicki 1996; Phillips and Sark 1991) and olfactory (Reisert and Matthews 2001) systems. Thalamocortical neurons are known to be capable of producing tonic spiking as well as robust burst oscillations. The sensory and behavioral significance of the bursting and the fine temporal structure of spike trains in such circuits is being extensively investigated (Fanselow et al. 2001; Overton and Clark 1997). The problem is important, because intraburst spikes can, in principle, encode much faster changes in the input than the burst. On the other hand, temporally structured bursts can result in precise and fine-tuned motor output and behavior (Chi and Margoliash 2001). In experiments involving pulse-train stimulation, Hooper (1998) found that PY neurons were capable of adjusting their burst parameters in a pattern-sensitive manner. PY neurons,
89 • MARCH 2003 •
www.jn.org
1376
˝ CS, PINTO, RABINOVICH, ABARBANEL, AND SELVERSTON SZU
therefore, are capable of encoding slow temporal patterns into a neural code (Golowasch et al. 1999). Our observations suggest that pyloric dilator neurons might use even more sophisticated strategies to reflect the activity of presynaptic neurons. Temporal parameters of the bursts (like burst delay and duty cycle) can be used to encode slow-varying input patterns, while properties of intraburst ISI patterns (timing of single spikes) can be used to encode fast phasic signals. The input sensitivity of the PD neurons that we found indicates a “smart” way of temporal processing that might not be readily expected in assemblies of robust bursting neurons with a dedicated function of motor control. In the pyloric network of the lobster, the spikes are used to control muscle contractions as well as to interact with other pyloric, gastric, and various extrinsic neurons. Clearly, postsynaptic neurons respond to inputs much faster than the muscles; hence, they can detect and respond to fine changes in the interspike interval patterns of the presynaptic bursters. Moreover, the synaptic modulation of intraburst spike patterns suggests a general mechanism, which might be used in a wide range of neural networks including sensory ones. Since the ionic conductances responsible for the rebound behavior are common in a wide range of neurons, it is not surprising to find synaptic modulation of their intraburst firing similar to that observed in the pyloric neurons. The question, whether bursts are units of neural information (Lisman 1997) or whether their internal structure also plays an important role in the function of the networks, needs to be investigated in further experiments involving various preparations. Our present data, nonetheless, clearly show that lobster pyloric neurons express remarkable flexibility, rich dynamical behavior, and input sensitivity in their bursts. Support for this work came from the U.S. Department of Energy, Office of Basic Energy Sciences, Division of Engineering and Geosciences, under Grants DE-FG03-90ER14138 and DE-FG03-96ER14592; from the Office of Naval Research under Grant N00014-00-1-0181; from the National Science Foundation under Grant PHY0097134; from the National Institutes of Health under Grants R01 NS-40110-01A2 and 1RO1 NS-40110; and from the Army Research Office under Contract DAAD19-01-1-0026. R. D. Pinto was supported by the State of Sao Paulo Research Foundation (FAPESP). REFERENCES Abarbanel HDI. Analysis of Observed Chaotic Data. New York: SpringerVerlag, 1996. Aizenman CD and Linden DJ. Regulation of the rebound depolarization and spontaneous firing patterns of deep nuclear neurons in slices of rat cerebellum. J Neurophysiol 82: 1697–1709, 1999. Ayali A and Harris-Warrick RM. Interaction of dopamine and cardiac sac modulatory inputs on the pyloric network in the lobster stomatogastric ganglion. Brain Res 794: 155–161, 1998. Ayali A and Harris-Warrick RM. Monoamine control of the pacemaker kernel and cycle frequency in the lobster pyloric network. J Neurosci 19: 6712– 6722, 1999. Bidaut M. Pharmacological dissection of pyloric network of the lobster stomatogastric ganglion using picrotoxin. J Neurophysiol 44: 1089 –1101, 1980. Brezina V, Orekhova IV, and Weiss KR. The neuromuscular transform: the dynamic, nonlinear link between motor neuron firing patterns and muscle contraction in rhythmic behaviors. J Neurophysiol 83: 207–231, 2000. Chi Z and Margoliash D. Temporal precision and temporal drift in brain and behavior of zebra finch song. Neuron 32: 899 –910, 2001. Clemens S, Combes D, Meyrand P, and Simmers J. Long-term expression of two interacting motor pattern-generating networks in the stomatogastric system of freely behaving lobster. J Neurophysiol 79: 1396 – 1408, 1998. J Neurophysiol • VOL
Debus S and Sandkuhler J. Low dimensional attractors in discharges of sensory neurons of the rat spinal dorsal horn are maintained by supraspinal descending systems. Neuroscience 70: 191–200, 1996. Dekhuijzen AJ and Bagust J. Analysis of neural bursting: nonrhythmic and rhythmic activity in isolated spinal cord. J Neurosci Methods 67: 141–147, 1996. Fan YP, Horn EM, and Waldrop TG. Biophysical characterization of rat caudal hypothalamic neurons: calcium channel contribution to excitability. J Neurophysiol 84: 2896 –2903, 2000. Fanselow EE, Sameshima K, Baccala LA, and Nicolelis MA. Thalamic bursting in rats during different awake behavioral states. Proc Natl Acad Sci USA 98: 15330 –15335, 2001. Faure P, Kaplan D, and Korn H. Synaptic efficacy and the transmission of complex firing patterns between neurons. J Neurophysiol 84: 3010 –3025, 2000. Fitzurka MA and Tam DC. A joint interspike interval difference stochastic spike train analysis: detecting local trends in the temporal firing patterns of single neurons. Biol Cybern 80: 309 –326, 1999. Golowasch J, Manor Y, and Nadim F. Recognition of slow processes in rhythmic networks. Trends Neurosci 22: 375–377, 1999. Graubard K. Synaptic transmission without action potentials: input-output properties of a nonspiking presynaptic neuron. J Neurophysiol 41: 1014 – 1025, 1978. Graubard K and Hartline DK. Voltage clamp analysis of intact stomatogastric neurons. Brain Res 557: 241–254, 1991. Hartline DK and Graubard K. Cellular and synaptic properties in the crustacean stomatogastric nervous system. In: Dynamic Biological Networks: The Stomatogastric Nervous System, edited by Harris-Warrick RM, Marder E, Selverston AI, and Moulins M. Cambridge, MA: MIT Press, 1991, p. 32– 85. Hooper SL. Phase maintenance in the pyloric pattern of the lobster (Panulirus interruptus) stomatogastric ganglion. J Comput Neurosci 4: 191–205, 1997. Hooper SL. Transduction of temporal patterns by single neurons. Nat Neurosci 1: 720 –726, 1998. Hooper SL and Weaver AL. Motor neuron activity is often insufficient to predict motor response. Curr Opin Neurobiol 10: 676 – 682, 2000. Johnson BR, Peck JH, and Harris-Warrick RM. Amine modulation of electrical coupling in the pyloric network of the lobster stomatogastric ganglion. J Comp Physiol [A] 172: 715–732, 1993. Lewicki MS. Intracellular characterization of song-specific neurons in the zebra finch auditory forebrain. J Neurosci 16: 5854 –5863, 1996. Lisman JE. Bursts as a unit of neural information: making unreliable synapses reliable. Trends Neurosci 20: 38 – 43, 1997. Magnin M, Morel A, and Jeanmonod D. Single-unit analysis of the pallidum, thalamus and subthalamic nucleus in parkinsonian patients. Neuroscience 96: 549 –564, 2000. Manor Y and Nadim F. Synaptic depression mediates bistability in neuronal networks with recurrent inhibitory connectivity. J Neurosci 21: 9460 –9470, 2001. Marder E. Computational dynamics in rhythmic neural circuits. Neuroscentist 3: 295–302, 1997. Marder E and Calabrese RL. Principles of rhythmic motor pattern generation. Physiol Rev 76: 687–717, 1996. Marder E and Eisen JS. Transmitter identification of pyloric neurons: electrically coupled neurons use different transmitters. J Neurophysiol 51: 1345–1361, 1984. Massabuau JC and Meyrand P. Modulation of a neural network by physiological levels of oxygen in lobster stomatogastric ganglion. J Neurosci 16: 3950 –3959, 1996. Miller JP. Pyloric mechanisms. In: The Crustacean Stomatogastric Nervous System, edited by Selverston AI and Moulins M. Berlin: Springer-Verlag, 1987, p. 109 –145. Morris LG and Hooper SL. Muscle response to changing neuronal input in the lobster (Panulirus interruptus) stomatogastric system: slow muscle properties can transform rhythmic input into tonic output. J Neurosci 18: 3433–3442, 1998. Morris LG, Thuma JB, and Hooper SL. Muscles express motor patterns of non-innervating neural networks by filtering broad-band input. Nat Neurosci 3: 245–250, 2000.
89 • MARCH 2003 •
www.jn.org
INTERSPIKE INTERVAL SIGNATURES OF BURSTING NEURONS Mulloney B and Selverston AI. Organization of the stomatogastric ganglion in the lobster. I. Neurons driving the lateral teeth. J Comp Physiol 91: 1–32, 1974. Nadim F, Manor Y, Kopell N, and Marder E. Synaptic depression creates a switch that controls the frequency of an oscillatory circuit. Proc Natl Acad Sci USA 96: 8206 – 8211, 1999. Nagy F and Moulins M. Extrinsic inputs. In: The Crustacean Nervous System, edited by Selverston AI and Moulins M. Berlin: Springer-Verlag, 1987, p. 205–262. Nusbaum MP, Blitz DM, Swensen AM, Wood D, and Marder E. The roles of co-transmission in neural network modulation. Trends Neurosci 24: 146 –154, 2001. Overton PG and Clark D. Burst firing in midbrain dopaminergic neurons. Brain Res Brain Res Rev 25: 312–334, 1997. Parzen E. On estimation of a probability density function and mode. Ann Math Stats 33: 1065–1076, 1962. Phillips DP and Sark SA. Separate mechanisms control spike numbers and inter-spike intervals in transient responses of cat auditory cortex neurons. Hear Res 53: 17–27, 1991. Pinto RD, Elson RC, Szu˝ cs A, Rabinovich MI, Selverston AI, and Abarbanel HD. Extended dynamic clamp: controlling up to four neurons using a single desktop computer and interface. J Neurosci Methods 108: 39 – 48, 2001. Radhakrishnan V, Tsoukatos J, Davis KD, Tasker RR, Lozano AM, and Dostrovsky JO. A comparison of the burst activity of lateral thalamic neurons in chronic pain and non-pain patients. Pain 80: 567–575, 1999. Raper JA. Nonimpulse-mediated synaptic transmission during the generation of a cyclic motor program. Science 205: 304 –306, 1979. Reisert J and Matthews HR. Responses to prolonged odour stimulation in frog olfactory receptor cells. J Physiol 534: 179 –191, 2001. Rogers RF, Runyan JD, Vaidyanathan AG, and Schwaber JS. Information theoretic analysis of pulmonary stretch receptor spike trains. J Neurophysiol 85: 448 – 461, 2001.
J Neurophysiol • VOL
1377
Russell DF and Hartline DK. Slow active potentials and bursting motor patterns in pyloric network of the lobster, Panulirus interruptus. J Neurophysiol 48: 914 –937, 1982. Sanderson AC and Kobler B. Sequential interval histogram analysis of non-stationary neuronal spike trains. Biol Cybern 22: 61–71, 1976. Segundo JP, Sugihara G, Dixon P, Stiber M, and Bersier LF. The spike trains of inhibited pacemaker neurons seen through the magnifying glass of nonlinear analyses. Neuroscience 87: 741–766, 1998. Selverston AI and Moulins M. The Crustacean Nervous System. Berlin: Springer-Verlag, 1987. Sharp AA, O’Neil MB, Abbott LF, and Marder E. The dynamic clamp: artificial conductances in biological neurons. Trends Neurosci 16: 389 –394, 1993. Snider RK, Kabara JF, Roig BR, and Bonds AB. Burst firing and modulation of functional connectivity in cat striate cortex. J Neurophysiol 80: 730 –744, 1998. Stein PSG, Grillner S, Selverston AI, and Stuart DG. Neurons, Networks and Motor Behavior. Cambridge, MA: MIT Press, 1997. Swensen AM and Marder E. Modulators with convergent cellular actions elicit distinct circuit outputs. J Neurosci 21: 4050 – 4058, 2001. Szu˝ cs A, Elson RC, Rabinovich MI, Abarbanel HD, and Selverston AI. Nonlinear behavior of sinusoidally forced pyloric pacemaker neurons. J Neurophysiol 85: 1623–1638, 2001. Thuma JB and Hooper SL. Quantification of gastric mill network effects on a movement related parameter of pyloric network output in the lobster. J Neurophysiol 87: 2372–2384, 2002. Tock Y and Inbar GF. Information-theoretical analysis of sensory information. In: Modern Techniques in Neuroscience Research, edited by Windhorst U and Johansson H. Heidelberg: Springer-Verlag, 1999, p. 546 –572. Zirh TA, Lenz FA, Reich SG, and Dougherty PM. Patterns of bursting occurring in thalamic cells during parkinsonian tremor. Neuroscience 83: 107–121, 1998.
89 • MARCH 2003 •
www.jn.org