MASTER THESIS AT THE UNIVERSITY OF HAGEN IN THE STUDY PROGRAM “PRACTICAL INFORMATION SCIENCE”
Synchronizing Web-based 3D Information Visualization and Heterogeneous Data Sources
BY CHRISTIAN DANOWSKI-BUHREN MATRICULATION NUMBER: 9523162
ADVISOR: PROF. DR.-ING. MATTHIAS HEMMJE CO-ADVISOR: PROF. DR. WOLFRAM SCHIFFMANN CO-ADVISOR: PROF. DR. BENNO SCHMIDT
ESSEN, 03RD OF OCTOBER 2016
Assignment The IVIS Reference Model represents a sequence of transformations from abstract source data to visualization objects and views. Users can be allowed to change certain transformation parameters and thus create alternating visualization objects from the same abstract source data. However, the reverse transformation from visualization objects to source data is not explicitly considered within the model. With regard to current challenges in the field of Big Data, where large datasets might be distributed over several syntactical and/or semantically different data sources, the IVIS Reference Model reveals further deficits. It neglects the explicit embedment of multiple heterogeneous data sources and how data is retrieved from them. In conclusion, a refinement of the IVIS Reference Model is desirable, covering the aspects of Big Data and bidirectional transformations. In particular, the reverse transformation from visualization objects to source data is of high relevance enabling users to modify data instances within their visual interface and persist the changes within the data sources. Hence, the central task of the thesis is to establish a Web-based IVIS infrastructure capable of synchronizing between heterogeneous data sources and Information Visualization. For this reason, suitable state-of-the-art technologies and approaches should be identified and coupled within a prototypical implementation. In addition, the concept of a bidirectional visualization pipeline should be reflected within an extended version of the IVIS Reference Model. With respect to the user interface, a 3D interface should be focused. As promising and standardized format, the X3D (eXtensible 3D) Scene Description Language allows the creation and manipulation of 3D scenes. It is based on the predecessor VRML (Virtual Reality Modelling Language) and uses XML-syntax for scene description. Considering the support of multiple heterogeneous data sources, the mediator-wrapper pattern should be employed to provide a single homogeneous access interface for each syntactical and/or semantically different data source. The conceptualized IVIS infrastructure may be based on those two restrictions, employing the mediator-wrapper architecture and using X3D for the user interface. Despite those constraints, it is desirable to design a generic IVIS infrastructure being able to adapt to diverse application scenarios and visual outputs. Thus, the components of the infrastructure should be kept generic in order to allow users to configure it to their personal needs. The main functionalities with regard to a bidirectional visualization pipeline are:
Server Side Information Visualization: Domain data is queried from one or more data sources and visualized as X3D scene. Special attention shall be paid to the mapping between abstract source data and derived visualization objects.
Runtime Information Visualization: o Request Additional Data: Additional domain data should be retrieved and visualized as X3D scene elements that can be integrated into an already existing scene. o Client-triggered Modification: Any modification of data instances performed by any client should also be applied to the data source, making the modifications persistent.
Synchronization: Clients have to be notified about changes within the data sources. If necessary, the modified data instances have to be transformed into visualization objects and delivered to all affected clients to maintain a synchronized and consistent state.
A similar IVIS infrastructure was developed in 1990 by Leissler et al. They used VRML and the Java programming interface EAI (External Authoring Interface) to establish a database-driven IVIS infrastructure capable of visualizing and modifying data instances stored in a relational database. One aim of the thesis should be to consider the technological progress and identify, which state-of-the-art technologies are applicable to develop a contemporary prototypical IVIS infrastructure. In particular, this implies technologies within the fields of Web protocols and 3D user interface. The resulting prototype should be compared to the implementation of Leissler et al.
Sworn Declaration Name:
Christian Danowski-Buhren
Matriculation Number:
9523162
Course of Study:
Practical Information Science
Module:
Master Thesis
I declare that I have developed and written the enclosed Master Thesis with title Synchronizing Web-based 3D Information Visualization and Heterogeneous Data Sources completely by myself, and have not used sources or means without declaration in the text. Any thoughts from others or literal quotations are clearly marked. The declaration of independent work also applies to drawings and sketches as well as other graphical representations. The Master Thesis was not used in the same or in a similar version to achieve an academic grading or is being published elsewhere. By including a digital copy of the final version of the Thesis I recognise that it will be checked for plagiarism and stored only for examination purposes.
(Location and Date)
(Christian Danowski-Buhren)
Acknowledgement My thanks go to everyone that helped me during this Master thesis with either technical advice or personal support. Special thanks go to my advisors Prof. Dr.-Ing. Matthias Hemmje, Prof. Dr. Benno Schmidt, with whom I had constructive discussions about outline and content of the thesis. Moreover, I would like to thank Prof. Dr. Wolfram Schiffmann for being Co-Advisor. My gratitude also goes to all proof-readers, who sacrificed their free time to make this thesis as faultless as possible. My very special thanks goes to my wife, Annika Buhren, who was always understanding when I spent hours writing and implementing instead of spending time with her.
Abstract The usage of Web-based 3D information visualization (IVIS) has been growing over the last few years. By providing cognitive efficient visualizations with direct manipulative interactions for analytic purposes, information visualization aids domain experts to fully exploit their domain knowledge and gain insight. As widely accepted visualization pipeline, the IVIS Reference Model embodies the necessary transformations to derive visualizations from abstract data. However, current challenges in the fields of Big Data as well as growing needs for more data interaction and modification (keywords Web 2.0, The Participative Web or user-generated content) reveal deficits within the visualization pipeline. As it was conceived for single data sources and unidirectional transformations from source data to views, it neglects the explicit support of heterogeneous data sources in Big Data scenarios as well as the consideration of dynamic data. In consequence, this thesis presents a bidirectional refinement of the IVIS Reference Model allowing dynamic data to be distributed over several data sources. Moreover, a reverse transformation from view to source data is employed, which enables users to modify data instances through a visual interface and make the changes persistent at the data sources. The overall goal of the presented approach is to establish an IVIS infrastructure based on state-of-the-art technologies and concepts to enable the Web-based synchronization of heterogeneous data sources and information visualization. In addition to user-driven modifications, this also implies a broadcast of changes within the data sources to all affected clients in order to update their local visualizations and maintain a consistent informational state at all parties. The abstract conceptualization and modelling of the proposed IVIS infrastructure is accompanied by a prototypical implementation based on contemporary technologies such as X3D/X3DOM for client-side visualization and the WebSocket protocol for bidirectional communication. In particular, the implementation is based on the mediatorwrapper pattern, which provides a homogeneous access interface for heterogeneous data sources. With the help of an exemplar application scenario, the developed IVIS infrastructure is evaluated.
Table of Contents List of Figures .................................................................................................................. V List of Tables................................................................................................................... VI List of Listings .............................................................................................................. VII List of Abbreviations....................................................................................................... IX 1.
Introduction and Motivation ................................................................................... 11 1.1
2.
1.1.1
Justification of Web- and 3D User Interfaces ........................................... 12
1.1.2
Data Characteristics .................................................................................. 14
1.1.3
User-Oriented Characteristics ................................................................... 16
1.1.4
Use Case Characteristics ........................................................................... 16
1.1.5
Technology-driven and Application-driven Motivation ........................... 17
1.2
Problem Statement ........................................................................................... 19
1.3
Research Questions and Objectives ................................................................. 20
1.4
Aim and Outline of the Thesis ......................................................................... 22
State-of-the-Art and Related Work ......................................................................... 24 2.1
Scientific State-of-the-Art ................................................................................ 24
2.1.1
IVIS Reference Model .............................................................................. 24
2.1.2
Mediator-Wrapper Architecture ................................................................ 25
2.2
3.
Motivation ........................................................................................................ 12
Technical State-of-the-Art ................................................................................ 28
2.2.1
Web-based 3D Information Visualization ................................................ 28
2.2.2
Modern Web Protocols for Bidirectional Communication ....................... 34
2.3
Related Work .................................................................................................... 35
2.4
Discussion and Remaining Challenges ............................................................ 40
Conceptualization and Modelling ........................................................................... 43 3.1
Bidirectional Extension supporting Dynamic Data .......................................... 43 I
3.2
Design and Conceptual System Architecture ................................................... 45
3.3
Abstract Description of Functional Features .................................................... 47
3.3.1
Server Side Information Visualization ...................................................... 47
3.3.2
Runtime Information Visualization........................................................... 48
3.3.3
Synchronization / Server-side Broadcast .................................................. 51
3.4 4.
Summary .......................................................................................................... 53
Specification and Proof-of-Concept Implementation ............................................. 54 4.1
General Implementation Goals and Requirements ........................................... 54
4.2
Choice of Base Technologies ........................................................................... 55
4.2.1
Server Side Technologies.......................................................................... 55
4.2.2
Client Side Technologies .......................................................................... 58
4.3
System Architecture ......................................................................................... 59
4.3.1
Instantiation of Conceptual System Architecture ..................................... 59
4.3.2
Interfaces of the IVIS Infrastructure ......................................................... 61
4.4
Project Layout and Configuration .................................................................... 63
4.4.1
Project Structure ........................................................................................ 63
4.4.2
Server-Side Configuration of Spring, SockJS and STOMP broker .......... 63
4.5
Semantic Integration – Mediation between Heterogeneous Data Sources ....... 66
4.5.1
Identifying Wrappers by XPath Selector Against Global XML Schema . 66
4.5.2
Compose Subqueries for an Aggregated Object ....................................... 67
4.5.3
Mapping Between Global and Local Selector .......................................... 69
4.6
Dynamic Aspects of Core Functional Features ................................................ 70
4.6.1
Server Side Information Visualization – Initial X3DOM Visualization ... 71
4.6.2
Runtime Information Visualization – Visualize Additional Data ............. 74
4.6.3
Runtime Information Visualization – Modify Data Instance .................... 77
4.6.4
Synchronization – Notify Clients about Content Update.......................... 79 II
4.7 5.
Summary .......................................................................................................... 84
Evaluation ............................................................................................................... 86 5.1
Prototypical Evaluation Scenario – Bookstore Application ............................. 86
5.1.1
Functional and Visual Description of the Bookstore Application ............ 86
5.1.2
Data Model and Mapping Definitions....................................................... 87
5.1.3
Client-Side Configuration ......................................................................... 93
5.1.4
Cognitive Walkthrough of Core Features ................................................. 95
5.2
Comparison to Implementation of Leissler et al. ............................................. 98
5.3
Summary .......................................................................................................... 99
6.
Conclusion ............................................................................................................ 100
7.
Discussion and Outlook ........................................................................................ 105
Appendix ....................................................................................................................... 108 A)
X3D Thematic World Sphere Web Application ............................................ 108
B)
Synchronisation Event Processing Workflow ................................................ 109
C) Exemplary GlobalSchemaToWrapperMapping.xml File for Bookstore Application ................................................................................................................ 110 D)
Exemplary XmlWrapper Configuration File for Bookstore Application ....... 114
E)
Exemplary CsvWrapper Configuration File for Bookstore Application........ 116
F)
Exemplary DatabaseWrapper Configuration File for Bookstore Application118
G)
Generated X3DOM Representation of an exemplar Book Instance .............. 120
H)
Client-side Configuration - Connecting to the IVIS Infrastructure ................ 122
I)
Bookstore Application – Initial Page Load ........................................................ 124
J)
Bookstore Application – Filtered Visualization................................................. 125
K)
Bookstore Application – Visualizing all Book Stocks ................................... 126
L)
Bookstore Application – Retrieve Additional Data........................................ 127
M)
Bookstore Application – Object Metadata and Modification of Stock Value 128
III
N)
Bookstore Application – Modification Notification....................................... 129
O)
Bookstore Application – Synchronize Notification ....................................... 130
P)
Bookstore Application – Synchronized/Updated Visualization ..................... 131
Bibliography.................................................................................................................. 132
IV
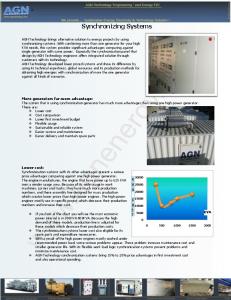
List of Figures Figure 1 Information Visualization Reference Model (Spence & Apperlay, n.d.) ........ 25 Figure 2 Layers of the mediator-wrapper architectural pattern...................................... 27 Figure 3 Overview of convergence and collaboration of Web3D Consortium and its standards (Havele, 2015 b).............................................................................................. 31 Figure 4 X3D visualizations of a simple world sphere. The right figure shows additional thematic overlay, where each country is coloured and extruded according to the extent of a thematic attribute. ......................................................................................................... 32 Figure 5 System architecture of a bidirectional database driven 3D IVIS Web application (figure taken from (Leissler, et al., 1999)) ...................................................................... 36 Figure 6 Extended IVIS Reference Model ..................................................................... 43 Figure 7 Architecture blueprint ...................................................................................... 46 Figure 8 Abstract concept of Server Side Information Visualization feature ................ 48 Figure 9 Abstract concept of Runtime Additional Data feature..................................... 49 Figure 10 Abstract concept of Runtime User-Triggered Modification feature .............. 50 Figure 11 Abstract concept of Synchronization pattern ................................................. 52 Figure 12 Exemplar structures of typical STOMP messages/frames (STOMP, 2012 b) ......................................................................................................................................... 57 Figure 13 Spring Simple Broker Message Workflow (Pivotal Software, 2016 b) ........ 58 Figure 14 Prototypical system architecture of synchronization-enabled Web-based 3D IVIS infrastructure .......................................................................................................... 60 Figure 15 Interfaces of implemented synchronization-enabled Web-based 3D IVIS infrastructure ................................................................................................................... 61 Figure 16 Request STOMP endpoints of the 3D IVIS Web Application ........................ 62 Figure 17 Workflow of server side information visualization request processing ........ 73 Figure 18 Workflow of visualize additional data request processing ............................ 76 Figure 19 Workflow of modify data instance request processing.................................. 79 Figure 20 Workflow of synchronization event processing (a larger version of the sequence diagram is included as appendix B)) ............................................................... 84
V
List of Tables Table 1 Taxonomy of input data in IVIS Reference Model (static vs. dynamic data) – some arguments/expressions have been used from Jones (n.d.) and Vale & UNECE (2013) .............................................................................................................................. 15
VI
List of Listings Listing 1 Java-based Configuration of Spring beans, SockJS and STOMP broker. To view all configurations and bean declarations, the Java class src/main/java/config/ WebSocketConfig.java can be consulted. ............................................................ 65 Listing 2 Generic mapping between element of global schema and wrapper instances 67 Listing 3 Mapping between single global selector and multiple atomic sub-property selectors ........................................................................................................................... 68 Listing 4 Mapping between global and local selector .................................................... 69 Listing 5 JSON representation of server-side-information-visualization-message........ 71 Listing 6 Server Side IVIS request handler interface (java class src/main/java/ controller/visualize/ServerSideVisualizationController.java ) ....................................................................................................................................... 72 Listing 7 JSON representation of runtime-request-data-message ................................. 75 Listing 8 Visualize additional data request handler interface (java class src/main/java/ controller/runtime/AdditionalDataController.java) .................... 75 Listing 9 JSON representation of runtime-modification-message ................................. 77 Listing 10 Modify data instance request handler interface (java class src/main/java/ controller/runtime/DataInstanceModificationController.java) ......................................................................................................................................... 78 Listing 11 JSON representation of data-source-change-message ................................. 81 Listing 12 JSON representation of synchronization-message ........................................ 82 Listing 13 Synchronization request handler interface (java class src/main/java/ controller/synchronize/SynchronizationController.java) ........ 82 Listing 14 Global Schema of bookstore ......................................................................... 87 Listing 15 Exemplar data instance illustrating local schema of XML file ..................... 88 Listing 16 Exemplar data instance illustrating local schema of CSV file ...................... 88 Listing 17 Exemplar data instance illustrating local schema of relational database (PostgreSQL) .................................................................................................................. 89 Listing 18 Exemplar mapping entry of the GlobalSchemaToWrapperMapping.xml file ......................................................................................................................................... 90 VII
Listing 19 Exemplar SubqueryMapping.xml file ........................................................... 91 Listing 20 Connecting to the IVIS infrastructure ........................................................... 93 Listing 21 Sending messages to the IVIS infrastructure ................................................ 95 Listing 22 Basic bookstore HTML page layout ............................................................. 96
VIII
List of Abbreviations 3D-IVIS-Mediator
Three Dimensional Information Visualization Mediator
API
Application Programming Interface
CityGML
City Geography Markup Language (extension of GML)
DAO
Data Access Object
ENE
Erlebnisraum Nachhaltige Entwicklung; Experiental Space Sustainable Development
GAV
Global-As-View
GIS
Geo Information System
GML
Geography Markup Language
HCI
Human-Computer Interaction
HTTP
Hypertext Transfer Protocol
HTTPS
Hypertext Transfer Protocol Secure
IP
Internet Protocol
IR
Information Retrieval
ISO
International Standardization Organization
IVIS
Information Visualization
LAV
Local-As-View
LOD
Level of Detail
MVC
Model View Controller
OECD
Organization for Economic Co-operation and Development
OS
Operating System
PC
Personal Computer
SAI
Scene Authoring Interface
SDL
Scene Description Language
SSI
Server Side Include
IX
SQL
Structured Query Language
TCP
Transmission Control Protocol
TIN
Triangular Irregular Network
UNECE
United Nations Economic Commission for Europe
UML
Unified Modeling Language
VR
Virtual Reality
VR-BML
Virtual Reality – Behaviour Modeling Language
VRML
Virtual Reality Modeling Language
W3C
WWW Consortium
WebGL
Web Graphics Library
WFS
Web Feature Service
WMS
Web Map Service
WWW
World Wide Web
X3D
Extensible 3D
X
Introduction and Motivation
1.
Introduction and Motivation
In the age of high speed Internet and smartphones, the World Wide Web (WWW) is accessible almost everywhere. The modern Web (often denoted as Web 2.0) has become the interface for numerous aspects of daily life, whether it be Social Media, communication and location-based services or simply to query information (Campesato & Nilson, 2010). The latter is particularly relevant in the context of Information Retrieval (IR) systems which aim to support the user in querying and finding relevant documents for a certain use case (Hiemstra, 2009). The user then has to browse the returned documents to satisfy his information deficit which implies cognitive effort. To help the user to explore and perceive the information in a cognitive efficient manner, Information Visualization (IVIS) techniques can be used (Spence, 2014). Through the creation of graphical representations of abstract data, they offer visual (interactive) interfaces for human users to inspect and comprehend the structure and relationships of the data (InfoVis:Wiki, 2013). Particularly, interactive 3D visualizations are a promising solution to support this intuitive perception. Since each human being acts in 3D space in his everyday life, the metaphor of a 3D depiction space for IVIS purposes seems logical to enhance user cognition through interaction with the presented 3D content (Wiza, 2012). The most widely used and proven concept of transforming abstract data to information visualization is reflected in the IVIS Reference Model (Card, et al., 1999), which defines three key transformational steps from so-called Raw Data over Data Tables and Visual Structures to concrete Views. The corresponding transformations, which also act as the key points for user interaction, are called Data Transformations, Visual Mapping and View Transformations. A detailed introduction of the IVIS Reference Model is provided in section 2.1.1. However, having the rising demand for user-driven Web 2.0 applications in mind, the classical IVIS Reference Model remains incomplete. The key idea of Web 2.0 is to focus on users’ demands and empower them with respect to application interaction and configuration as well as data generation and modification, which was also identified by the OECD in a report about the Participative Web (OECD, 2007). To conquer these needs, the IVIS Reference Model already provides certain user-driven interaction mechanisms to alter the visualization process. E.g., users may alter the Visual Mapping from Data Tables to Visual Structures to specify the visual representation of data objects. Yet, looking at the actual input of the IVIS Reference Model, the Raw Data component is more or less of static nature. But what if the visualized content changes over time, e.g. due to dynamic data sources or user-initiated content modifications? For instance, imagine a client-server environment, where multiple clients visualize the same content from certain data sources. If the data content changes on either side, in particular at the server-side data sources or the client-side visualizations, these changes have to be transmitted and applied to the other side, otherwise a local change could result in an inconsistent state. Hence, with respect to the IVIS Reference Model, what is missing is an explicit synchronization mechanism allowing content changes on both data source level and derived IVIS products, to maintain a synchronized and consistent state.
P a g e 11 | 143
Introduction and Motivation
Another key challenge of current research is represented by the keyword Big Data. One aspect of Big Data is that relevant data might be distributed to several heterogeneous data sources (Agrawal, et al., 2012; Zuech, et al., 2015). With regard to IVIS applications that intend to provide a visual interface for Big Data exploration and analysis, the access to heterogeneous data sources is crucial. Yet, while managing heterogeneous data sources implies heterogeneous access interfaces (concerning syntax and semantics), this complexity should be hidden from the users. Instead, the user should be provided with one single access/query interface to keep the application’s technical barrier as low as possible and increase user support and empowerment (Heer & Shneiderman, 2012).
1.1
Motivation
To motivate the development of a bidirectional Web-based IVIS infrastructure, enabling synchronization between data sources and information visualization, it is necessary to discuss this challenge from different points of view. This section starts with the justification of a Web interface in section 1.1.1, followed by considerations about concrete characteristics, in particular data characteristics (section 1.1.2), user-oriented characteristics (section 1.1.3) and use case characteristics (section 1.1.4). Finally, the possible contribution of the previously mentioned IVIS infrastructure to current research projects as well as technology-driven motivation is presented in section 1.1.5. 1.1.1 Justification of Web- and 3D User Interfaces It has to be explained why this thesis focuses on the development of a Web-based and three dimensional IVIS infrastructure. Both aspects are elaborated in this section, starting with the justification of a Web interface. The integration of most recent state-of-the-art Web technologies requires a permanent and preferably fast Internet connection as well as up-to-date browser versions from users. Despite these limitations, Web applications offer various advantages compared to desktop applications. The most important advantages are listed below and mainly taken from Chen and Heath (2005) and Campesato and Nilson (2010):
Control over Application and Versioning: The Web application can be easily modified as each client uses the most recent version from the server when he accesses the application. Thus, all relevant parts of the software can be controlled and managed from the server side.
Cross-Platform Capability: From the developer’s perspective, it is not relevant which operating system (OS) the client uses. In consequence, there is no need to deploy different applications for different OS. All a client needs, is an (up-to-date) Web browser that can run script code (e.g. JavaScript).
Access to Broad User Mass: According to a German study the proportion of Internet users in Germany in 2015 was 77.6 % (Statista, 2016). Present society is very familiar with using Web interfaces and applications due to Web 2.0 developments, which encourage users to interact with existing data and create
P a g e 12 | 143
Introduction and Motivation
content of their own. That and the fact that users do not have to install und update an additional program leads to a potentially broader user mass. All the users need is an (up-to-date) Web browser which may run on several devices like Personal Computers (PC), tablets or even smartphones. Using latter devices even allows interaction with the application from nearly everywhere (as long as there is a stable Internet connection).
Distribution of Data and Processing: A Web-enabled application might access multiple distributed data stores to retrieve/update information and might delegate specific system tasks to other distributed components (e.g. by using Web services to query or process data or to realize load-balancing in computation intensive scenarios).
Enablement of Collaboration: Applications, where spatially disjoint users from all over the world may work in collaboration, can be realized using a Web-based infrastructure that synchronizes the common data or even the whole view.
The advantages of Web applications outweigh the disadvantages, as potential users from all over the world can be provided with a visual interface to a central data storage, allowing to interact with the data from anywhere. Users are enabled to dynamically request data visualizations from the IVIS Web application. In addition, users should be encouraged to modify and create new information inside the visualizations, which in turn has to be transmitted to the server-side data sources. This is of particular importance in collaborative scenarios, where spatially distributed users work on the same domain data via a common interface (e.g. see section 1.1.3 for a more detailed discussion). Concerning the visual user interface, a decision had to be made whether to apply a 2D or 3D interface, including the question to present data in 2D or 3D. This discussion is as old as computer graphics and often the concrete use case reveals the better choice. There are various advantages and disadvantages of a 3D user interface. E.g., in the field of geosciences Dübel et al. (2014) compared 2D and 3D presentation of geo-data. As generic disadvantages of 3D, the survey revealed perspective object distortion and occlusion as well as matching the spatial location of objects referring to the attribute space as the main problem areas. In opposite, the authors identify the comprehensive presentation of 3D spatial objects as well as an increased number of perceivable shapes as the main benefits. With regard to the main IVIS intentions (supporting perception and insight of user by providing cognitive efficient and effective visualizations of abstract data (Card, et al., 1999)), a third dimension could be utilized to map additional data properties to visual attributes. On the contrary, if not applied correctly, a 3D user interface might be more complex to explore the data compared to a 2D interface (e.g. if navigation and interaction using 2D input devices is not native). In consequence, designing an intuitive 3D user interface for IVIS applications is not trivial (Chen, 2013). A successful 3D user interface relies on basic principles of Human-Computer Interaction (HCI). As presented by Ortega et al. (2016), there are five HCI key aspects any system with a visual user interface has to consider in order to enhance the overall usability. These are learnability (users quickly adapt to the system controls), efficiency (productivity of system-interaction), memorability, low error rate (indicator for the intuitiveness of the
P a g e 13 | 143
Introduction and Motivation
system interaction) and satisfaction (pleasantness for the user). If those basic principles are kept in mind, a 3D user interface for IVIS purposes built on contemporary 3D technologies could establish a powerful interface for exploring and perceiving abstract data. As Bowman (2004) points out, when navigation and interaction with shapes in an interactive 3D scene is intuitive, there is a short cognitive distance between users’ actions and the system’s feedback due to users’ immersive sense of presence within the virtual world. Another reason to decide for a 3D user interface is that 3D technologies are recently evolving to a new degree of maturity. In particular, the entertainment industry experiences a current boom in the fields of 3D input/output devices, augmented/virtual reality as well as 3D immersive gaming (Mahajan, 2016). Finally, as elaborated in more detail in sections 2.2.1 and 2.3, several standardization bodies and working groups strive to standardize the integration of interactive 3D multimedia content in (Web) applications. 1.1.2 Data Characteristics As already mentioned in section 1, the classical IVIS Reference Model was conceptualized for use cases with more or less static raw data as input for the visualization pipeline. When the reference model was designed by Card et al. (1999), user-triggered Data Transformations were intentionally considered to query raw data sources to select or filter content, which was used as input for the visualization processes, resulting in static visualization products with respect to the available content. Considering the introduction of dynamic data sources and content, the Raw Data component of the IVIS Reference Model can be classified according to Table 1, where static input data is contrasted to dynamic input data with regard to certain key properties. In row “Data Sources”, the categorization of Big Data sources and types of the United Nations Economic Commission for Europe (UNECE) has been used for improved characterization. In 2013, the UNECE tried to categorize Big Data into three distinct types, human-sourced information (e.g. from social networks), process-mediated data (traditional business oriented) and machine-generated data (e.g. sensor and computed data) (Vale & UNECE, 2013). Storing and processing Big Data is one of the key challenges of today’s research. A modernized IVIS infrastructure could also provide a visual interface with suitable visual metaphors to browse, navigate and analyse large datasets. For this reason, the identified types of Big Data of the UNECE have been integrated into the table.
P a g e 14 | 143
Introduction and Motivation
Table 1 Taxonomy of input data in IVIS Reference Model (static vs. dynamic data) – some arguments/expressions have been used from Jones (n.d.) and Vale & UNECE (2013)
Content Modification
Accuracy / Fault Rate
Data Sources
Static Data
Dynamic Data
once created, no modification
modification/removal of existing content, creation of new content (additional data)
more reliable; content is checked before release;
less reliable; content can be created by any person without deep checking for accuracy, errors and conflicts;
usually content is provided by domain experts
databases, data streams, filebased data, Web services with static content; mainly UNECE processmediated data
Acquisition / Retrieval Content Domain / Query Domain Impact on Workflow of IVIS Reference Model
select or filter operations (querying and filtering) static; available content is well-known query against a priori known resources Content of derived visualizations requires no update due to static content
content can be provided not only by domain experts, but also other participants without domain knowledge databases, data streams, file-based data, Web services plus dynamically generated data like sensor streams, simulation outputs with dynamic content; UNECE machine-generated data plus human-sourced information and machinegenerated data (Web 2.0 and Internet of Things) select or filter operations plus simulation output (querying, filtering and simulating) dynamic; query against dynamic resources, requires dynamic queries synchronization between content and derived visualizations needed maintenance of consistency between data sources and IVIS products
In essence, allowing dynamic data as basic component in the IVIS Reference Model has huge consequences for both the content of derived IVIS products and the workflow of the visualization pipeline. For instance, in a client-server environment, the modifiability of content at the server-side data sources may cause derived client-side visualizations to be outdated and inconsistent. To prevent this inconsistency, an explicit synchronization mechanism must be established to broadcast any server-side content changes to all clients visualizing this content. Furthermore, the classical IVIS Reference Model could be extended to explicitly allow multiple heterogeneous data sources to match today’s data landscape, especially in the context of Big Data research as identified by Bornschlegl et al. (2016). In consequence, instead of just managing the access to a single data source, a modernized IVIS infrastructure should be enabled to administer content from several heterogeneous data sources, including databases as well as file- or Web-based sources. A key challenge in this context is to semantically integrate these diverse sources and access interfaces to provide a unified access interface for client requests. An architectural pattern to solve this problem, in particular the mediator-wrapper architecture, has been proposed by Wiederhold (1992) and will be explained in section 2.1.2.
P a g e 15 | 143
Introduction and Motivation
1.1.3 User-Oriented Characteristics The main intention of an IVIS application is to empower the user in analysing and perceiving data (Chen, 2013). Typically, the user has a certain Information Need, executes applicable Information Behaviour by interacting with the visualized content and eventually achieves insight. Hereby, the role of the IVIS application is to enhance the effectivity and efficiency of users’ Human-Computer Interaction by offering suitable cognitive efficient direct-manipulative IVIS interactions (Card, et al., 1999). In particular, domain experts should be empowered to fully exploit their domain knowledge and expertise by reducing technical barriers of the IVIS system (Heer & Shneiderman, 2012). To achieve insight, in classical IVIS scenarios, users are able to iteratively request and analyse certain datasets by altering the classical transformations (Data Transformations, Visual Mappings and View Transformations) and rerun the visualization pipeline according to the IVIS Reference Model (Ware, 2004). However, once the insight has been concluded, it would be aspirational to make this insight persistent within the original data sources, e.g. by annotating or highlighting a certain dataset. Otherwise, the insight that has been acquired through several iterative visual analytic steps might only be known by the user who executed the process. A second user, trying to analyse the data with the same intention would redo all iterations on his own to eventually obtain the same insight. If the first person had previously persisted that insight, the second user would have benefited significantly from this. To enable users to modify visualized datasets or to create new data, a modernized IVIS infrastructure must provide a user-triggered update mechanism to propagate the data modifications back to the original data sources. Particularly, in collaborative scenarios, where multiple spatially disjoint users work the same data through a common Web-based visual interface, it is inevitable to transmit local data changes to the shared data sources in order to publish these changes to all other users. In conclusion, two new mechanisms are required. First, users should be enabled to perform local data changes within their local visualization with the help of appropriate and intuitive IVIS techniques. This implies a client-triggered update mechanism to transfer the applied changes to the underlying data sources and make them persistent. Second, once the content of the underlying data sources changes, all other users that visualize the affected content have to be notified and updated with the content change (broadcast of data change) to keep them synchronized and consistent with the data sources. 1.1.4 Use Case Characteristics To further motivate the need for synchronizing data sources and Information Visualization, this section provides a simple exemplar use case, introducing a warehouse information system, where the stock of each offered product is accessible through an interactive visual interface. Let there be two employees that visualize stock information simultaneously. Each employee may select and visualize a certain number of product stocks from the same data source (whereby at least one product stock should be equally selected by both, e.g. the book “Readings in Information Visualization” from Card et al. (1999)). Moreover, let there be a user who buys an exemplar of the mentioned book,
P a g e 16 | 143
Introduction and Motivation
causing the system to automatically decrease the book stock by one. Since both employees visualize the stock of that book, their visualizations must be updated automatically to reflect the most current stock (system-triggered update of client-side visualization). Later, five new exemplars of the book arrive at the company and are registered in the system by employee A, who, as a consequence, increases the book stock by five via his local visual interface. This modification has to be persisted within the data source storing the stock values. This, in turn, triggers the system to notify employee B about that change (persistence of data modification and broadcast of change to other clients). This simple example already indicates the usefulness of an explicit synchronization mechanism within a modernized IVIS infrastructure. Based on this, the following section considers additional technology-driven and application-driven motivation aspects. 1.1.5 Technology-driven and Application-driven Motivation In 1999, a similar IVIS infrastructure was developed by Leissler et al. Their system was capable of visualizing abstract data from a relational database through interactive 3D VRML (Virtual Reality Modelling Language) scenes. In addition, they invented VRML extensions to embed predefined SQL statements into VRML scenes for runtime behaviour and access to the database. With the definition of database triggers they also realized broadcasting content changes at database level to affected clients. Basically, the work of Leissler et al. covers nearly all requirements identified in the previous sections. However, 17 years have passed and the used technologies have evolved ever since. Consequently, the past implementation needs to be reviewed and reconceptualised with the help of adequate modern (Web) technologies. Furthermore, to match current challenges regarding Big Data, the system architecture should be extended, following the mediator-wrapper pattern as explained in section 2.1.2. The integration of modern Web technologies might lead to a more intuitive implementation and coupling between the participating system components. In section 2.3 the mentioned implementation of Leissler et al. will be described in more detail. In contrast to the previously presented technological-driven motivation, the significance of a modernized synchronization-enabled IVIS infrastructure can also be emphasized by identifying current research projects that could benefit from it. Of particular interest in modern environmental and societal projects are challenges in the field of Big Data (Bornschlegl, et al., 2016). Bornschlegl et al. stress that innovative and universal infrastructures, virtual environments as well as appropriate HCI to enhance cognitive efficient interaction with the data are missing. Via an appropriate infrastructure and advanced visual interfaces, user-centred processes in the fields of Data Mining or Knowledge Management could be simplified. Consequently, new infrastructures and techniques about data access, visualization and perception as well as advanced visual interfaces in the field of visual analytics are needed (Bornschlegl, et al., 2016). An intuitive advanced visual interface may improve user perception of domain data. In combination with a synchronization-enabled IVIS infrastructure, users may be empowered to persist their achieved insight at data source level through interaction within the visual interface. In the following, two concrete research projects in the fields of
P a g e 17 | 143
Introduction and Motivation
environmental or societal challenges are presented, where the proposed IVIS infrastructure could serve as a visual interface for interaction with huge data masses. The project EarthServer (Baumann, 2016), funded by the European Horizon's 2020 program, uses the Big Data Array Database system rasdaman (rasdaman GmbH, 2015) to offer a uniform information space for huge collections of multidimensional and spatiotemporal earth observation and satellite data (Fraunhofer-IGD, 2015). This Big Earth Data can be offered through high-performance multidimensional rasdaman data cubes which act as a basis for ad-hoc analysis. Within the second phase of the project, EarthServer aims to establish a visual interface to access, display and analyse massive Earth Science Data (Baumann, 2016). Hence, a state-of-the-art Web-based (Big-Datacapable) IVIS infrastructure, fulfilling these requirements with regard to access, visualization and analyzation of Big Earth Data, proves a highly relevant visualization front-end to the EarthServer project and also highlights its possible impact on current research challenges. In particular, acquired analyzation results could immediately be stored to make the achieved insight persistent. The contribution of a modernized IVIS infrastructure to current social challenges is proved with regard to the EU Horizon 2020 funded project Sensor Enabled Affective Computing for Enhancing Medical Care, in short SenseCare. Its main objective is to implement a cloud-enabled affective computing operating system that processes and unites diverse sensor data in medical healthcare use cases to obtain emotional and cognitive insight into the wellbeing of patients (SenseCare, 2016 a). E.g., dementia patients can be surveyed by multiple sensors (e.g. camera-based, pulse monitor) to automatically analyse and perceive their state of health via the cloud-based system as well as initiate appropriate counter actions. This way, the patient’s state of health (physically and emotionally) can be better monitored and understood from both medical professionals and patients themselves. In addition, via this approach, future benefits of SenseCare could improve the overall medical care, provide more data for research of diseases as well as reduce costs and medical risk (SenseCare, 2016 b). Thinking about the massive size of data the SenseCare system permanently records and produces, it is obvious that information retrieval processes to investigate certain captured data have to deal with Big Sensor Data. Again, a synchronization-enabled IVIS infrastructure could offer an advanced visual interface to access, visualize and investigate the huge medical data collection. In particular, medical professionals might annotate certain datasets (e.g. a video capture of a dementia patient) with a detected diagnosis via the visual interface and in consequence, persist this information within the affected dataset. Other medical professionals could then use this annotation to make further diagnosis or derive a concrete action plan.
P a g e 18 | 143
Introduction and Motivation
1.2
Problem Statement
As the previous sections point out, current research projects and challenges require a generic state-of-the-art Web-based synchronization-enabled 3D IVIS infrastructure, which is, in addition, capable of coping with Big Data. Although 3D visualization is not always adequate, it provides, if correctly employed, an intuitive visual user interface with respect to navigation in the virtual depiction space. After all, the main goal of an IVIS infrastructure is to provide cognitive efficient direct-manipulative IVIS interactions to empower the user to fully exploit their domain expertise. The term “synchronizationenabled” proves the main challenge of this research. Referring to the original IVIS Reference Model, which already allows user interaction on each step of the transformation process from raw data to views, it lacks the explicit intention to synchronize data sources and derived information visualization, especially in the context of Web applications, where multiple clients visualize and interact with the same information locally. From the perspective of Web 2.0, where (collaborative) user interaction and the generation of user content is strongly intended, the lack of data modifiability in current IVIS Web applications is a great deficit. In consequence, suitable means for data modification as well as an explicit synchronization mechanism are aspirational to establish an extended synchronization-enabled visualization pipeline to keep modifiable data sources and derived visual representations consistent. To sum up the main observations and conclusions from section 1.1 the following three main functional features can be identified:
Server Side Information Visualization: A user (client) must be enabled to request server-side application data. During the retrieval process, the server transforms the requested (abstract) data into an appropriate cognitive efficient information visualization that is returned to the user. Ideally, this transformation implies a user-configurable mapping definition between source data and visualization objects.
Runtime Information Visualization: The Runtime component comprises any user interactions in an existing visualization. In particular, users may request additional data from within the visualization or modify the displayed data content. In the latter case, these modifications must be persisted within the serverside data sources, requiring an explicit user-triggered update mechanism.
Synchronization: Clients that visualize data content must be registered. To maintain a consistent state between data sources and delivered IVIS products, any server-side data changes must be broadcast to all registered clients.
Essentially, the work of Leissler et al. (1999) already covers the realization of the aforementioned functional features, as described in detail in section 2.3. Yet, due to technological evolutions and current Big Data related challenges, a reconceptualization and reimplementation is inevitable to produce a state-of-the-art IVIS infrastructure.
P a g e 19 | 143
Introduction and Motivation
1.3
Research Questions and Objectives
The overall research goal is to conceptualize and develop a generic state-of-the-art Webbased synchronization-enabled Big-Data-capable 3D IVIS infrastructure. From the aforementioned problem statement, concrete research questions and objectives can be derived. For this purpose, each describing term of the above mentioned IVIS infrastructure is presented in detail to characterize its key properties:
Generic: the infrastructure should be applicable for diverse use cases, and hence, be configurable according to the interactions defined by the classical IVIS Reference Model.
State-of-the-Art and Web-based: contemporary (Web) technologies, approaches as well as architectural patterns have to be analysed to find contemporary system components for a modernized IVIS infrastructure. This implies the identification of suitable coupling points between each key technology to form an overall system architecture. In particular, since the infrastructure is Web-based, challenges with respect to Web browser compatibility, load balancing, message exchange (size and type of message) have to be taken into account.
Synchronization-enabled: to allow dynamic data and client-side modifiability of the displayed content on a conceptual level, the IVIS Reference Model should be enriched with an additional user-triggered interaction. As consequential impact for the implementation of the IVIS infrastructure, user-triggered update-events and server-side content change broadcasts have to be realized by an explicit update/synchronization mechanism.
Big-Data-capable: Amongst others, Big Data implies two main aspects, heterogeneous data sources, and large datasets (Zuech, et al., 2015). Hence, a BigData-capable IVIS infrastructure has to consider generic mechanisms for Big Data access, processing and visualization, affecting all tiers of the overall system architecture. E.g., this implies the possibility to access and process content from multiple heterogeneous (with respect to syntax and semantics) data sources on the server side as well as appropriate visualization metaphors and interactions to display and analyse Big Data through the visual interface on the client side.
3D IVIS: to support the user in his data analyzation process, it is a prerequisite to provide an intuitive but powerful visual interface with adequate directmanipulative IVIS interactions. As discussed in section 1.1.1, a three dimensional user interface should be focused. More importantly, to establish a 3D interface, it has to be a real-time visualization environment, e.g. a virtual reality scene. Otherwise users are heavily restricted in their interaction and the overall systems usability suffers.
Having inspected each important aspect of the targeted IVIS infrastructure, concrete research questions can be derived. Each research question poses a certain challenge
P a g e 20 | 143
Introduction and Motivation
affecting at least one of the above mentioned key properties of the IVIS infrastructure. Some of the most relevant research topics are:
How to conceptualize a modern state-of-the-art infrastructure that allows flexible, yet beneficial (on-demand) information visualization of diverse data from arbitrary data sources?
With respect to the system architecture, how can the flexibility and adaptability of the system be guaranteed? A generic IVIS system should be applicable for multiple diverse use cases and scenarios. How can the overall system architecture as well as the implementation on code level be made in a generic fashion to enable the system to be adapted to different use cases with different data sources and visualizations with a minimum effort?
The IVIS Reference Model defines three user configurable transformations (data transformations, visual mapping, and view transformations). What is the best way to support the user in these configurations and how can they be offered to users at all? This implies a solution to the conflict between full configuration versus simplicity of configuration. On the one side users should be enabled to configure the system at various key aspects. On the other side, the configuration process should remain clear and simple to users to not overwhelm and confuse them.
What current (Web) technologies are capable and suitable to realize the proposed IVIS infrastructure? Can key technologies with suitable and intuitive coupling points be identified to keep the overall system architecture as transparent and comprehensible as possible?
How to realize an advanced visual 3D user interface to access and interact with the displayed data? It should be as intuitive (with respect to easy navigation and low technical barriers) as possible to simplify the user’s interaction but at the same time offer sufficient means to support the user and domain experts to fully exploit their domain expertise by enhancing their overall perception and analyzation capabilities.
Abstract data has to be mapped to visualization objects in a 3D depiction space. How can data properties be made visible and editable within the client-side visual interface? How to define/perform an unambiguous mapping between data properties and visual properties? How can the user be empowered to edit and purposefully modify data properties through the visual interface?
How to theorize synchronization between data sources and information visualization on a conceptual level (e.g., how to augment the IVIS Reference Model)? Regarding the implementation, which approach and technologies can be utilized to realize the synchronization-related core features Server Side Information Visualization, Runtime Information Visualization and Synchronization?
P a g e 21 | 143
Introduction and Motivation
How to handle access and processing of large datasets in Big Data scenarios, where data might be located in several heterogeneous data sources? Which architectural patterns may provide the best solution?
How to handle large datasets on the client side in Big Data scenarios? The system must be capable of filtering or aggregating the data, since a complete visualization of all datasets at the same time is both overwhelming the user as well as reducing data perception. More importantly, large datasets are a huge challenge for any visualization engine that tries to display this data in real-time.
In conclusion, many challenges and research questions have been identified. This Master thesis cannot solve each of the above mentioned challenges. Instead it will serve as a starting point and initial approach towards the described IVIS infrastructure.
1.4
Aim and Outline of the Thesis
As a starting point for future research and development towards a generic state-of-the-art Web-based synchronization-enabled Big-Data-capable 3D IVIS infrastructure, the aim of this thesis is to identify modern (Web) technologies and approaches and use them to build a modernized synchronization-enabled IVIS infrastructure realizing the three core functional features Server Side Information Visualization, Runtime Information Visualization and Synchronization, as identified in section 1.2. With respect to the identified challenges/objectives from section 1.3, this thesis will cover the following aspects:
identification and integration of modern (Web) technologies in the fields of Web protocols and 3D real-time rendering user interfaces for utilization in a Web browser based application
extension of the original IVIS Reference Model to reflect dynamic data and usertriggered data modifications on a conceptual level
design of the system-architecture based on the mediator-wrapper pattern to access arbitrary heterogeneous data sources in future Big Data scenarios
reconceptualization and reimplementation of the three synchronization-related core features Server Side Information Visualization, Runtime Information Visualization and Synchronization as an evolvement from the work of Leissler et al. (1999)
verify and evaluate (with respect to the synchronization mechanism) the resulting infrastructure by implementing an exemplar application scenario with a simple mapping between abstract data properties and visualization properties
The resulting infrastructure as well as the conceptual refinement of the IVIS Reference Model may serve as a basis for ongoing research tackling the remaining challenges in the realization of the motivated IVIS system.
P a g e 22 | 143
Introduction and Motivation
The thesis is outlined as follows. Section 2 addresses state-of-the-art approaches and technologies as well as related work. Section 3 proposes an abstract concept to tackle the aimed research objectives of this thesis including a detailed introduction of the synchronization-related core features as well as the refinement of the IVIS Reference Model. To validate the proposed conceptualization, a proof-of-concept implementation of a synchronization-enabled 3D IVIS infrastructure is presented in section 4, followed by an extensive evaluation in section 5. The thesis ends with a conclusive overview and a subsequent discussion of future research and development in sections 6 and 7.
P a g e 23 | 143
State-of-the-Art and Related Work
2.
State-of-the-Art and Related Work
The discussion about contemporary technologies and approaches is presented in two subcategories. Relevant abstract concepts and architectural patterns are introduced from a scientific point of view in section 2.1. Subsequently, modern technologies in the fields of Web-based 3D IVIS and a discussion about utilizable Web protocols are considered with regard to technical aspects in section 2.2. Eventually, Related Work as well as a concretization of remaining challenges are addressed in sections 2.3 and 2.4.
2.1
Scientific State-of-the-Art
Relevant abstract concepts, which have an impact on research towards the proposed synchronization-enabled IVIS system, have to be identified. Mainly, there are two concepts, the IVIS Reference Model as a proven visualization pipeline to transform abstract data to information visualization, and the mediator-wrapper architectural pattern, which suggests key components in a generic approach to access content from heterogeneous data sources. Both concepts will be described in detail subsequently. 2.1.1 IVIS Reference Model Figure 1 depicts the classical IVIS Reference Model (alias visualization pipeline) which presents the necessary data structures and transformations to create cognitive efficient visualizations. Originally proposed by Card et al. (1999), the reference model introduces three user-configurable steps to transform Raw Data to final Views, which can be explored by users. Via Data Transformations, Raw Data is filtered and enriched with meta-information to acquire Data Tables or, as a more generic term, Structured Data. With the help of Visual Mappings, data properties are linked to visual attributes. From those Visual Structures concrete Views can be generated to provide an interface for user exploration and interaction.
P a g e 24 | 143
State-of-the-Art and Related Work
Figure 1 Information Visualization Reference Model (Spence & Apperlay, n.d.)
In the context of current demands and challenges in Big Data scenarios Bornschlegl et al. (2016) propose an extension of the IVIS reference model. A key component of Big Data information systems is the ability to offer data from various heterogeneous data sources to the user. Thus, Bornschlegl et al. make use of the mediator-wrapper architectural pattern to semantically integrate and visualize multiple heterogeneous data sources, whereas the classical IVIS Reference Model only defined a single Raw Data component. Via suitable visual representations, the user should gain insight about the core properties and relationships of huge data masses. Although this extension considers Big Data challenges, it still lacks an explicit mechanism to allow dynamic data, as identified in section 1.1.2. As a crucial prerequisite towards bidirectional synchronization between data sources and information visualization, this need should be reflected within the abstract visualization pipeline. Hence, an additional extension of the IVIS reference model is required, which will be addressed in section 3.1. 2.1.2 Mediator-Wrapper Architecture Data acquisition and management are important requirements for IVIS applications. Whereas for certain use cases the whole relevant domain data might reside within a single data source, e.g. a relational database, it would be beneficial to consider data management of several, possibly distributed, heterogeneous data sources within the system architecture of an IVIS infrastructure. The property “heterogeneous” indicates that each different data source may have a different syntactical and/or semantical access interface. While technically, an IVIS infrastructure can provide access to each different data source, another key aspect of a cognitive efficient IVIS application is a simple and intuitive visual user interface (Heer & Shneiderman, 2012). If the user is supposed to interact with the domain data through the visual interface, e.g. perform additional queries to select additional data, then the user must not be overwhelmed by multiple query interfaces that require the user to construct queries against different data sources in a different manner.
P a g e 25 | 143
State-of-the-Art and Related Work
Instead the IVIS system should provide a single homogeneous query interface. This way users can concentrate on the actual analyzation and perception task. From the perspective of an IVIS infrastructure the dilemma between a single unified query interface on the client-side and access management of multiple heterogeneous data sources on the server-side has to be solved. It is desirable to have a system architecture that allows a homogeneous query interface for clients but enables the system to manage data from multiple heterogeneous data sources. In general, there are two main concepts to in this context, the materialized and the virtual integration (Herschel, 2014). Both share the concept of a global data schema that unifies the diverse local data schemas of each dissimilar data source. The materialized integration approach uses a central data store (often denoted as ‘data warehouse’) to redundantly persist data from various data sources by periodically retrieving updates from them. The main benefit is that queries to the data warehouse can be immediately responded. In contrast, the virtual integration approach provides a global schema as unified query interface and delegates queries to the appropriate distributed data sources (which might cause query translation and increasing response time). Hence, the actual data remains in the distributed (heterogeneous) data sources, allowing on demand query and integration controlled by a so-called mediator component. Since the virtual integration approach avoids data redundancy and the queried source data is retrieved on demand by nature, it is more suitable to realize a Web-enabled IVIS infrastructure. From an architectural perspective, the mediator-wrapper pattern is commonly used to establish virtual data integration (Herschel, 2014). Initially proposed by Wiederhold (1992), the mediator-wrapper architectural pattern follows a layered structure to provide a homogeneous interface to access multiple heterogeneous data sources (Ericsson, 2009). Figure 2 presents the main layers of the mediator-wrapper pattern, namely client-, mediator-, wrapper- and data source tier, which are described referring to Wiederhold and Ericsson:
Client / Business Logic: a client component interacts with the mediation system, either to retrieve data or to update certain datasets of data sources. It formulates queries against the global schema of the mediator.
Mediator: The central mediator component acts as a homogeneous interface to clients. It manages all available data sources and mediates between them and clients. Hence, as a fundamental requirement, the mediator has to maintain a global data schema, which serves as a global representation of the available domain data from all diverse data sources. On this basis, the mediator may split up an incoming request and delegate it to appropriate wrapper components that, in turn, handle communication with the actual data sources. This includes that the mediator must also administer which information is stored in which data source. Finally, any results, retrieved from different wrapper components, have to be merged to a single result that is eventually returned to the client.
Wrapper: For each data source exists exactly one wrapper component that handles communication and information retrieval. Each wrapper comprises a local data schema resembling the structure of the domain data of the underlying data source. A crucial task is to translate/reformulate an incoming query against
P a g e 26 | 143
State-of-the-Art and Related Work
the global schema of the mediator into an appropriate query against the data source’s local schema (implying semantical and syntactical translation). The effective access to the data source may be executed by supplementary components (e.g. DAO (Data Access Object) components (Haines, 2003)) serving the separations of concerns pattern (Laplante, 2007). Consequently, any retrieved information has to be properly prepared according to the expected interface of the mediator for the subsequent transmission. For instance, if the mediator expects X3D scenes as result, then each wrapper must encode the retrieved information in X3D.
Data Sources: This tier may consist of several heterogeneous data sources like databases, file-based formats, or even Web services storing application data. Naturally, each data source provides a different interface on both the syntactical (e.g. SQL statements, web interfaces, simple file access) and semantical (data schema) level. Because of this, each different type of data source requires an own wrapper, that handles access.
Figure 2 Layers of the mediator-wrapper architectural pattern
A basic functionality of a mediation system is to map between several local data schemas of different data sources and a global data schema of the mediator in order to offer a unified homogeneous query interface to clients. Typically, there are two approaches to realize this so-called schema mapping/matching, the Global-As-View (GAV) and the Local-As-View (LAV) approach (Daniel & Matera, 2014). The basic concept of both is
P a g e 27 | 143
State-of-the-Art and Related Work
to define one schema (global or local) as a view over the other. In the GAV mapping, the global data schema of the mediator is created as a view over all local data schemas. The benefit is that a query can simply be split up according to the view definition and hence be delegated to the respective data sources. However, any change of existing local schemas as well as the addition of new data sources cause a modification of the global schema. On the contrary, in the LAV mapping, the local data schemas are interpreted as views over the global data schema. Thus, the global schema is defined independently and the entries of each local schema are mapped to entries of the global schema, allowing flexibility regarding local schema changes or the insertion of new data sources. Such changes do not cause the global schema to be modified. Yet, in LAV mapping it is more difficult to delegate a query to the respective data sources, since multiple data sources might offer information for one single entry of the global schema, or, in a worse scenario, some information entry of the global schema might not exist in certain data sources at all. In consequence, LAV systems need ambitious mechanisms to evaluate the best combination of data sources to satisfy the demands of the query (Daniel & Matera, 2014). Nonetheless, since the LAV approach utilizes a stable definition of the global schema, which acts as the central query interface for clients, it is more applicable for employment in an IVIS Web infrastructure. In conclusion, the mediator-wrapper architectural pattern is capable of providing a single unified interface to access several heterogeneous data sources through virtual integration. The complexity of mediating between the global data schema and multiple diverse local data schemas is encapsulated due to the use of specialized wrapper components that handle reformulation of the query as well as communication with certain data sources.
2.2
Technical State-of-the-Art
Concerning a 3D synchronization-enabled Web-based IVIS infrastructure, certain key technologies have to be identified, which act as the infrastructure’s foundation. This includes mainly two key components, suitable 3D formats to establish a 3D real-time visual user interface on the client side, and an appropriate Web protocol that allows bidirectional communication in a client-server environment. Consequently, modern Webenabled 3D formats are discussed in section 2.2.1 followed by an investigation about modern Web protocols in section 2.2.2. 2.2.1 Web-based 3D Information Visualization A study from the year 2008 revealed more than 140 different formats to model virtual 3D shapes, most proprietary and for specific purposes (McHenry & Bajcsy, 2008). It can be assumed that in the past eight years even more formats have risen. Obviously, only few formats have emerged to de-facto standards that are commonly used in scientific or industrial use cases. With respect to an interactive visualization application, suitable formats should not only provide means to display static 3D models, but embed arbitrary virtual objects within a virtual interactive scene. In essence, such 3D scene formats must offer rich interaction capabilities to enable the user to rotate the whole scene and perform high level interactions like clicking a shape to trigger a certain action. Hence, 3D formats
P a g e 28 | 143
State-of-the-Art and Related Work
can be categorized into static formats (for static display) and interactive scene formats. From the perspective of cognitive efficient IVIS applications, where interactive 3D scene formats are indispensable, the following requirements are demanded additionally (Jankowski, et al., 2013):
Advanced shape modelling: A suitable format has to offer rich possibilities to model any shape in order to visualize arbitrary abstract data. In addition, extension mechanisms as well as the support of shape reuse are desired but not strictly necessary.
Interactivity (scene navigation): A user must be enabled to interactively navigate through the displayed content and change the view of the virtual scene to avoid object occlusion.
Interactivity (with shapes): A user should interact with the shapes itself, e.g. to request more details or to modify certain properties. In consequence, the format must support an event-handling mechanism to intercept user interactions and trigger specific functions. In addition, the application provider must be permitted to define behaviour of the triggered functions.
Rendering Performance: Naturally, the scene rendering should be stable and performed in real time (frame rate should not fall below 15-20 frames per second). Any rendering delays might lead to user irritation and/or annoyance and, as a consequence, the system usability suffers. Obviously, real time rendering is highly dependent from the number and complexity of the displayed shapes as well as the graphics engine (Akenine-Möller, et al., 2008).
Scalability: Scalability comprises the ability to create virtual scenes with an arbitrary amount of shapes, especially in Big Data scenarios. More importantly, real time scene display and navigation must be guaranteed without significant performance loss.
Modifiability: The ability to interactively add or remove parts in an existing scene without an entire reload is crucial in visual analytics. Otherwise, the process of gaining insight of visualized information and data relationships might be interrupted.
Platform Independency: 3D scenes should run independently with regard to specific platforms (e.g. operation systems or Web browsers). Otherwise potential target groups might be prevented from using the application.
Web Capability: A scene is delivered via Internet connection and displayed in a Web browser, which requires an acceptable and controllable size of virtual scenes as well as Web browser integration. More importantly, regarding scene display, Web browsers must provide full support of the format and be able to interpret it correctly. Since Web browsers cannot support all available formats natively, this might require clients to install an additional browser plugin (which ideally should
P a g e 29 | 143
State-of-the-Art and Related Work
be avoided to lower the technical barrier and keep application access as simple as possible). The aforementioned requirements were also identified by the Declarative 3D for the Web Architecture W3C Community Group that strives to standardize a declarative approach for 3D multimedia content embedment in Web applications (Jankowski, et al., 2013). Moreover, the working group lists further declarative 3D principles to align 3D Web graphics with existing Web standards and exploit synergies. Interesting concepts are, for instance, DOM (Document Object Model) integration and separation of structure from content as well as separation of content from style (e.g. using CSS to style 3D objects). They propose that 3D graphics should ideally be embedded into the DOM of the Web browser using a declarative encoding and allowing native access to and modification of 3D elements. 3D content would be equally attended like any other HTML element and, in consequence, aligns natively with existing key Web technologies like CSS or JavaScript (Jankowski, et al., 2013). In summary, suitable 3D formats for Web-enabled IVIS purposes must be capable of more than mere display of virtual shapes. In particular, various interaction and modification as well as event-handling mechanisms are desirable in order to offer intuitive but powerful possibilities to support user perception of and interaction with the displayed data. Thus, the number of usable 3D formats can be limited to so-called Scene Description Languages (SDL) that organize the components of virtual shapes in a hierarchical way. In an SDL, a complete virtual scene with multiple shapes comprises tree-like structures (denoted as scene graphs) of visualization objects, camera positions that act as viewpoints, light and other nodes that represent a detailed description of the scene to be rendered (Bar-Zeev, 2007; Adnan et al., n.d.). As a promising non-proprietary solution, the Web3D Consortium1 recommends the ISO-certified formats VRML (Virtual Reality Modelling Language) and XML-based successor X3D (eXtensible 3D) (Web3D Consortium, 2016). Both formats are applicable to create arbitrary interactive virtual reality (VR) scenes and, therefore, meet the above listed requirements regarding Webenabled IVIS applications. In addition, they are open-source and are compatible with modern Web standards like HTML5. More importantly, compared to other (proprietary) 3D multimedia content standards like U3D, COLLADA or 3D XML, VRML and X3D provide the most encompassing set of abilities to publish several types of interactive media content such as graphics, sound, movies or 3D shapes (Cellary & Walczak, 2012). To be precise, in addition to VRML and X3D, Cellary and Walczak also highlight MPEG-4 as suitable, ISO-certified standard for interactive 3D multimedia content. However, since the Web3D Consortium recommends VRML and X3D, this thesis will introduce X3D and its capabilities in the remainder of this sub-section.
1
The Web3D Consortium is a non-profit organization founded by various actors from science, industry and government to create and develop open standards for the generation and exchange of real-time 3D content (Web3D Consortium, 2015).
P a g e 30 | 143
State-of-the-Art and Related Work
2.2.1.1 X3D as modern standardized Format This sub-section presents a short overview of the main characteristics of X3D and proves that it meets the previously listed requirements for Web-based IVIS applications. The fact that X3D is a non-proprietary and open standardized format to model and exchange virtual interactive 3D multimedia content is a huge advantage compared to other proprietary formats, since this assures continued maintenance as well as future development (durability) and increases interoperability. Figure 3 illustrates the linkages to other standardization bodies that strengthen the intention of the Web3D Consortium to establish X3D as the most applicable format for immersive 3D Web applications (Havele, 2015 a). The linkages to the WWW Consortium (W3C) and the Khronos Group are of particular importance, since the compatibility and interoperability with the Web standards HTML5, XML and WebGL enables X3D Web browser integration.
Figure 3 Overview of convergence and collaboration of Web3D Consortium and its standards (Havele, 2015 b).
X3D is the XML-based successor of VRML, an SDL for interactive 3D real-time visualizations (Havele, 2015 b). As X3D content is encoded in (textual) XML, X3D files are platform-independent and can be transmitted via Web connections. An X3D browser parses the X3D code, renders the virtual shapes and provides the necessary interfaces for user interaction with the displayed scene. Either such X3D browsers are offered as standalone programs or as Web browser plugins that allow the embedment of X3D scenes within HTML Web applications (Brutzman & Daly, 2007). For IVIS Web applications the latter option is of particular relevance. As an example for a Web browser embedded X3D scene, Figure 4 presents a globe visualization (the figure only shows the X3D visualization; a screenshot of the complete Web page is attached in appendix A)). The globe visualization is a result of the research project “Erlebnisraum Nachhaltige
P a g e 31 | 143
State-of-the-Art and Related Work
Entwicklung (ENE, Experiental Space Sustainable Development)” carried out at the Bochum University of Applied Sciences (and fostered by the Ministry of Innovation, Science, Research and Technology of the State of North Rhine Westphalia (SchweizerRies, 2015)). One of the goals of these X3D globe visualizations was to increase the perception of users regarding sustainability issues. For this reason, global thematic data per country was visualized as colourized and extruded shapes on a virtual globe representation of planet Earth.
Figure 4 X3D visualizations of a simple world sphere. The right figure shows additional thematic overlay, where each country is coloured and extruded according to the extent of a thematic attribute.
To describe the creation process of such visualizations, the structure of X3D scenes needs to be discussed. The components of an X3D scene are denoted as nodes. In general, group nodes and object nodes can be hierarchically structured to compose a scene graph that describes the content of an X3D scene encoded as XML elements. Due to the hierarchical structuration of nodes, properties of parent nodes are inherited by (multiple) child nodes allowing a simple but powerful mechanism to create complex virtual objects (Kloss, 2010). Each node has characteristic properties (denoted as fields and encoded as XML attributes) according to its type. For instance, a Sphere node expects the field radius to specify the size of a virtual sphere whereas a Cone node uses the fields bottomRadius and height to define its spatial extent. An extensive overview of all usable node types and their characteristic fields is given by the official X3D specification (Web3D Consortium, 2008). To mention a few frequently used types, Shape nodes embody virtual objects consisting of a geometry and an Appearance node. The former might be one of the geometric primitives Sphere, Box or Cone or an arbitrary, complex geometry by specifying a meshed surface using IndexedTriangleSet or IndexedFaceSet. The latter controls the visual representation (colourization or texturing). Via Transform nodes the translation, rotation and scale of shapes can be set. Additionally, Light or Sound nodes may contribute to an appealing atmosphere as well as an improved spatial perception of the scene. Noteworthy, once declared, a node can be reused within the scene. To do this, a unique identifier is specified in the DEF field of the node. Exact copies of that node can be instantiated through the key field USE which must contain the same identifier. To create similar, but not exact, replicas of nodes, a prototype mechanism is offered. In a
P a g e 32 | 143
State-of-the-Art and Related Work
first step, the interface (name and properties) of a new X3D node (that acts as the prototype) is defined. Once declared, arbitrary instances of this prototype, which may have different property values, can be instantiated. Overall, X3D allows the definition of scalable scenes (existing scenes even can be imported via a special Inline node) and offers sufficient means to support advanced shape modelling with respect to arbitrary shapes, reuse and extensibility (Brutzman & Daly, 2007; Kloss 2010). Basic scene interactivity (scene navigation) is provided by the X3D browser itself. User interaction with as well as shape animation of scene objects is realized through a proprietary event-handling mechanism. So called ROUTE statements link compatible fields of different nodes for dynamic modifiability. When parsing the X3D code, an event graph of all ROUTE statements is built, allowing the X3D browser to execute the appropriate ROUTE statement once a certain node field value is changed. A change event is usually triggered through sensor nodes. For instance, a TouchSensor node, attached to a Sphere node, could listen for a user click event to start a cascade of chained ROUTE statements initiating an animation to permanently rotate the sphere2. In conclusion, the usage of predefined X3D nodes and ROUTE statements to forward field changes to other nodes permits the realization of basic interaction and manipulation functionalities. In addition, a Script node offers the possibility to implement arbitrary program logic using the ECMAScript3 interface. However, this internal proprietary forwarding mechanism is limited and requires a deep understanding of each node type and its fields to build a rather complex event graph of ROUTE statements within the scene description itself (Brutzman & Daly, 2007). In contrast, external programs, such as Java classes, can be granted full access to the scene graph. For this purpose, the X3D specification defines the Scene Authoring Interface (SAI), which is an abstract declaration of access and manipulation functionalities (Web3D Consortium, 2013). Concrete language bindings are offered for Java and JavaScript. The SAI mechanism allows to embed an X3D scene within the Web browser and dynamically modify the scene graph via external programs (e.g. a Java Applet). Disadvantageously, each X3D browser provides its own implementation of the SAI, which is delivered with the browser itself. Hence, an implementation of an X3D IVIS Web application using the SAI would be browser-dependent. These days, various open source and commercial X3D browsers exist (Brutzman, 2015), each providing a separate implementation of the SAI. To overcome this browser-dependency, the Web3D Consortium proposes an alternate approach to integrate X3D content within HTML Web pages, called X3DOM, as presented below.
2
The realization of a rotation animation is more complex than described. An additional TimeSensor node is required that loops a certain time interval. Furthermore, a RotationInterpolator node is used to interpolate the rotation of the sphere depending on the current time value of the TimeSensor node. 3 ECMAScript is a programming language interface standardized as ECMA-262 by the European Computer Manufacturers Association (ECMA) since 1998 (ECMA International, 2015).
P a g e 33 | 143
State-of-the-Art and Related Work
2.2.1.2 X3DOM as DOM-embedded Visualization The X3DOM project integrates X3D code directly into HTML Web pages, making the installation of additional X3D plugins obsolete (Behr, et al., 2009). Basically, the X3D nodes are embedded into the Document Object Model (DOM) of the Web browser. Thus, the whole scene graph can be natively accessed and manipulated through standard JavaScript code. Scene rendering can be done via preinstalled WebGL (most modern Web browsers natively support WebGL as plugin-free 3D graphics engine (Khronos Group, 2016)). Compared to the X3D/SAI approach for external program access to the scene graph, X3DOM offers nearly all capabilities of X3D (without internal Script node and the prototype mechanism (X3DOM, 2016)) but provides a more intuitive and native support of 3D multimedia content in Web applications. Any modification of 3D content is directly executed on the DOM elements. Another benefit is the use of HTML events like onClick within the scene declaration to simplify the implementation of user interaction compared to the rather complex event-handling mechanism (using X3D Sensor nodes and define a second co-existing event graph using ROUTE statements) of standalone X3D. Thus, X3DOM provides a declarative DOM-integrated approach to natively embed virtual 3D multimedia content in Web applications (Jung, et al., 2012). The Declarative 3D for the Web Architecture W3C Community Group aims to establish standardized formats and approaches to integrate interactive declarative 3D shapes to the HTML-DOM, allowing Web developers to easily add and modify 3D multimedia content within Web applications (W3C Community Group (Declarative 3D), 2016). On the 18th International Conference on 3D Web Technology (Web3D13), the work group gave an overview of current frameworks and an agenda to standardize Declarative 3D for the Web together with the W3C. As most promising approaches, X3DOM and XML3D have been identified (Jankowski, et al., 2013), highlighting the importance and relevance of the future-proof X3DOM approach. However, at the same time, these standardization ambitions also imply that the integration of declarative 3D multimedia content is still in the development process. For instance, since scene parsing and interactive event handling is done via JavaScript, the visualization of large datasets with the help of X3DOM and XML3D leads to performance issues (Le Feuvre, 2012). In summary, as state-of-the-art technology, X3DOM emerges to be the framework-ofchoice to embed 3D multimedia content within Web applications. The DOM-integrated, plugin-less solution integrates well with other key Web technologies like HTML 5, CSS or other JavaScript libraries and uses WebGL to natively render 3D shapes. Hence, within the scope of this Master thesis, X3DOM will be used to create interactive client-side data visualizations. 2.2.2 Modern Web Protocols for Bidirectional Communication To establish a Web-enabled bidirectional visualization pipeline, suitable Web protocols need to be discussed to avoid irrelevant network traffic in a client-server environment. As fundamental basis, the TCP/IP protocol family establishes connections between participants of the Internet to exchange messages (Goralski, 2009). On top of TCP/IP other protocols can be used for specific application purposes. Web-based applications
P a g e 34 | 143
State-of-the-Art and Related Work
usually use the HTTP/HTTPS protocol for communication (W3School, 2016 a). Following a request-response-pattern, Web browsers (clients) initiate any message exchange by sending a request to a Web server. The latter processes the received message, responds to the client and the HTTP-connection is closed. The type and content of this response varies from static HTML documents to more complex content like computed multimedia data (e.g. images or generated X3D scenes). HTTP/HTTPS protocols are stateless, meaning that each new request is treated independently and has to contain all necessary information to identify the same client. This session-concept is usually realized through cookies, which are exchanged between client and server (Shklar & Rosen, 2003). Regarding a bidirectional IVIS Web application, the HTTP/HTTPS protocols reveal several deficits. For one, each HTTP/HTTPS message contains numerous headers, often containing meta-information that remains equal for consecutive request/response messages. Hence, in a highly active application scenario, where messages are frequently exchanged between multiple clients and servers, this leads to a huge network overhead. More importantly, in a bidirectional application, both parties must be enabled to initiate message exchange, since possible data changes on the client or server side need to be published to each other’s side immediately. However, the HTTP/HTTPS protocols only allow the client to trigger message exchange. Once a server has sent its response to the requesting client, the connection is closed. As a result, any server-side data changes cannot be actively pushed to connected clients. Thus, clients are forced to repeatedly query the server for any possible data changes, even if nothing has changed. This mechanism is often denoted as polling (Lubbers & Greco, 2015). Due to these obvious deficits, a different protocol is desirable in order to reduce irrelevant network traffic and message overhead. Since 2009, the WWW Consortium (W3C) recommends the WebSocket protocol to establish a full-duplex bidirectional communication channel (Fette & Melnikow, 2011). The initial HTTP/HTTPS connection is replaced by a socket, creating a permanent communication channel, where each side may send arbitrary messages at arbitrary points of time. This eliminates the client-side need to regularly query the server for data changes. Instead, the server is enabled to broadcast events to all connected clients at event time. As a result, the WebSocket protocol immensely reduces message overhead, irrelevant network traffic and complexity compared to HTTP/HTTPS polling approaches (Wang, et al., 2013). Developed as a key component of HTML5, the WebSocket protocol and its accompanying API present a powerful, yet simple, base technology to conceptualize an interactive synchronization-enabled Web-based IVIS application.
2.3
Related Work
After introducing state-of-the-art key technologies and approaches, this section addresses related work with regard to the key aspects of the proposed 3D IVIS infrastructure. It is investigated how other researchers utilize the identified technologies and approaches within their Web applications. The relevant key aspects are:
3D User Interface: how do other approaches establish a three-dimensional user interface to visualize abstract data
P a g e 35 | 143
State-of-the-Art and Related Work
Abstract Data and Data Sources: are there other approaches that allow arbitrary domain data stored in heterogeneous data sources? If yes, what are the impacts on the system design and how are users enabled to choose or configure the displayed data.
(Bidirectional) Visualization Pipeline: How do other approaches transform abstract data to visualization objects in a configurable manner? And more importantly, are there other approaches that allow reverse transformations from visualization objects to source data in order to persist modifications? The latter question also implies how they establish suitable synchronization techniques.
Hence, the focus of the related work analysis is to verify that no other 3D IVIS infrastructure exists, which is capable of synchronizing between arbitrary abstract data from heterogeneous data sources (based on the mediator-wrapper pattern) and configurable Web-based 3D visualizations (e.g. using X3D/X3DOM). Starting with a reference implementation from the year 1990, the subsequent paragraphs introduce identified approaches covering one or more of the listed key aspects. In the late 1990’s a group of scientists designed an architecture of a database-driven 3D IVIS system realizing the three functional core features Server Side Information Visualization, Runtime Information Visualization and Synchronization, as introduced in section 1.2 (Leissler, et al., 1999). Figure 5 presents their entire system architecture. The use case of the group was to provide an interactive 3D user interface in Web-based information retrieval scenarios. As base technologies, client-side VRML scenes are linked with a server-side relational database by an application server that handles communication. The VRML scenes might be part of a Java applet that runs on the client side. Runtime trigger Runtime Loading time
VRML Scene
Application Server
Trigger Node notification SQL Node results
. . .
Trigger notification server
SQL statement
JDBC server
Trigger
Search request
Web server Web server
SQL statement Result rows
Trigger Node VRML scene
VR Extension
DB Client
SQL statement results
VRML Scene
DB Client
notification
RDBMS
. . . DB Client
SQL Node
Figure 5 System architecture of a bidirectional database driven 3D IVIS Web application (figure taken from (Leissler, et al., 1999))
P a g e 36 | 143
State-of-the-Art and Related Work
The system architecture covers several actions. Initially, a user may request information from the database via the application server. Since a VRML scene must be returned, the authors used VRML templates with embedded SQL nodes to integrate database content on scene generation (Server Side IVIS pattern). These SQL nodes represent a VRML extension, based on the VRML prototype concept, to insert SQL statements in VRML scenes. Inside a running VRML scene, additional information may be requested through a predefined SQL statement of an SQL node. The returned results (encoded in VRML) are then distributed to preconfigured scene nodes. Moreover, with the help of predefined SQL nodes, client-side modification of the displayed information can be published to the server-side database as well (Runtime IVIS pattern). Finally, any changes of the data model inside the database can be broadcast to connected client scenes due to a trigger mechanism (Synchronization pattern). A database trigger notifies a trigger notification server, which, in turn, notifies the registered clients, e.g. through the use of a TCP/IP socket. The authors developed another VRML extension, the Trigger node, to handle these notifications. Once a Trigger node receives a notification of the trigger notification server, it delegates the actual retrieval of the updated database content to an SQL node (Leissler, et al., 1999). Although the approach of Leissler et al. conceptually fulfilled many requirements of a synchronization-enabled 3D IVIS Web application, it has some limitations. First, it consists of a database driven architecture. A more generic approach would consider multiple heterogeneous data sources based on a mediator-wrapper pattern. Second, the usage of the non-standardized VRML extensions SQL node and Trigger node proves a proprietary, database specific specialization. For each different data source, a new type of extension must be implemented to insert predefined data source queries into the scenes. At last, VRML has evolved to the modern standard X3D, which currently evolves to declarative 3D candidate X3DOM. Whereas VRML and X3D need plugins for Web browser support, X3DOM is natively supported by modern Web browsers. This development of the base technologies VRML/X3D/X3DOM as well as the rise of new Web protocols demand a re-conceptualization towards a state-of-the-art IVIS infrastructure. Recently, 3D Information Visualization has experienced a broad application in several disciplines. From simple information visualization purposes up to collaborative scenarios, various applications in the fields of medicine (Settapat, et al., 2010), education (Nicolaescu, et al., 2015), cultural heritage (Waibel, 2016) or GIS (Geo Information Systems) (McCann, et al., 2014) have been realized. Considering the last few years, the number of projects that use a 3D virtual space for information visualization purposes has grown. For instance, to effectively compare multidimensional time series information, a 3D bar chart environment was developed by Akase & Okada (2015). Another example is the 3D-scene-graph-based presentation of Linked Data for interactive browsing and querying (Schubotz & Harh, 2012). The authors combine classical information retrieval techniques with 3D visualization of the results to create a visual search engine that enhances exploratory discovery and insight of data. They also highlight that in the context of huge and diverse collections of query results 3D visualizations are more capable of helping the user to perceive the data and its relationships compared to text-based retrieval systems. As proof of concept, they combined abstract data on the earth’s gross domestic
P a g e 37 | 143
State-of-the-Art and Related Work
product (GDP) with geo-services to visualize each country’s GDP on a world sphere (Schubotz & Harh, 2012). Notably, in geosciences the emerging advancement of 3D technologies and Web services have caused a tremendous rise of projects visualizing geodata in interactive 3D virtual environments. The metaphor of an earth sphere proved the successful establishment of several globe frameworks, like popular Google Earth (Google Earth, 2016), Nasa World Wind (Hogan & Kim, 2011) or the Cesium engine (Analytical Graphics, 2016), that might be used as a base platform to create and display 3D geo-data. Li et al. (2015) developed a real-time 3D visual earthquake information system that makes extensive use of geo Web services like Web Map Service (WMS) or Web Feature Service (WFS) to retrieve real-time earthquake data from a database and visualize it on a virtual globe to improve decision-making for researchers and administrators. Similarly, such virtual globes are ideally suited to display 3D city models, which can be interactively explored, and provide further analysis functionalities (Chaturvedi, et al., 2015). Via Web services, several kinds of data (e.g. map layers, remote sensing images, elevation grids or other 3D models) can be combined in a unified virtual environment (Hu, et al., 2013). Hu et al., as well as Klimke & Döllner (2010) developed a collaborative 3D GIS environment, where users may annotate or even modify 3D buildings of a virtual city model, to support public participation and decision-making. They implemented a synchronizing module that registers clients and eventually synchronizes them by broadcasting any usergenerated event to all other registered clients. Whereas the aforementioned projects used virtual globe frameworks for display, other projects utilize X3D/X3DOM for content visualization. For instance, the Web3DGIS system (Rodrigues, et al., 2013) requests a virtual city model encoded in CityGML4 via WFS, and converts it into a Web browser embedded X3DOM scene through XSLT5. Moreover, the system allows further data queries in the CityGML dataset (e.g. query attributes of a certain building). The Spatial Temporal Oceanographic Query System (McCann, et al., 2014) also utilizes X3DOM to visualize data from a database. In addition, users may interactively select the data they wish to see causing the system to dynamically retrieve the data and map it to the elements of the X3DOM scene graph. Apart from geo-sciences, 3D user interfaces are emerging in other fields of research, particularly education and medicine. Settapat et al. (2009) worked on a collaborative virtual environment for distance learning using a Web-based Model-View-Controller framework. Based on X3D, they realized a 3D real-time client-server architecture that stores generated X3D files in a central database. As proof of concept, they used this framework to implement a 3D reconstruction application in a medical use case to reconstruct a virtual model of the human brain scanned by magnetic resonance imaging (Settapat, et al., 2010). The sequence of 2D images from the magnetic resonance imaging process is transformed into a virtual X3D replication in real-time to help medical staff in
4
CityGML is an XML based format to encode virtual city models. It is an extension of GML (Geography Markup Language) and supports the definition of diverse level of details (LOD) of city models (OGC, 2012). 5 XSLT (XML Stylesheet Language - Transformation) is an XML based programming language to transform arbitrary XML code to arbitrary output, e.g. other XML structures or completely different formats (Clark, 1999).
P a g e 38 | 143
State-of-the-Art and Related Work
educational and medical purposes. Due to a consecutive evaluation, where Settapat et al. compared 2D versus 3D representation of magnetic resonance imaging results with regard to information visualization satisfaction, usability and operation as well as overall system satisfaction, they concluded that an interactive 3D model was significantly preferred. A similar motivation initiated another Web-based collaborative learning environment that uses an X3DOM-based user interface in medical teaching scenarios, where the user’s viewpoint can be synchronized with a superior teacher’s viewpoint and, in addition, users may annotate the object for easier discussion (Nicolaescu, et al., 2015). The displayed artefacts and annotations, which are persisted in separate databases, are synchronized due to near real-time updates between learners and tutors. Via this system spatially disjoint users may collaborate and discuss their understanding of the model in a synchronized view in order to gain more insight in less time. In summary, various visualization systems and approaches exist that make use of a 3D user interface for data display. The motivation often is to enhance user perception and insight of the displayed data. However, most systems are designed for a specific context, whether it be applications in the fields of geosciences, medicine, cultural heritage or education. This leads to specialized and domain-focused application pipelines including static and unmodifiable mapping definitions from abstract data to visualization objects that make it hard to use those applications out of their domain. Furthermore, they are often restricted to a single data source (e.g. a central database). A more generic approach would provide a flexible and configurable system, where arbitrary abstract data from diverse heterogeneous data sources can be transformed to configurable visualizations objects, like the initial approach of Leissler et al. (1999) from the beginning of this section. Such a configurable approach provides a huge benefit regarding generic information visualization purposes, since configurations can be adapted to different use cases and scenarios. A literature research revealed that projects, which consider a system architecture for configurable and flexible generation of 3D multimedia content, are rare. Subsequently, two contemporary paradigmatic approaches are explained in more detail. One approach towards a configurable 3D IVIS Web infrastructure is called Flex-VR (Walczak, 2012 a). Walczak’s aim was to implement a configurable system to enable domain experts to easily create and configure 3D multimedia content. Although configuration always restricts the creation of 3D models and their interactive behaviour, he highlights the simplicity of configuration. From the perspective of a domain expert, modelling the shape and, in particular, the interactive behaviour of 3D objects using a 3D format like X3D can be complicated (Walczak, 2012 a). Walczak points out the deficits of the proprietary event graph (e.g. ROUTE statements of X3D) that co-exists beneath the scene graph. Due to modifications of the scene graph (e.g. add/remove nodes) the event graph has to be checked for consistency. He concludes that a domain expert is hardly able to implement more complex 3D model behaviour using these means. Instead Walczak proposes the Flex-VR approach for a simplified construction and modification of 3D multimedia content. Based on configurable templates, he defines so-called VRBeans, which can be embedded in a configurable presentation space. VR-Beans are essentially Script nodes that consist of a behaviour script, multiple resources like image/movie files or 3D scene objects and optional parameters for configuration. The behaviour script allows the placement of the resources inside a running scene as well as
P a g e 39 | 143
State-of-the-Art and Related Work
the definition of actions that can be triggered on a specified event. Through composition of such configurable VR-Beans and the intensive use of templates, a domain expert is enabled to construct complex scenes with interactive elements. The VR-Beans itself are encoded in VR-BML (Behaviour Modelling Language), an abstract XML-based modelling language for any scene-graph-based 3D format like X3D (Walczak, 2012 a). The idea to define diverse templates for diverse application scenarios motivated Jung et al. (2012) to develop the instant3Dhub system, which comprises a Web application deployment architecture to support decision-making. Based on a service oriented architecture, they designed a scalable and flexible server portal that combines predefined application templates with suitable 3D data to compose an interactive 3D visualization based on X3DOM (Jung, et al., 2012). With respect to configurable information visualization, the key component of instant3Dhub is the application template. Such a template may be defined by a domain expert and comprises HTML documents (which contain all necessary information for client-side display), data references (external resources that are retrieved and integrated into the template on demand) and metadata (e.g. defining data conversions for retrieved external data). In answer to a client request, the system identifies the application template, retrieves necessary external data, executes data conversions or other processing steps, and eventually instantiates the template with the results. Moreover, since clients may connect to the system via diverse devices with varying hardware resources (e.g. computer or smartphone), instant3Dhub offers a dynamic rendering module that inspects the clients’ capabilities to decide whether the clients’ hardware resources are sufficient for real-time rendering. In case of insufficient resources, instant3Dhub renders the scene on the server and streams 2D images to the client (Jung, et al., 2012). In conclusion, they denote this encompassing flexible software architecture with Visualization as a Service (instant3Dhub, 2016). Both presented approaches are based on a template mechanism to offer flexible definitions of IVIS applications for several use cases. However, both do not consider the use case of user updates to the underlying data sources within their architecture. Moreover, an explicit synchronization mechanism is missing that keeps data sources and all connected clients consistent.
2.4
Discussion and Remaining Challenges
Section 2.3 introduced past and current approaches to use interactive 3D graphics technologies for Web-enabled information visualization scenarios. With regard to the motivated core features of a synchronization-enabled 3D IVIS infrastructure from section 1.2, many systems provide the ability to request data and visualize it as interactive 3D shapes. Some approaches even enable users to dynamically configure the application and the visual mapping with the help of templates. However, most applications focus a unidirectional visualization pipeline and do not consider the use case to modify the source data through the visual interface. Thus, most system architectures neglect synchronization mechanisms to ensure a consistent state at all clients. At least, several applications in the fields of geoscience and distance learning were identified that designed synchronization mechanisms to share annotations on a common visualization (often realized as an
P a g e 40 | 143
State-of-the-Art and Related Work
additional system component that registers clients and shares updates). Yet, nearly all presented systems are designed for specialized application domains with the exception of the approaches of Walczak (2012 a), Jung et al. (2012) and Leissler et al. (1999). Notably, the latter implemented a database driven, flexible IVIS system that keeps multiple connected clients synchronized. The evolvement of several base technologies and architectural patterns justifies a re-conceptualization towards a more generic and state-ofthe-art IVIS application that visualizes content from various heterogeneous data sources. To pick up the motivated research questions and open issues from section 1.3, the following remaining challenges can be concretized with the presented state-of-the-art:
A generic architecture/mechanism to access arbitrary heterogeneous data sources through a unified interface is aspirational. Ideally, new data sources can be added to an already deployed system dynamically. In section 2.1.2 the mediator-wrapper pattern has been introduced to solve this issue. Via a global schema, the system offers a unified interface to access several data sources with dissimilar local data schemas. An open issue is to identify a suitable technology to represent the global schema including the technology to execute queries against it.
Modern Web technologies and protocols like the WebSocket protocol offer the possibility to simplify the system architecture of a bidirectional IVIS system that enables both clients and application server to trigger and publish updates of the data model. Hence, consistency between all parties can be guaranteed and network traffic be reduced to a minimum (in contrast to client-side polling mechanisms or additional registration system components as mentioned in section 2.2.2). Hence, a remaining challenge is to integrate modern Web protocols and technologies to simplify the system architecture of a generic synchronization-enabled IVIS Web application.
To enable data modifications through a visual interface, the IVIS Reference Model has to be augmented with an additional mechanism to support dynamic data as well as user-triggered data modifications. This includes several unresolved issues in its realization. Particularly, a resolvable and unambiguous mapping between abstract data sources and derived visual shapes must be established in order to link user modifications of visual properties to the correct data source attributes. In addition, an IVIS application has to solve the following conflict: modifications of the visual shapes should be as intuitive as possible, but accidental modifications have to be prevented.
The user should have the possibility of altering the visual mapping definitions. Thus, a flexible and user-configurable mapping mechanism has to be established to transform abstract data attributes to visual properties of virtual shapes. From the user’s perspective, reconfiguring the visual mapping can increase perception and insight of the visualized data. In section 2.3 two approaches were presented that used configurable templates to realize this flexibility. Another option could be the use of a configuration file that can be dynamically adapted to diverse use cases.
P a g e 41 | 143
State-of-the-Art and Related Work
Existing related work solves parts of these challenges, mostly in the context of a certain domain of interest. However, a universal application would be designed in a generic and flexible manner so that it can be configured for deployment in different use cases and application domains. As a first step towards this application, the central goal of this thesis is to combine the identified contemporary (Web) technologies and architectural patterns to conceptualize a more generic state-of-the-art synchronization-enabled Web-based 3D IVIS infrastructure. The resulting concept is presented in section 3, addressing the remaining challenges with regard to the motivated IVIS infrastructure. It may serve as a starting point for future consecutive research and development.
P a g e 42 | 143
Conceptualization and Modelling
3.
Conceptualization and Modelling
The conceptual modelling comprises three main subjects. First, to manifest the concept of a synchronization-enabled visualization pipeline, the IVIS Reference Model can be refined as proposed in section 3.1 Second, a conceptual system architecture of the proposed 3D IVIS infrastructure can be derived, which may serve as a foundation to couple the identified key technologies. The resulting architecture blueprint is addressed in section 3.2. Third, section 3.3 presents a more detailed abstract description of the three core functional features Server Side Information Visualization, Runtime Information Visualization and Synchronization relating to the extended IVIS Reference Model and refining the architecture blueprint. Note that the thesis does not provide a formal information/data model, specifying how to model domain entities and their relations. Since the main focus of this thesis is to identify modern technologies and approaches to develop a first draft of the proposed bidirectional IVIS infrastructure, these aspects have not been formalized. How the prototypical implementation defines the data model is elaborated in section 4.
3.1
Bidirectional Extension supporting Dynamic Data
A key element of a synchronization-enabled IVIS infrastructure is the ability to forward client-side data changes to the original data sources. In essence, abstract information must not only be transformed to visualizations as a unidirectional process. Instead, clients should be enabled to persist locally performed modifications of the visualized data instances by updating the data sources themselves (North, et al., 2010). Hence, the IVIS Reference Model presented in section 2.1.1 should be augmented with additional elements, as presented in Figure 6. The proposed extension explicitly considers dynamic data as well as client-triggered data modifications through the visual interface. In addition, clients are still able to perform the classical interactions (select and filter data, alter the visual mapping, or transform the view).
Figure 6 Extended IVIS Reference Model
In contrast to the classical IVIS Reference Model, the component Data Sources has been added explicitly to support multiple heterogeneous data sources, from which Raw Data can be acquired. The Data Sources component is accompanied by a new transformation
P a g e 43 | 143
Conceptualization and Modelling
called Data Generation and Selection to reflect the dynamic nature of Raw Data. It indicates that the content from Data Sources is selectable or might be dynamically generated at runtime (e.g. by complex simulation or computation algorithms). The dynamic output of this transformation is then delegated as Raw Data input to the classical visualization pipeline. Notably, in the case of generated data, the Raw Data content is not known a priori. To integrate the enablement of user-triggered modifications of the aspects of the reference model, a red backwards arrow is added at the top. Although the label of this arrow indicates several modification options, the focus of this thesis is to allow the modification of data instances (including the dynamic modification of certain properties of existing instances or the creation of completely new instances). By adding the described possibility of persisting modifications to data instances through the visual interface, a bidirectional relationship/transformation between stored datasets and their derived visualization objects is established. From a mathematical perspective, a bidirectional transformation Bx consists of a pair of unidirectional transformations between two information resources A and B, one transformation A B and another transformation B A as specified by Czarnecki et al. (2008). The ultimate goal of Bx is to maintain a consistent state between A and B, so that both reflect the same state of information. Usually, one of the two transformations dominates the other in the sense of data flow and is consequently denoted as forward transformation. If A B dominates B A, then A B is denoted as forward transformation and B A is denoted as reverse/backward transformation (Czarnecki, et al., 2008). With regard to the visualization pipeline, where abstract data is transformed to visualization objects based on a mapping between abstract information and concrete visual properties, consistency means that if a property value is changed on either side of the pipeline, the other side has to be modified accordingly to represent the same informational state. Moreover, the classical transformation from source data to view mostly dominates the reverse transformation from view to source data. However, this reverse transformation is one of the main characteristics of this thesis. In conclusion, the presented refinement of the IVIS Reference Model considers dynamic data as well as an increased empowerment of users by allowing them to not only reconfigure the displayed data, but actually modify it through the visual interface. Hence, this extension considers demands of current research topics in the fields of the “Participative Web” (OECD, 2007), Big Data management and visualization (Bornschlegl, et al., 2016), as introduced in section 1. In addition, by performing modifications via intuitive direct-manipulative interactions within the visualization itself, technical barriers are reduced (Leman, et al., 2010). Users do not have to switch applications or deal with complex query languages to persist modifications. Certainly, a synchronization-enabled visualization pipeline raises new challenges, as listed subsequently (list not exhaustive):
A two-way mapping definition between data structures and visualization objects is required. From a valid mapping definition, both forward and reverse transformation can be derived (Czarnecki, et al., 2008).
P a g e 44 | 143
Conceptualization and Modelling
A mapping definition implies a relation between source data and visual representation. Obviously, the 1:1 relation, where each single data record is mapped to exactly one visualization object, presents the simplest case. In general N:M relations, where N data records are visualized as M objects, require a well specified and resolvable mapping definition. For instance, abstract source data might be represented by a complex visual shape, which is composed of several single visualization objects. Another scenario is a single visualization object that aggregates multiple data records (e.g. cluster-representations). In particular, the reverse transformation from an aggregated visualization object must be resolvable in order to properly transform visual updates to all affected data records (Bartelme, 2005) (Hsieh & Shipman, 2002).
Considering user-triggered modifications: How can intuitive ways to apply data modifications be offered within the visualization? And, more importantly, how can accidental modifications of objects be prevented? This implies a deep understanding of the user’s intention. The user must always be aware of the consequences of his actions (Hsieh & Shipman, 2002).
Regarding network traffic and synchronization between multiple clients: Should each (possibly minor) data change be transmitted or should there be an option to work “offline” and only commit data changes on (user-initiated) command (realizing an asynchronous processing)?
How can no-data values of data attributes be effectively visualized? Not all visualization attributes (e.g. size, position, colour, transparency) offer intuitive options (Hsieh & Shipman, 2002).
How can concurrent or conflicting modification actions be handled best? In particular loss of effort and data must be prevented by all means.
An IVIS infrastructure must carefully solve the above listed issues in order to maintain a consistent state between the datasets and derived visualizations. More importantly, on the one hand, user interactions to perform data modifications through the visualization should be as intuitive as possible to enhance usability and user experience. On the other hand, by all means, accidental modifications must be prevented. The answer to this conflict might constitute the key issue to implement a synchronization-enabled IVIS infrastructure. Based on the presented refinement of the IVIS Reference Model, section 3.2 introduces an abstract system architecture including the main components of the proposed infrastructure.
3.2
Design and Conceptual System Architecture
Figure 7 presents an abstract architecture blueprint, illustrating how the key components of the proposed IVIS infrastructure work together. In particular, it serves as a basis to employ the previously described extended visualization pipeline allowing dynamic data as well as mediation between multiple data sources and creation of interactive cognitive efficient visualizations. The graphical notation uses UML component and deployment
P a g e 45 | 143
Conceptualization and Modelling
diagram elements (Object Management Group, 2015), but does not strictly conform to the UML specification. In particular, the arrows indicate, which component is notified by which other component, where solid arrows represent client-triggered events and dashed arrows represent actions caused by the IVIS system.
Figure 7 Architecture blueprint
Starting at the bottom, several heterogeneous data sources store relevant domain data. Each data source has its own syntactical and semantical interface for data access. The 3DIVIS-Mediator acts as the key component of the IVIS infrastructure, realizing the mediator-wrapper concept and, thus enabling the infrastructure to semantically integrate each different data source. This includes query handling, data source access as well as watching for any content changes at the data tier. In consequence, for each individual data source a corresponding wrapper component is included within the 3DIVIS-Mediator. Any retrieved data is forwarded to a visualization generation component that transforms each
P a g e 46 | 143
Conceptualization and Modelling
dataset into visualization objects. Noteworthy, this component should be kept generic and configurable in order to support arbitrary types of visual output. For instance, this could be realized by a template mechanism, where each template produces a different visual output of the domain data. The resulting visualization is sent to the requesting client via a notification/broadcast component. In particular, a broadcast to all clients is required, when the visualized content changes at data source level due to external or client-triggered events. Finally, on the client side, users may use their Web browser to explore and perceive data through an interactive 3D visual interface. In conclusion, the presented architecture blueprint represents an abstract concept to realize the bidirectional IVIS Reference Model as proposed in section 3.1. To further refine this abstract system architecture and provide details regarding the workflow between system components, section 3.3 continues with an abstract description of the characteristic features of a bidirectional visualization pipeline.
3.3
Abstract Description of Functional Features
In section 1.2, the three crucial functional features of a synchronization-enabled IVIS infrastructure were identified and shortly described. With regard to the presented extension of the IVIS Reference Model, more detailed descriptions on an abstract level are introduced subsequently, providing a refinement of the architecture blueprint from section 3.2. The presentation of each feature is accompanied by a graphical component diagram, illustrating how the core components of the system work together. The graphical notation is inspired by UML-notation (Object Management Group, 2015) but does not strictly conform to its specification. Each diagram is intended to show the main system components participating in the relevant feature. In addition, numbered arrows indicate the processing workflow between the components. Solid and dashed lines are used to separate between initial event steps (solid lines) and corresponding triggered response processes (dashed lines). 3.3.1 Server Side Information Visualization The first task of a synchronization-enabled IVIS infrastructure is to receive a client-sent data query and respond with an interactive Information Visualization. Considering the bidirectional visualization pipeline, this realizes the whole transformation from abstract data to visualization objects. Figure 8 presents the workflow between the participating abstract system components. Starting at the top, a client sends a query against the global schema of the IVIS system, requesting a visualization of certain datasets. A central mediator component analyses this query and identifies which wrappers are capable of retrieving the requested datasets from their data sources. The mediator creates appropriate subqueries and delegates them to the identified wrapper components. Before accessing the data source, each wrapper must transform the subquery into a local query against its local schema using local syntax and semantics of the data source. After retrieving the datasets from the data sources, they are returned to the mediator that collects the datasets from all wrappers and forwards them to a visualization creation component. This component performs the task of transforming the datasets into an
P a g e 47 | 143
Conceptualization and Modelling
interactive cognitive efficient Information Visualization, which is returned to the requesting client via the notification/broadcast component.
Figure 8 Abstract concept of Server Side Information Visualization feature
3.3.2 Runtime Information Visualization Whereas the previous feature represents the initial visualization generation of data, the runtime features are triggered from within an already existing interactive Information Visualization. Either, additional data may be requested and integrated into the existing visualization (as described in section 3.3.2.1) or a client may modify data instances through the visual interface (as shown in section 3.3.2.2). With regard to the bidirectional visualization pipeline, this also represents the transformation from abstract source data to visualization objects.
P a g e 48 | 143
Conceptualization and Modelling
3.3.2.1 Requesting Additional Data As depicted in Figure 9, the workflow of this feature equals the workflow of the Server Side Information Visualization feature (from section 3.3.1) in most parts. However, there are two important differences. First, this task is triggered from within an already existing interactive Information Visualization. Second, a client only requests additional data that is integrated into the already existing visualization. Hence, the system does not produce a new visualization, but only transforms the requested data into visualization objects that are properly inserted into the existing visualization on the client-side.
Figure 9 Abstract concept of Runtime Additional Data feature
P a g e 49 | 143
Conceptualization and Modelling
3.3.2.2 Client-Triggered Modification of Data Instances A core feature of a bidirectional visualization pipeline is that clients are allowed to modify data instances within their visualization and persist the changes at data source level. With respect to the extended IVIS Reference Model from section 3.1, this realizes the reverse transformation from visualization objects to source data. Compared to the previous features, the workflow of this feature differs more, as shown in Figure 10.
Figure 10 Abstract concept of Runtime User-Triggered Modification feature
First of all, this feature affects more than one client. While there is one active client that executes the update of a data instance within his local visualization, all other clients remain passive. To make the local modification of data instances persistent, the client
P a g e 50 | 143
Conceptualization and Modelling
sends a modifyInstance request against the global schema of the IVIS system. Again, the mediator determines, which wrappers (and hereby which data sources) are affected and creates appropriate subtasks. Once the modification process has succeeded or failed, a corresponding info message has to be generated and returned to the active client. Notably, the active client as well as all passive clients are not delivered with the associated visualization object of the modified instance, because this task is performed by the synchronization feature, which is triggered as soon as the content of any data source is modified, as presented in the subsequent section. 3.3.3 Synchronization / Server-side Broadcast In consequence of a client-triggered modification of data instances (section 3.3.2.2), the visualization pipeline has to be re-executed to generate the modified visualization object and distribute it to the affected clients. Considering the bidirectional visualization pipeline, this reflects the additional transformation Data Generation and Selection indicating the dynamic nature of the source data. Since a certain data instance was modified, all steps of the pipeline have to be redone for the changed instance. Thus, the required synchronization mechanism is established. Whereas the three previous system functionalities are triggered by active clients, this important feature is driven by the data sources themselves, as depicted in Figure 11. In contrast to the client-triggered modification of data instances (section 3.3.2.2), there is no active client in this feature. Here, the workflow between system components begins at the bottom data sources layer. Each data source stores relevant domain data, which might change over time due to either active clients persisting modified instances or any other external processes. On an occurring modification, all clients that currently visualize the affected domain data have to be informed and updated to maintain a consistent synchronized state. Consequently, when a data change is registered, this event causes the IVIS system to create and broadcast a corresponding message, informing all clients about the modified instances. Clients, in turn, may respond with an individual synchronization request. “Individual” indicates, that, in general, each client visualizes only a subset of the available data. Hence, each client has to send a different synchronization request to retrieve only those modified instances that are locally needed. As a result, the IVIS infrastructure processes each individual request by executing the well-known steps. Beginning at the mediator, the requested modified data is retrieved, transformed into visualization objects and returned to the client. This way, each local visualization is kept synchronized and consistent with the underlying data sources.
P a g e 51 | 143
Conceptualization and Modelling
Figure 11 Abstract concept of Synchronization pattern
Although this section only introduced synchronous event handling, the case of asynchronous processing should not be neglected. In general, considering a bidirectional visualization pipeline, both synchronous and asynchronous modifications of data instances should be possible. Whereas synchronous implies that each modification on one side of the pipeline is immediately published to the other side, an asynchronous processing would allow users to work out-of-sync on a certain visualization for a certain period of time. To be more precise, users could view and modify certain data locally without instantly synchronizing each change. Instead users might upload multiple changes at once. Also changes within the data sources might not be directly integrated into the users’ local scene, if they decide to work offline for a certain period of time. However, asynchronous processing raises new challenges. For instance, the user interface should offer suitable means to make the user aware of the consequences of working outof-sync. For instance, what if the user locally applies modifications to a certain data
P a g e 52 | 143
Conceptualization and Modelling
instance that has already changed? How can this conflict be solved best? Should the user be notified about it and have the option to decide which modifications should be persisted? Another aspect includes multiple modifications of the same data instance being unambiguously traceable back to the source data. By all means, loss of data or inconsistencies have to be prevented. Nonetheless, asynchronous use cases can be of high relevance, when the underlying domain data does not change frequently. Within the scope of this thesis, only synchronous processing was focused, since its implementation is more straightforward.
3.4
Summary
In summary, section 3 presents an abstract concept of the proposed IVIS infrastructure, comprising, a bidirectional extension of the IVIS Reference Model supporting dynamic data, an architecture blueprint and an abstract specification of the core functional features of a synchronization-enabled IVIS infrastructure. Of particular interest is the employment of the mediator-wrapper pattern within the conceptual system architecture to provide a homogeneous access to heterogeneous data sources.
P a g e 53 | 143
Specification and Proof-of-Concept Implementation
4.
Specification and Proof-of-Concept Implementation
To validate the abstract concept introduced in section 3, a prototypical implementation of a generic synchronization-enabled Web-based 3D IVIS infrastructure based on the identified start-of-the-art technologies from section 2.2 is presented subsequently. Starting with general implementation goals and requirements in section 4.1, the presentation of the prototype is continued by giving an overview of used technologies in section 4.2. Sections 4.3 to 4.6 then concentrate on the design and overall architecture of the infrastructure as well as implementation details concerning the realization of key aspects like mediating between heterogeneous data sources and the crucial functional features Server Side Information Visualization, Runtime Information Visualization and Synchronization.
4.1
General Implementation Goals and Requirements
In order to implement a prototype of the abstract concept of the proposed IVIS infrastructure, the presented technologies and concepts from sections 2.1 and 2.2 are utilized. With regard to the functional requirements, the detailed presentation of the core functional features from section 3.3 already covered the main demands from an abstract point of view. In short, multiple users should be enabled to concurrently interact with dynamic information visualization using a Web browser of their choice. After initial retrieval of an on-demand generated visualization (Server Side Information Visualization), users may request additional data or modify data instances through the visual interface (Runtime Information Visualization). Furthermore, any content changes on the server side should be broadcast to each affected client (Synchronization). As communication protocol between clients and the IVIS infrastructure, the WebSocket protocol is used to enable both sides to send messages at any point of time. On the client side, X3DOM is applied for visualization purposes as it natively integrates the Scene Description Language X3D into Web browsers DOM and, thus makes X3D content easily accessible through standard JavaScript. Noteworthy, it is expected that runtime access and manipulation of DOM-embedded X3D content is simplified in contrast to standalone X3D combined with additional Scene Authoring Interface (as justified in section 2.2.1.2). In particular, the advantages of both technologies X3D and HTML can be facilitated to offer an intuitive but powerful interaction interface. The overall implementation goal is to create a generic IVIS infrastructure that can be configured to operate in various distinct application scenarios. For that reason, the system architecture and relationship of base components has to be designed in a generic manner. To allow the linkage of arbitrary heterogeneous data sources storing arbitrary application data, a generic mediator-wrapper architecture has to be applied. This implies a mechanism to abstract from a specific application data schema and make retrieval and processing of discretionary data possible. Concerning visualization generation, a generic visualization generation component has to be employed in order to produce arbitrary cognitiveefficient information visualization outputs for discretionary application scenarios.
P a g e 54 | 143
Specification and Proof-of-Concept Implementation
As already mentioned in section 3, a formal information/data model representing entities and their relations has been neglected. Instead, the prototypical implementation is organized as follows: With regard to the visual structures, the information model of X3D/X3DOM is employed since any abstract data is transformed into X3D/X3DOM elements as a result of the visualization pipeline. Considering abstract data (structured data within the IVIS Reference Model), a prototypical XML data model is used to represent arbitrary domain data. Through the definition of dedicated XML mapping files, the infrastructure can be configured to different domain data. This process is elaborated in section 4.5.
4.2
Choice of Base Technologies
4.2.1 Server Side Technologies 4.2.1.1 Programming Language and Project Management Tools The whole server-side implementation logic was written with the object oriented programming language Java version 8 (Oracle, 2016 a). As project management tool, which aids the development process by managing external library dependencies, Apache Maven was utilized (The Apache Software Foundation, 2016 b). For version control, the complete source code is hosted as a public GitHub repository (Github Inc, 2016), accessible via the link: https://github.com/cDanowski/3D-IVIS-Mediator. Github is a modern platform to host software projects using open-source git (git, 2016) as main version control system. To write and execute automated test cases, the prominent JUnit framework, version 4.12 (JUnit, 2016) was applied. 4.2.1.2 Spring Framework for WebSocket Support Although there is a native Java WebSocket API integrated in Java version 8 (e.g. refer to Coward, 2014), the high-level WebSocket support offered by the open-source Spring Framework, version 4.2.6 (Pivotal Software, 2016 a), was favoured. In general, the Spring framework aids Java-based applications by providing high-level infrastructural support for various use cases and deployment scenarios and offers key features like dependency injection (also known as inversion of control, according to Fowler, 2004) as well as bean management and an implementation of a Web-enabled Model-ViewController (MVC) pattern (Dalling, 2009). In short, basing on Spring technologies, application developers can focus on the actual application logic since message and bean handling is managed by Spring components (Pivotal Software, 2016 a). Following Spring’s WebSocket support guide (Pivotal Software, 2016 b), it is recommended to not only implement a Java WebSocket handler alone, but use a fallback component named SockJS (SockJS, 2016 a). Because the WebSocket protocol is still relatively young compared to established protocols like HTTP, some Web browsers or routers might not support it correctly. In that case, SockJS offers fallback mechanisms to
P a g e 55 | 143
Specification and Proof-of-Concept Implementation
simulate a WebSocket connection by standard HTTP streaming or long polling techniques (Stoyanchev, 2012). Due to this fallback mechanism, no potential client is being rejected because of outdated technologies, which is a great advantage compared to standalone Java WebSocket API support. In various WebSocket programming guides, it is furthermore recommended to layer a high-level message protocol on top of WebSocket (Wang et al, 2013; Pivotal Software, 2016 b). This recommendation emerges from the fact that even though the WebSocket protocol offers binary and text message exchange, the semantics and content of these messages is completely undefined and left for specification by the actual application. Therefore, a higher level protocol like STOMP (Simple Text Oriented Messaging Protocol) (STOMP, 2012 a) should be layered on top of WebSocket to standardize communication (Wang, et al., 2013). Via simple text messages, STOMP realizes a publish-subscribe mechanism with a central broker component that manages connected clients and delivers any incoming message to the specified destination. In particular, clients may subscribe to a specific so-called STOMP-endpoint, which is controlled by the broker. An application or a client that intends to broadcast a certain message to other clients may only send that message once to the STOMP endpoint, from which the message is then broadcast to all subscribed clients. Even single users can be the target of a message as long as they have subscribed to a user specific destination. To distinguish between single user destinations and all-user-broadcast destinations, STOMP recommends two prefixes “/queue” and “/topic”, where “/topic” is used for all-userbroadcast destinations (STOMP, 2012 c). Figure 12 gives an exemplar overview of the most important message types and structures, according to the STOMP specification (STOMP, 2012 c). In general, a typical message, called “frame”, comprises a COMMAND, several headers and a body. For each of the three main actions (SUBSCRIBE, SEND, RECEIVE MESSAGE), an exemplar STOMP structure is listed. In particular, when SUBSCRIBING, clients deliver a unique id and a destination, to which they intend to subscribe. When SENDING a message, the destination as well as the message payload and content type are crucial components. Eventually, a broker distributes/broadcasts any message to all subscribers of the specified destination with the help of their unique id.
P a g e 56 | 143
Specification and Proof-of-Concept Implementation
“Generic Structure” COMMAND header1:value1 header2:value2 Body^@ “Client Subscription” SUBSCRIBE id:sub-1 destination:/topic/price.stock.* ^@ “Client Request” SEND destination:/queue/trade content-type:application/json content-length:44 {"action":"BUY","ticker":"MMM","shares",44}^@ “STOMP Server Broadcast” MESSAGE message-id:nxahklf6-1 subscription:sub-1 destination:/topic/price.stock.MMM {"ticker":"MMM","price":129.45}^@ Figure 12 Exemplar structures of typical STOMP messages/frames (STOMP, 2012 b)
Various concrete implementations of STOMP brokers exist (STOMP, 2015). Notably, the Spring framework offers a simple ready-to-use implementation of a STOMP-enabled WebSocket architecture with a simple in-memory STOMP broker as build-in component (Pivotal Software, 2016 b). Through appropriate configuration, an application server may serve as a processing endpoint in a STOMP environment, which receives client requests prefixed with a configured destination. The message processing workflow is illustrated in Figure 13.
P a g e 57 | 143
Specification and Proof-of-Concept Implementation
Figure 13 Spring Simple Broker Message Workflow (Pivotal Software, 2016 b)
As illustrated in the example, the MessageHandler receives messages prefixed with “/app”. After processing, the MessageHandler’s response is delegated to the SimpleBroker (the STOMP broker) that broadcasts the response to all clients subscribed at destination “/topic/a”. Of course, a message to the destination “/topic/a” will directly be broadcast to all subscribed clients. With regard to the prototypical implementation of the proposed IVIS infrastructure, the combination of Spring’s WebSocket framework, including SockJS as HTTP-fallback, and STOMP as high-level text-based publish-subscribe mechanism provides a powerful basis to build a high-level IVIS infrastructure. 4.2.1.3 Helper Libraries for Data Source Access As part of the mediator-wrapper architecture, the prototypical implementation comprises three concrete wrapper components allowing generic access to relational databases as well as CSV- and XML files. Within the scope of the implementation, concrete access to a PostgreSQL database (The PostgreSQL Global Development Group, 2016 c) has been realized through the generic JDBC interface that allows a homogeneous access to heterogeneous relational databases (Oracle, 2016 b). Concerning the file-based data sources CSV and XML, specific external libraries uniVocity, version 2.2.0 (UniVocity Data Integration, 2016) as well as jaxen, version 1.1.6 and dom4J, version 1.6.1 (Dom4J, 2016) were integrated to enable fast and robust parsing and persisting data from and to their respective file formats. Particularly, dom4J allows parsing XML files as well as executing XPath (Clark & DeRose, 2015) expressions to filter datasets. 4.2.2 Client Side Technologies Regarding an exemplar client-side application, any logic was written using standard Web technologies HTML, JavaScript and CSS to keep the client interface of the prototype as simple as possible. In addition, to simplify the development of application design and user interaction, the widely used JavaScript libraries Bootstrap, version 3.3.7 (Bootstrap,
P a g e 58 | 143
Specification and Proof-of-Concept Implementation
2016 a) and jQuery, version 3.0.0 (The jQuery Foundation, 2016) were utilized. The core of the client side implementation is the embedment of an interactive X3D scene through JavaScript library X3DOM, version 1.7.0 (Fraunhofer-Gesellschaft, 2016). It integrates X3D nodes into Web browsers DOM to make them accessible and manipulable through JavaScript and/or jQuery. Eventually, since the server-side IVIS infrastructure uses technologies STOMP as publish-subscribe and SockJS as WebSocket fallback mechanism, the client side requires the corresponding counterpart libraries stomp.js, version 2.3.4 (Mesnil & Lindsay, 2015) and sockjs.js, version 0.3.4 (SockJS, 2016 b) for communication with the server-side IVIS infrastructure. The employment of the mentioned client technologies as well as implementation details are elaborated in section 5.1, where a concrete exemplar client application is presented.
4.3
System Architecture
4.3.1 Instantiation of Conceptual System Architecture Having introduced the base technologies of the implemented prototype, this section utilizes them to derive a concrete system architecture. Universality is one of the main implementation goals, as identified in section 4.1. In consequence, the system architecture has to be designed in a generic fashion to support a variety of diverse use cases and concrete application scenarios. Based on the concrete technologies from section 4.2, the abstract conceptual system architecture proposed in section 3.2 can be instantiated according to Figure 14. On the client side, an HTML page, in which X3DOM scene nodes can be embedded, serves as the central user interface. On the server side, the 3D IVIS Mediator component comprises three layers. Any client side request is received by a Spring Controller class, which acts as the request controller referring to the MVC pattern and is in control of request processing. Typically, that involves the retrieval or modification of data instances as well as the generation of X3DOM scene nodes for visualization purposes. Afterwards, a Controller forwards the client query to the IVIS Mediator that analyses the request and delegates data retrieval or modification to the appropriate IVIS Wrapper classes. How the IVIS Mediator determines which IVIS Wrapper is in control of which data is elaborated in section 4.5. Within the presented prototype, the access to three heterogeneous data sources is implemented, each managed by a separate IVIS Wrapper class. To be precise, the relational database system PostgreSQL as well as the file-based data formats XML and CSV can be accessed. However, due to the generic design of the IVIS infrastructure, any additional data format can be supported, if an appropriate implementation of an IVIS Wrapper is added and registered via configuration, as explained in section 4.4.2.
P a g e 59 | 143
Specification and Proof-of-Concept Implementation
Figure 14 Prototypical system architecture of synchronization-enabled Web-based 3D IVIS infrastructure
If the client requests a visualization, the IVIS Mediator returns queried data instances to the Controller. The transformation from abstract data objects to visualization objects (e.g. X3DOM nodes) is subsequently performed by an Application Template class. Clients may choose, which template class is utilized, by transmitting the unique identifier of the Application Template. Because of this architectural decision, the universality of the IVIS infrastructure is preserved, since different implementations of an Application Template may produce different concrete visual outputs. Finally, the generic broadcast/notification component is instantiated by a Springintegrated STOMP broker offering dedicated STOMP endpoints, to which clients subscribe on initial page load. As each STOMP endpoint is associated with a certain
P a g e 60 | 143
Specification and Proof-of-Concept Implementation
functional feature, these endpoints are introduced in the corresponding sub-sections of section 4.3.2, which highlights dynamic aspects of the IVIS infrastructure. After subscription, response messages from the IVIS infrastructure directed at a certain STOMP endpoint, are automatically distributed to each subscribed client by the STOMP broker. 4.3.2 Interfaces of the IVIS Infrastructure In addition to the system architecture, it is important to explain, how clients may call a certain functional feature. Due to basing on the Spring MVC framework, the implemented IVIS infrastructure offers distinct interfaces, called URL endpoints, for each functional feature. An overview of all endpoints and interfaces between clients and IVIS infrastructure as well as between IVIS infrastructure and data sources is illustrated in Figure 15. Noteworthy, the presented components take control over events triggered from outside of the IVIS infrastructure. The graphical notation is inspired by UML (Object Management Group, 2015). Relevant system components are depicted as a component and each offered interface is visualized as a round connector annotated with the corresponding URL endpoint. A consumer of such an interface is portrayed as a halfround connector annotated with the action associated to the interface.
Figure 15 Interfaces of implemented synchronization-enabled Web-based 3D IVIS infrastructure
P a g e 61 | 143
Specification and Proof-of-Concept Implementation
Each of the three tiers of the IVIS infrastructure is depicted with its interfaces and possibilities to receive messages from other tiers. The central server-side 3D IVIS Web Application offers four separate STOMP endpoints as elucidated in Figure 16. For each of these endpoints, a corresponding Spring Controller class receives and processes the specific requests and, thus acts as the request handler. Conceptually, each core functional feature of the proposed IVIS infrastructure may be triggered by sending the appropriate request to the appropriate endpoint. Each endpoint expects a specified request message including necessary request-dependent information, as elaborated section 4.6. “Server Side Visualization Request” URL Endpoint: /initial/visualize handled by:
ServerSideVisualizationController
“Additional Data Request” URL Endpoint: /runtime/visualizeAdditionalData handled by:
AdditionalDataController
“Modify Data Instance Request” URL Endpoint: /runtime/modify handled by:
DataInstanceModificationController
“Synchronize Request” URL Endpoint: /synchronize handled by:
SynchronizationController
Figure 16 Request STOMP endpoints of the 3D IVIS Web Application
Usually, clients only send requests against the 3D IVIS Web Application. However, there is one exception. The IVIS Web Application may send a special notification towards clients, when any content of any data source has changed. This content change event is captured by independent monitoring components, in particular the DatabaseListener and SourceFileMonitor, as shown in Figure 15. Both watch the corresponding data sources for changes or receive a notification from the data source itself (e.g. by using a database trigger). Because the content of a data source was modified, clients need to be notified about this change in case they visualize the changed content. A content change event triggers the 3D IVIS Web Application to send the content modification notification to all connected clients via the STOMP endpoint /dataSourceChanged. To receive this notification message, clients must subscribe to this specific STOMP endpoint when they connect to the application. In response to a content modification notification, a client may send a synchronize request against the URL endpoint /synchronize of the 3D IVIS Web Application to retrieve the changed content and update the local visualization. More
P a g e 62 | 143
Specification and Proof-of-Concept Implementation
information about dynamic aspects is presented in section 4.6. The subsequent section builds on the presented system architecture and reveals details about the project structure as well as configuration aspects.
4.4
Project Layout and Configuration
4.4.1 Project Structure The 3D-IVIS-Mediator prototype is implemented as a Maven project. The project structure follows Maven’s restrictions (The Apache Software Foundation, 2016 a). In the project folder, the file pom.xml contains the necessary project definitions and dependency declarations. The complete code with all packages can be found at src/main/java, whereas Junit test cases are located in src/test/java. Under src/main/resources an exemplar implementation of a simple JavaScript client with all needed dependencies is stored. Section 5.1 demonstrates the client and explains how it communicates with the server-side IVIS infrastructure. During the build/deployment process, Spring and Maven set the file src/main/resources/static/index.html as the landing page. Beneath the typical Maven structure, an additional folder called data includes several configuration/mapping definition files in subfolder data/config as well as two exemplar source files, a CSV- and an XML file, in data/data_sources. The latter store relevant application data of an exemplar use case, as described in section 5.1. The significance of the configuration/mapping files is explained in section 4.5. 4.4.2 Server-Side Configuration of Spring, SockJS and STOMP broker In general, any project that is based on the Spring Framework requires configuration of common parameters and so-called bean definitions (Johnson & et al., 2016 c). Spring includes a beneficial mechanism to automatically manage dependencies between various Java components, called beans, by offering a specific Spring IoC (Inversion of Control) container. A Java class, which is declared as a bean, can then be automatically injected into other Java classes as class property. Via this concept, Spring realizes the inversion of control pattern, and, from a developer’s perspective, this simplifies the process of instantiating components at runtime because this task can be left to Spring’s IoC container. Left to do is to declare the bean definitions in a configuration file or, alternatively, in a Java class that is annotated with @Configuration. Afterwards, beans can be injected into other Java components by annotating the injected bean with @Autowired or using a so-called constructor injection, where the bean is used as a parameter of the constructor (Johnson & et al., 2016 c). Within the prototypical implementation, a Java-based configuration was defined in the class src/main/java/config/WebSocketConfig.java. Listing 1 represents a shortened overview of the configuration steps. First, the class WebSocketConfig is annotated with @Configuration as well as @ComponentScan to declare the base package containing Spring controllers and @EnableWebSocketMessageBroker to enable Spring’s
P a g e 63 | 143
Specification and Proof-of-Concept Implementation
simple STOMP broker. In addition, it inherits from Spring’s AbstractWebSocketMessageBrokerConfigurer, that declares two methods to be overridden. @Configuration @ComponentScan("controller") @EnableWebSocketMessageBroker public class WebSocketConfig extends AbstractWebSocketMessageBrokerConfigurer { /* * variable declaration (e.g. path to mapping files) omitted in * this listing * see Java class src/main/java/config/WebSocketConfig.java for * details */ @Override public void configureMessageBroker(MessageBrokerRegistry config) { /* * enable STOMP broker, to which client may subscribe in * order to receive synchronization broadcasts */ config.enableSimpleBroker("/topic", "/queue"); // a global application prefix config.setApplicationDestinationPrefixes(“/ivisApp”); // prefix for single user; if not declared is set to // “/user” per default by Spring config.setUserDestinationPrefix(“/user”); } @Override public void registerStompEndpoints(StompEndpointRegistry registry) { /* * 1. endpoint: initial request to visualize data */ registry.addEndpoint(“/initial/visualize”).withSockJS(); /* * 2. endpoint: runtime request (from within a running * visualization) to visualize additional data */ registry.addEndpoint(“/runtime/visualizeAdditionalData”).wi thSockJS(); /* * 3. endpoint: runtime request (from within a running * visualization) to send data modifications * to the server and apply them to the data * sources */ registry.addEndpoint(“/runtime/modify”).withSockJS();
P a g e 64 | 143
Specification and Proof-of-Concept Implementation
/* * 4. endpoint: synchronization endpoint. Distributes data * modifications to a requesting client */ registry.addEndpoint(“/synchronize”).withSockJS(); } /** * add spring beans for dependency injection * * here is just one single example! The actual class contains * more definitions. */ /** * create instance of {@link BookstoreApplicationTemplate} * * @return * @throws DocumentException */ @Bean public ApplicationTemplate bookstoreApplicationTemplate() throws DocumentException { return new BookstoreApplicationTemplate(); } // further bean definitions omitted Listing 1 Java-based Configuration of Spring beans, SockJS and STOMP broker. To view all configurations and bean declarations, the Java class src/main/java/config/ WebSocketConfig.java can be consulted.
Within the method configureMessageBroker() common parameters for Spring’s internal message broker are defined. This includes setting a global application prefix /ivisApp, which clients have to use to contact the application, and enabling the STOMP broker prefixes /topic and /queue and /user, which are used to distinguish, whether a message will be broadcast to all subscribed clients (/topic) or to a single user (/queue and /user). The four central server-side STOMP endpoints, to which clients may send requests, are defined in the method registerStompEndpoints(). Each endpoint definition is accompanied by the function call .withSockJS() in order to enable WebSocket fallback via SockJS. For each endpoint, a corresponding Spring controller class, annotated with @Controller, has to be implemented in order to handle requests. More details on the controller implementation are presented in section 4.6. Information on how clients may connect to the IVIS infrastructure and send requests against a dedicated endpoint is shown in section 5.1. Concerning bean definitions, any bean, that should be available for dependency injection can be defined using a method annotated with @Bean. As an example, Listing 1 contains a bean definition for the java object of type src/main/java/application_template/ ApplicationTemplate.java. It should be noted that this is the only place, where the
P a g e 65 | 143
Specification and Proof-of-Concept Implementation
bean is instantiated through a constructor call. To use this class as a dependency in other Java classes, it is sufficient to create a class property of type ApplicationTemplate and annotate it by @Autowired or using constructor injection (Johnson & et al., 2016 c). To see all necessary bean definitions of the implemented prototype, please refer to the original Java class.
4.5 Semantic Integration – Mediation between Heterogeneous Data Sources A crucial implementation detail is the realization of semantic integration of heterogeneous data sources. A generic mechanism is required to map between a single global data schema and multiple syntactically and/or semantically different data sources and their corresponding local schemas. Particular attention is paid to the universality of this mechanism in order to support arbitrary domain data stored in arbitrary data sources. Based on the mediator-wrapper pattern, this semantic integration is realized through multiple mapping definition files (located in the project folder data/config), which are presented subsequently. 4.5.1 Identifying Wrappers by XPath Selector Against Global XML Schema As a general implication, the IVIS infrastructure identifies elements of the global schema through XPath selectors (Mozilla Developer Network, 2016). Implicitly, the global schema is defined as an XML structure with child nodes and properties per node. Using XPath selectors, each node or node-property can be unambiguously selected. In consequence, the IVIS infrastructure expects client queries to contain an XPath selector against the implicit global XML-based schema. Comparing this selector with a predefined wrapper mapping definition, the infrastructure is able to identify, which concrete wrapper stores the selected data. The file data/config/GlobalSchemaToWrapperMapping.xml stores the relevant mapping definitions in an XML structure, as illustrated in Listing 2. For each selectable element of the global schema the mapping file contains a node with two subnodes, and . While the first represents an XPath selector against an element of the global schema, the second is of particular interest. It contains a list of nodes, each indicating that the wrapper-specific data source stores the selected element. The String value of each tag represents the Java class name of the associated wrapper implementation (instance of Java interface src/main/java/mediator_wrapper/wrapper/IvisWrapper.java). Obviously, at least one node should exist. If multiple nodes are defined, then the IVIS infrastructure has to notify each wrapper to perform the client-sent query and aggregate the results.
P a g e 66 | 143
Specification and Proof-of-Concept Implementation
xpath/selector/against/global/element XmlWrapper CsvWrapper DatabaseWrapper Listing 2 Generic mapping between element of global schema and wrapper instances
Note that each available instance of IvisWrapper (e.g. a database wrapper or an CSV/XML file wrapper) is declared as a Spring Bean and can, thus, be injected into the central src/main/java/mediator_wrapper/mediation/impl/IvisMediator.java component using Springs dependency injection mechanism. Accordingly, a list of all configured IvisWrapper instances is injected as class property to the IvisMediator. On initialization of the IvisMediator, the GlobalSchemaToWrapperMapping file is parsed and its entries transformed into a class property of type Map, with selector_globalSchema as key, and a List of all associated IvisWrapper instances as value. When a client requests data using an XPath selector, the Map is searched for a fitting entry, where the client-sent XPath selector equals the key to extract a List of all associated wrappers, which have to be informed to process the query. 4.5.2 Compose Subqueries for an Aggregated Object An XPath selector may point to a single leaf node or a single property, selecting only a single atomic item. Alternatively, it may point to a superordinate XML parent node that contains multiple properties and/or child nodes. In the latter case, the client intends to request an aggregated object, consisting of multiple atomic properties. However, as the query (the XPath selector) only points to the parent node, an additional mapping
P a g e 67 | 143
Specification and Proof-of-Concept Implementation
definition is needed to identify all associated atomic properties and return them as a composed object. For this purpose, the file data/config/SubqueryMapping.xml contains a corresponding entry to map a single XPath selector against the global schema to a list of subquery-XPath-selectors against the local schema, each pointing to an atomic property of the aggregated object. xpath/selector/against/global/element xpath/selector/against/global/element/@property1 xpath/selector/against/global/element/@property2 xpath/selector/against/global/element/subelement /property3 Listing 3 Mapping between single global selector and multiple atomic sub-property selectors
In summary, with the help of a single global XPath selector, each element of the global schema may be requested by clients. If the selector points to an aggregated object, the subquery-mapping file contains a mapping definition to acquire all associated subquery selectors, which are used to retrieve each atomic property of the requested object. With regard to the implementation, the subquery mapping is parsed and stored as a Java Map, similar to the wrapper-mapping definition from the previous section. To be precise, the Java component src/main/java/mediator_ wrapper/mediation/impl/SubqueryGenerator.java parses each entry as a Map entry with the XPath expression as key and a List of all expressions as value. Subsequently, the SubqueryGenerator is injected into the IvisMediator, enabling the latter to access the subquery mapping.
P a g e 68 | 143
Specification and Proof-of-Concept Implementation
4.5.3 Mapping Between Global and Local Selector The two previous sections presented mapping definitions using a global XPath selector against the global schema. Knowing which wrappers have to be notified and which subqueries to execute, the IVIS infrastructure still misses one crucial mapping step, namely to transform the global XPath selector against the global XML-based schema to a local selector against the local schema of each data source. In consequence, an additional mapping file has to be provided for each wrapper. Listing 4 shows the general structure of a global-to-local-selector-mapping file. For each selectable element a tag exists that maps a node against a node. xpath/selector/against/global/element LOCAL_SELECTOR xpath/selector/To/ID/element LOCAL_SELECTOR_ID xpath/selector/against/global/element LOCAL_SELECTOR Listing 4 Mapping between global and local selector
P a g e 69 | 143
Specification and Proof-of-Concept Implementation
Of particular interest is the syntax of the local selector being wrapper-specific, as it is only restricted to be a String value. As different data sources store their information in different ways, the LOCAL_SELECTOR String contains the necessary information that is analysed by the corresponding IvisWrapper instance. As an example, if the data source is in XML format, the local selector can be an XPath expression, whereas with regard to a relational database as data source the local selector String should contain at least tableand column name, separated by a specific character, to properly identify and access the correct element. In addition to these global-to-local-selector-mapping entries, the file contains two more mapping definitions, an and a mapping. The former is used to identify a unique ID property of datasets controlled by each wrapper. The latter contains a default query selector that is utilized in combination with the id property, if the content of a data source has been modified to extract the IDs of all modified datasets selected by the default query selector. In consequence, it should point to an aggregated object, e.g., when an application visualizes books, then the default query selector should point to the aggregated book object. Similar to the previous mapping definitions, the information of the global-to-localselector-mapping file are parsed and stored as Java properties for each individual implementation of IvisWrapper, comprising a Map to map the as key to the as value, and two separate properties storing the as well as the . For implementation details, please refer to the method instantiateProperties() of the Java class src/main/java/mediator_wrapper/wrapper/abstract_types/ AbstractIvisWrapper.java. In conclusion, using several mapping files realizes a generic and configurable semantic integration of heterogeneous data sources. Noteworthy, the implemented IVIS infrastructure is enabled to be employed for discretionary application scenarios with arbitrarily structured domain data. To add support for an additional data source, a corresponding implementation of the IvisWrapper interface has to be added to the source code.
4.6
Dynamic Aspects of Core Functional Features
After presenting static aspects of the prototype (architectural components as well as configuration and semantic integration aspects), this section focuses dynamic aspects, illustrating how the prototypical implementation instantiates the abstract functional features introduced in section 3.3. By describing the workflow from request over processing to response, the relationships between all system components are revealed. For this reason, UML sequence diagram notation (Object Management Group, 2015) is used to indicate the sequential processing steps performed by the participating system components. Thus, each sequence diagram shows the relevant system components at the top. To indicate when a certain component is active, UML-lifelines are used. Concrete actions of a component are represented by annotated arrows. The annotations mostly
P a g e 70 | 143
Specification and Proof-of-Concept Implementation
contain an abstract textual description of the action, but when formatted in italic they represent a method call. In addition to the workflow diagrams, for each feature, the associated request/response message format as well as the accompanying Spring controller interface are explained. Because of the basic Spring infrastructure, each message between clients and the serverside IVIS infrastructure is exchanged using the JSON format. According to the Spring reference guide (Johnson & et al., 2016 a), Spring may automatically convert the clientsent JSON message into an instance of a dedicated equally structured Java class, where the name of each Java property matches the associated element of the JSON message. Vice versa, the server-side response to the client is also transformed into an equally structured JSON representation. The whole request handling is executed by a Spring controller class annotated with @Controller. In particular, it is supposed to have a method annotated with @MessageMapping to handle requests against a dedicated endpoint (Johnson & et al., 2016 a), as shown in each of the subsequent sub-sections. 4.6.1 Server Side Information Visualization – Initial X3DOM Visualization 4.6.1.1 Request/Response Message When sending a request to the endpoint /initial/visualize, a client requests a new visualization. As request body, a server-side-information-visualization-message is exchanged between client and server-side IVIS infrastructure. A JSON representation of the message content is illustrated in Listing 5. The associated Java class can be found at src/main/java/controller/visualize/ServerSideVisualizationMessage.java. {
"applicationTemplateIdentifier" : "", "query" : { "selector" : "", "filters" : [ { "selector" : "", "filterValue" : "", "filterType" : "" } ], "filterStrategy" : "" }, "responseInfoMessage" : "", "responseScene" : ""
} Listing 5 JSON representation of server-side-information-visualization-message
The parameter applicationTemplateIdentifier stores the unique identifier of the application template, which is utilized to create the concrete visualization. The parameter query comprises the necessary information to select certain datasets. It includes several properties. For one, a selector against the global schema indicates, which objects should
P a g e 71 | 143
Specification and Proof-of-Concept Implementation
be visualized. Second, an array of filters is specified, each consisting of a selector, a filterValue and a filterType, which represents the comparison operator, e.g. EQUAL or GREATER_THAN. Available operators are defined in enumeration src/main/java/ ivisQuery/FilterType.java. Third, the parameter filterStrategy controls how to logically link each filter definition (logical AND or logical OR). The closing two parameters responseInfoMessage and responseScene are set by the server as result of the request processing. While the former may include an arbitrary response message, the latter stores the generated X3DOM scene as String, when the message is returned to the requesting client. 4.6.1.2 Controller Interface On the server side, the Spring controller class src/main/java/controller/ visualize/ServerSideVisualizationController.java handles client requests against the endpoint /initial/visualize. As shown in Listing 6, the method query() is configured to be the request handler by using the annotations @MessageMapping("initial/visualize") and @SendToUser(destinations = "/queue/initial/visualize", broadcast = false). Via the latter, the handler is configured to only return the computed response to the requesting client, instead of broadcasting it to all connected clients. As method parameter and response type, the java representation of the server-side-visualization-message presented in section 4.6.1.1 is set (as already mentioned, Spring automatically converts between the equally structured JSON representation and src/main/java/controller/visualize/ServerSideVisualizationMessage.java). @MessageMapping("initial/visualize") @SendToUser(destinations = "/queue/initial/visualize", broadcast = false) public ServerSideVisualizationMessage query(ServerSideVisualizationMessage serverSideIvisMessage) { // code omitted } Listing 6 Server Side IVIS request handler interface (java class src/main/java/ controller/visualize/ServerSideVisualizationController.java)
4.6.1.3 Workflow and Processing Basically, the processing of a server-side-information-visualization request consists of two consecutive steps. First, the requested data has to be retrieved from the data sources and, second, a transformation from the queried abstract data objects into visualization objects according to the requested application template has to be performed. Both processing steps are elaborated subsequently, starting with the data retrieval.
P a g e 72 | 143
Specification and Proof-of-Concept Implementation
As presented in Figure 17, a single CLIENT sends the associated server-side-informationvisualization-message, which is received by the ServerSideIvisController. There, the parameter query is extracted from the message object and forwarded to the IvisMediator via calling its queryData() method. The IvisMediator analyses the selector property of the query object to find appropriate IvisWrapper components for data retrieval. For this purpose, the IvisMediator refers to the GlobalSchemaToWrapperMapping definition as well as the SubqueryMapping definition, introduced in sections 4.5.1 and 4.5.2, to determine which wrappers have to be notified and which subqueries have to be executed to compose the requested object. Subsequently, for each identified IvisWrapper instance, the IvisMediator delegates data retrieval to the respective wrapper. Each wrapper transforms the global query including all subqueries into local equivalents using the global-to-local-query mapping definition, explained in section 4.5.3, and executes the actual data retrieval. For each queried object an instance of src/main/java/ivisObject/IvisObject.java is generated to have a mutual java representation of information from different data sources. In response, a list of all retrieved IvisObject instances is returned from each IvisWrapper to the IvisMediator that, in turn, aggregates all lists and forwards one composed list of all IvisObject instances to the ServerSideIvisController.
Figure 17 Workflow of server side information visualization request processing
P a g e 73 | 143
Specification and Proof-of-Concept Implementation
To transform all queried objects into visualization objects, the requested application template has to be determined. For this reason, the ServerSideIvisController extracts the name of the concrete implementation of src/main/java/application_template/ ApplicationTemplate.java from the request parameter applicationTemplateIdentifier, identifies the associated ApplicationTemplate implementation (currently only one implementation exists, refer to src/main/java/application_template/ impl/bookstoreTemplate/BookstoreApplicationTemplate.java) and delegates the transformation process by calling its method createInitialscene(). As a result, the ApplicationTemplate returns the generated visualization, i.e. as an X3DOM String comprising the whole scene description. Eventually, the ServerSideIvisController sets the parameter responseScene of the server-side-information-visualization-message and returns it to the client. 4.6.2 Runtime Information Visualization – Visualize Additional Data 4.6.2.1 Request/Response Message Sending a request to the endpoint /runtime/visualizeAdditionalData triggers the IVIS infrastructure to retrieve requested objects and transform them to visualization objects. As request body, a runtime-request-data-message, whose JSON structure and content is presented in Listing 7, is exchanged. In contrast to a server-side-informationvisualization request, this feature does not respond with a complete new scene, but with an array of single visualization objects (property additionalObjects), each comprising a unique id and the actual visualizationObject, which may be utilized by clients to integrate them into an existing scene. Particularly, the parameter visualizationObject may be an arbitrary object with additional properties or a simple String, e.g. an X3DOM String. The remaining properties of the message equal those of the server-sideinformation-visualization-message from section 4.6.1.1. The associated Java class can be found at src/main/java/controller/runtime/additionalData/RuntimeRequest DataMessage.java.
P a g e 74 | 143
Specification and Proof-of-Concept Implementation
{
"applicationTemplateIdentifier" : "", "query" : { "selector" : "", "filters" : [ { "selector" : "", "filterValue" : "", "filterType" : "" } ], "filterStrategy" : "" }, "responseInfoMessage" : "", "additionalObjects" : [ { "id" : "", "visualizationObject" : } ]
} Listing 7 JSON representation of runtime-request-data-message
4.6.2.2 Controller Interface Similar to the request handling of the server side IVIS feature, a dedicated Spring controller class (src/main/java/controller/runtime/additional_data/AdditionalDataController.java) handles client requests against the endpoint /runtime/ visualizeAdditionalData. Listing 8 contains the method interface of the associated requestAdditionalData() method. As it has the same method annotations with the same meaning as the ServerSideVisualizationController, introduced in section 4.6.1.2, the description is omitted here. @MessageMapping("runtime/visualizeAdditionalData") @SendToUser(destinations = "/queue/runtime/visualizeAdditionalData", broadcast = false) public RuntimeRequestDataMessage requestAdditionalData (RuntimeRequestDataMessage runtimeMessage) { // code omitted } Listing 8 Visualize additional data request handler interface (java class src/main/java/ controller/runtime/AdditionalDataController.java)
4.6.2.3 Workflow and Processing Essentially, the overall additional-data-request processing workflow equals the workflow of the server-side-information-visualization processing workflow, as presented in section 4.6.1.3. As illustrated in Figure 18, the workflow comprises the same two
P a g e 75 | 143
Specification and Proof-of-Concept Implementation
consecutive steps, first data retrieval and second transformation to visualization objects. However, there are certain key differences. For one, clients send a visualize-additionaldata-message that is received by the AdditionalDataController. The extraction and execution of the transferred request query works exactly the same as already described in in section 4.6.1.3. The next difference occurs as soon as the retrieved IvisObject instances are transformed into visualization objects. Calling the method visualizeData_runtime() of the ApplicationTemplate, the IVIS infrastructure aims to transform each single IvisObject into a single instance of src/main/java/ application_template/impl/ VisualizationObject.java, consisting of an id and the actual visualizationObject. In particular, the latter might be an X3DOM node declaration that can be embedded into an existing scene. So instead of a solitary complete scene description, the ApplicationTemplate returns a list of VisualizationObject instances. This list is successively set as parameter additionalObjects of the runtimerequest-data-message before it is returned to the client.
Figure 18 Workflow of visualize additional data request processing
P a g e 76 | 143
Specification and Proof-of-Concept Implementation
4.6.3 Runtime Information Visualization – Modify Data Instance 4.6.3.1 Request/Response Message To modify a certain property of a certain object instance, a client may send a runtimemodification-message against the endpoint /runtime/modify. Listing 9 represents the JSON message structure, which again comprises the already explained parameters applicationTemplateIdentifier, query and responseInfoMessage. This time, the parameter query stores an XPath expression selecting the instance that should be modified. In addition, three supplementary parameters are necessary to execute the modification. wrapperReference stores a String value pointing to the associated wrapper of the selected object instance. When each visualization object is delivered to a client, the IVIS infrastructure adds meta information to the object including a reference to the IvisWrapper that retrieved the object from its data source. Hence, from the perspective of the IVIS infrastructure, this opposes a simplification in identifying, which wrapper has to perform the modification task. With the help of the last two message properties propertySelector_globalSchema and newPropertyValue, clients specify which property of the data instance should be updated with which new value. The associated Java class is located at src/main/java/controller/runtime/modify/RuntimeModificationMessage.java. {
"applicationTemplateIdentifier" : "", "query" : { "selector" : "", "filters" : [ { "selector" : "", "filterValue" : "", "filterType" : "" } ], "filterStrategy" : "" }, "responseInfoMessage" : "", "wrapperReference" : "", "propertySelector_globalSchema" : "", "newPropertyValue" : ""
} Listing 9 JSON representation of runtime-modification-message
4.6.3.2 Controller Interface To handle data instance modification requests the Spring controller class (src/main/java/controller/runtime/modify/DataInstanceModificationController.java) offers the updateDataSource() method, which is annotated with the already described annotations @MessageMapping and @SentToUser (please refer to section 4.6.1.2 for details about their usage).
P a g e 77 | 143
Specification and Proof-of-Concept Implementation
@MessageMapping("runtime/modify") @SendToUser(destinations = "/queue/runtime/modify", broadcast = false) public RuntimeModificationMessage updateDataSource (RuntimeModificationMessage runtimeModificationMessage) { // code omitted } Listing 10 Modify data instance request handler interface (java class src/main/java/ controller/runtime/DataInstanceModificationController.java)
4.6.3.3 Workflow and Processing When
a
client-sent
runtime-modification-message
is
received
by
the
DataInstanceModificationController, it directly forwards the whole message to the IvisMediator. The message contains a wrapperReference parameter that points to the target IvisWrapper implementation, to which the modification task is submitted via its method modifyDataInstance(). The target wrapper extracts the message properties (global) query, propertySelector_globalSchema and newPropertyValue to
determine which target object instance and property should be updated with which new value. To be precise, the selector property of the query as well as the propertySelector_globalSchema are transformed into their local equivalents using the global-to-local-selector mapping, as described in section 4.5.3. With this information, the target wrapper is able to properly execute the modification and persist it within the data source. Hereby, the concrete persistence process may vary for different concrete wrappers. For instance, the DatabaseWrapper builds and executes an UPDATE SQL statement, whereas XmlWrapper and CsvWrapper parse the whole file, identify and update the target instance and write all items back to the source file. Once executed, a Boolean property is returned from IvisWrapper over IvisMediator to the DataInstanceModificationController, indicating whether the modification was successful or failed. The controller sets the parameter responseInfoMessage of the runtime-modification-message accordingly and returns it to the client. Note that the IVIS infrastructure does not compute and return the modified visualization object directly, because the client-triggered data instance modification will automatically trigger a datasource-change event, which, in turn leads to a notification of all clients to re-request modified data instances, as presented in section 4.6.4.
P a g e 78 | 143
Specification and Proof-of-Concept Implementation
Figure 19 Workflow of modify data instance request processing
In a similar manner, an additional functional feature to insert new object instances into a data source could be offered to clients. But within the prototypical implementation, this feature is not yet supported. 4.6.4
Synchronization – Notify Clients about Content Update
In opposite to the previous client-triggered functionalities, the synchronization feature is triggered, when the content of any data source is changed. This has a great impact on the whole workflow of event processing. Synchronizing all clients by broadcasting this datasource-change-event constitutes the key feature of the proposed IVIS infrastructure. In consequence, the synchronization feature comprises two different messages that are exchanged. First, to notify all connected clients, the IVIS infrastructure sends a datasource-change-message to all currently connected clients. Second, each client may, in turn, send a synchronization request to retrieve modified content and update his/her local scene. With this two-step synchronization procedure, the IVIS infrastructure guarantees that client-side visualizations reflect the most current state of the data source contents. Section 4.6.4.1 provides an overview of how the IVIS infrastructures generates and receives data-source-change-events for all implemented data sources. Subsequently, both messages as well as the controller interface and the detailed workflow are presented.
P a g e 79 | 143
Specification and Proof-of-Concept Implementation
4.6.4.1 Watching Data Sources for Changes Within the IVIS infrastructure there are dedicated monitoring components that watch the data sources for modifications. In particular, the two file based data sources XML and CSV located at data/data_sources are watched by the Java component src/main/java/mediator_wrapper/mediation/impl/dataSourceMonitor/Source FilesMonitor.java that utilizes the Java WatchService API (Oracle, 2015). The concept behind the WatchService API involves having a certain folder being watched
for modification events like creation, deletion or modification of files causing the WatchService to generate an associated WatchEvent, which can be consumed by another Java component to perform appropriate processing steps (Oracle, 2015). In consequence, the SourceFileMonitor is initialized to watch the folder data/data_sources for creation and modification events of the XML or CSV files. It then runs in an own Thread to constantly check the WatchService for any generated WatchEvent. If an unprocessed WatchEvent occurs, then the name of the modified source file can be retrieved from it and appropriate processing steps will be performed (Oracle, 2015). For instance, to identify, which object instances were modified, there are so-called shadow-copies of the actual source files in project folder data/data_sources_shadow_copies, whose contents can be compared to the contents of the modified original source files located in data/data_sources. Once checked, the shadow-copy of a modified source file is overridden with the modified content to ensure that the IVIS infrastructure can properly process a consecutive modification event. With regard to watching a relational database for changes, database management systems offer the concept of a database trigger, which may perform a dedicated action BEFOR, AFTER or INSTEAD OF a certain Statement (Oracle, 1996). For instance, a database trigger may react on a modification of entries of a certain relation/table and send a notification about this event. Notably, a database trigger may be triggered once for a whole Statement or for each single ROW that is affected by the Statement (Easy Computer Academy, 2016). Within the IVIS infrastructure, the access to a PostgreSQL database is implemented. To be notified about modifications, the IVIS infrastructure utilizes PostgreSQL’s Notify/Listen concept, which serves as an extension to standard JDBC API (The PostgreSQL Global Development Group, n.d.). The core feature is that a dedicated database trigger may send a NOTIFY Statement (The PostgreSQL Global Development Group, 2016 b) against a dedicated so-called channel, and use an arbitrary String value as payload, e.g. the ID of a modified entry. On the Java side, a listener component can be used to LISTEN (The PostgreSQL Global Development Group, 2016 a) for any NOTIFY Statement targeting the dedicated channel (The PostgreSQL Global Development Group, n.d.). For this purpose, the listening component registers to the channel once with the help of a LISTEN Statement. With respect to the IVIS infrastructure, the Java class src/main/java/mediator_wrapper/mediation/impl/ dataSourceMonitor/DatabaseListener.java acts as a listener for the channel ivisnotification. It runs in a separate Thread to constantly contact the PostgreSQL database for new NOTIFY statements generated by a database trigger, which is triggered for each ROW modification to send the ID of the modified entry as message payload.
P a g e 80 | 143
Specification and Proof-of-Concept Implementation
In conclusion, on a data-source-change-event, the monitoring components are able to collect the IDs of all modified instances. How this information gets processed is continued in the subsequent sections. With respect to future developments and improvements of the IVIS infrastructure, the PostgreSQL specific Notify/Listen mechanism should be replaced by more generic mechanism to support a variety of heterogeneous databases. 4.6.4.2 Request/Response Messages When a data source content modification is registered by the IVIS infrastructure, all currently connected clients have to be notified about this event, in case they visualize the affected data instances. For this reason, the IVIS infrastructure creates a data-sourcechange-message as shown in Listing 11. It consists of two properties, a dataSourceIdentifier, that stores a reference to the data source, and an array of recordIds, that unambiguously identify the modified instances within the associated data source (for instance using a data-source-global ID property). The associated Java class can be found at src/main/java/mediator_wrapper/mediation/impl/ dataSourceMonitor/DataSourceChangeMessage.java. {
"dataSourceIdentifier" : "", "recordIds" : [ "", "", ]
} Listing 11 JSON representation of data-source-change-message
When clients are notified of a content modification, they may respond with a synchronization request in order to update their local visualization by fetching modified instances from the IVIS infrastructure. An associated JSON synchronization-message is structured according to Listing 12. The equivalent Java representation is located at src/main/java/controller/synchronize/SynchronizationMessage.java. As only clients know, which data they visualize, they include this information via the property query. As a result, clients only request the data they currently visualize. As in prior requests, the applicationTemplateIdentifier stores a reference to the application template that transforms abstract data to visualization objects. The crucial properties of a synchronization-message are dataSourceIdentifier and recordIds, which are extracted from the received data-source-change-message. With the help of these information, the server-side IVIS infrastructure is able to determine, which modified data instances have to be returned to the user. Consequently, the synchronization response comprises an additional parameter responseVisualizationObjects, storing the modified instances as an array. It should be mentioned that even if the client does not visualize any of the modified instances, a synchronization request is still send, as the information is analysed on the server side. For future developments, an improvement could be to check the necessity to fetch modified instances on the client site directly. Then only those clients would send a synchronization request that actually need to retrieve modified content in order to update their local visualization.
P a g e 81 | 143
Specification and Proof-of-Concept Implementation
{
"applicationTemplateIdentifier" : "", "query" : { "selector" : "", "filters" : [ { "selector" : "", "filterValue" : "", "filterType" : "" } ], "filterStrategy" : "" }, "responseInfoMessage" : "", "dataSourceIdentifier" : "", "recordIds" : [ "", "", ], "responseVisualizationObjects" : [ { "id" : "", "visualizationObject" : } ]
} Listing 12 JSON representation of synchronization-message
4.6.4.3 Controller Interface The synchronization request handler is implemented as Spring controller by the Java class src/main/java/controller/synchronize/SynchronizationController.java, as shown in Listing 13. In particular, the method synchronize() receives requests against the endpoint /synchronize. As each client sends an individual synchronization request, the response is consequently returned to each individual client with the help of the STOMP broker endpoint /queue/synchronize, to which clients must have subscribed. @MessageMapping("/synchronize") @SendToUser(destinations = "/queue/synchronize", broadcast = false) public SynchronizationMessage synchronize (SynchronizationMessage synchronizationMessage) { // code omitted } Listing 13 Synchronization request handler interface (java class src/main/java/ controller/synchronize/SynchronizationController.java)
P a g e 82 | 143
Specification and Proof-of-Concept Implementation
4.6.4.4 Workflow and Processing In opposite to all previously presented functional features, this feature is not triggered by an active client, but by a modification of the data sources. As presented in section 4.6.4.1, the IVIS infrastructure comprises dedicated monitoring components that watch each data source for changes. As soon as the content of a certain data source is modified, the associated monitoring component receives the modification event and extracts the unique identifier of each modified instance to build a data-source-change-message. This message is then broadcast to all currently connected clients. With regard to the implementation, in the previous functional features, response messages to a specific client request were realized by annotating a dedicated Spring controller method with the @SendToUser annotation, which induced the Spring framework to send the method return statement as response message to the requesting user (compare sections 4.6.1 to 0). Here, a different message distribution mechanism is required. Instead of responding to a single client request, the IVIS infrastructure itself must initiate communication by sending a notification to all connected clients. Accordingly, the Spring framework offers the component SimpMessagingTemplate that can be injected as Java property to any Java application component (Johnson & et al., 2016 b). It provides the method convertAndSend(D destination, Object payload), which may be utilized to send an arbitrary payload to a certain destination (Fisher, et al., 2016). In consequence, each data source monitoring component of the IVIS infrastructure is injected with an instance of SimpMessagingTemplate to send the data-source-change-message by calling convertAndSend("/topic/dataSourceChange", dataSourceChangeMessage). Inspecting this call, the destination /topic/dataSourceChange targets an endpoint of Springs internal STOMP broker, that automatically distributes the payload to all subscribed clients. Hence, in order to receive the message, clients have to subscribe to this STOMP endpoint. Each client receives the data-source-change-message and, in consequence, has to set up and send an individual synchronization-message, requesting only the data instances that are currently visualized. Each individual synchronization request is processed by the SynchronizationController, which first retrieves the relevant modified instances for the requesting client and then transforms them into visualization objects according to the requested application template. In more detail, the controller calls the method onSynchronizationEvent() of the IvisMediator, which extracts the (global) query, dataSourceIdentifier and recordIds parameters from the synchronization-message. It determines the corresponding IvisWrapper using the dataSourceIdentifier and calls its method onDataSourceChanged(). The IvisWrapper transforms the global query into its local equivalent and then reduces it to only retrieve relevant modified objects for the requesting client by comparing the recordIds (which represent all modified objects) to the query filters. Each retrieved modified IvisObject that passes client filters is collected in a list, which is returned to the IvisMediator that forwards it to the SynchronizationController. The latter identifies the requested ApplicationTemplate from the synchronization-message parameter applicationTemplateIdentifier and calls its visualizeData_runtime() method that transforms all relevant modified IvisObject instances to instances of type VisualizationObject. Each VisualizationObject instance is composed of an id and an X3DOM node declaration
P a g e 83 | 143
Specification and Proof-of-Concept Implementation
(as String) that can be integrated into an existing X3DOM scene description. The returned visualization objects are used to set the parameter responseVisualizationObjects of the synchronization-message, which is finally returned to the client, who replaces the outdated visualization objects with their modified representation using the object’s id.
Figure 20 Workflow of synchronization event processing (a larger version of the sequence diagram is included as appendix B))
4.7
Summary
In summary, this section gave an overview of key aspects of the prototypical implementation of the proposed 3D synchronization-enabled Web-based IVIS infrastructure. In particular, the utilized base technologies and their initial configuration as well as static and dynamic aspects of the overall system design were highlighted. Special attention was paid to the processing workflow of each crucial functional feature from the perspective of the server-side IVIS infrastructure. In addition to the already highlighted technologies from section 2.2, the IVIS infrastructure is based on the Spring framework, which offers a ready-to-use Model-View-Controller infrastructure as well as WebSocket support using SockJS as HTTP-fallback and the STOMP protocol for message exchange. By using several mapping files, a generic mediator-wrapper concept was applied to support arbitrary domain data stored in heterogeneous data sources.
P a g e 84 | 143
Specification and Proof-of-Concept Implementation
Through a generic visualization template mechanism, the implemented visualization pipeline remains universal, as different concrete templates may produce different visual outputs. The key features of the proposed IVIS infrastructure, namely persisting data instance modifications and synchronizing client-side information visualization were implemented according to the abstract concept from section 3.3. In particular, concerning synchronization, the prototypical implementation contains additional source-filemonitoring components that watch the data sources for changes and broadcast a notification to all clients on an occurring change event.
P a g e 85 | 143
Evaluation
5.
Evaluation
To evaluate the prototypical implementation, this section presents an exemplar client application that facilitates the implemented IVIS infrastructure to visualize book stocks within a rudimentary stock information system. In addition, a short comparison between the prototype and the VRML-based work of Leissler et al (1999) is carried out, highlighting the benefits of the state-of-the-art implementation.
5.1
Prototypical Evaluation Scenario – Bookstore Application
As exemplar use case, a simple bookstore application is presented in order to show how clients can use the developed IVIS infrastructure. At the same time, the prototypical implementation is evaluated using the Cognitive Walkthrough technique, where users are guided through the core functionalities of the application step by step (Allendoerfer, et al., 2005). This section is organised as follows: Section 5.1.1. provides a description of the functional and visual requirements of the bookstore application. The data model, including information on how the application data is stored and configured using three heterogeneous data sources, is presented in section 5.1.2. Other necessary client-side configuration on how to connect to and interact with the server-side IVIS infrastructure is explained in section 5.1.3. Eventually, section 5.1.4 demonstrates the core functional features covering the dynamic aspects of the exemplar client application. 5.1.1 Functional and Visual Description of the Bookstore Application The practical use of the implemented IVIS infrastructure is confirmed by realizing the exemplar bookstore application, as presented in section 1.1.4. Clients should be able to visualize the remaining quantity of available books from multiple different data sources as interactive X3DOM scene in their Web browsers. A book’s stock value is hereby visualized as a coloured and extruded bar. In addition, a thin inventory marker plate represents the reorder value, which is the minimum stock value, before books should be reordered. The extrusion (or length) of the bar indicates the stock value, while the colour of the bar represents one of three distinct states:
green, when current stock is greater than reorder value
blue, when current stock is below reorder value, but is reordered
red, when current stock is below reorder value and not yet reordered
As main runtime feature, each client has the opportunity to modify the stock value by clicking on a visualized book and setting the stock value through an appropriate dialog without accessing the actual data sources directly. Vice versa, if any data instance in the data sources is modified, then each connected client has to be notified about this change and, if necessary, retrieve the modified instance to update the local visualization.
P a g e 86 | 143
Evaluation
5.1.2 Data Model and Mapping Definitions The relevant application data is stored in three distinct data sources, including an XMLand a CSV file as well as a relational database. Within this section, relevant aspects regarding the data model, comprising global and local schema definitions as well as configuration of the server-side mapping files are presented subsequently. 5.1.2.1 Global Schema Listing 14 illustrates the global XML-based schema of a bookstore containing multiple books with characteristic properties. In particular, a node may contain multiple nodes, each representing a specific book through self-explanatory properties and sub-nodes. With regard to visualizing the book stock as a coloured and extruded bar, the numeric properties stock, reorderLevel and the Boolean property reordered are of special interest. When clients want to retrieve or modify certain book instances, they have to deliver an XPath selector referring to this global schema definition, e.g. using bookstore/book. Listing 14 Global Schema of bookstore
5.1.2.2 Local Schemas of all Data Sources Three heterogeneous data sources (CSV-, XML file and relational database) are utilized in the exemplar bookstore application, each storing different book instances. As a result, each data source uses individual syntax and semantics to store the information, which leads to three distinct local schemas. The XML file stores book instances according to the local schema shown in Listing 15. Noteworthy, although the local schema is defined in XML and, thus data instances are accessible in the same syntactical manner as the global schema (e.g. by XPath expressions), it still differs from the global schema due to a different semantical definition of book elements. Comparing both schemas, several differences can be identified. Some elements use a different designator (e.g. vs. or reordered vs. isReordered), and other elements are defined as properties in one case and as sub-nodes in the other (e.g. compare nodes of the global schema vs. of the local schema).
P a g e 87 | 143
Evaluation
Die Elfen Bernhard Hennen Fantasy 5 Euro 10.00 Listing 15 Exemplar data instance illustrating local schema of XML file
Considering the CSV file, both syntax and semantics differ compared to the XML-based global schema, as a CSV file organises its entries as ROWs, where each property is separated by comma. Listing 16 presents the corresponding headers as well as an exemplar entry (note that the line break is because of the limited space in this document, so headers and exemplar entry are defined as a single line within the CSV file). Again some designators vary from the definition in the global schema. To access the entries of the CSV file, each whole line has to be parsed as a String, from which each property can be accessed by splitting the String with the separating character (here the comma). === CSV HEADERS === ID,Title,Author,Language,Category,NumberInStock,Price,Currency,Reorder Level,IsReordered === Exemplar CSV ROW === 1,Das Almased-Kochbuch,Andrea StensitzkyThielemans,DE,cookbook,13,12.99,Euro,10,false Listing 16 Exemplar data instance illustrating local schema of CSV file
Eventually, a relational PostgreSQL database (deployed locally on the developing computer, and thus not publicly available) organises relevant book instances in a database named bookstore within the relation/table named book using individual designators, as presented in Listing 17. Access to the stored instances is provided by submitting an appropriate SQL (Structured Query Language) statement.
P a g e 88 | 143
Evaluation
=== DATABASE NAME === bookstore === RELATION/TABLE NAME === Book === PROPERTY/COLUMN NAMES === id;title;author;language;category;amount_in_stock;price;currency;reord er_value;is_reordered === EXEMPLAR ENTRY === 1;"The Blade Itself";"Joe Abercrombie";"EN";"Fantasy";5;9.99;"Euro";5; FALSE Listing 17 Exemplar data instance illustrating local schema of relational database (PostgreSQL)
5.1.2.3 Mapping Definitions within the IVIS Infrastructure As described in the previous section, relevant bookstore data is distributed over three data sources, an XML- and a CSV file as well as a relational database. As their schema definitions are syntactically and semantically different from the global schema, a mapping between global schema and each of the local schemas has to be specified. As mentioned in section 4.5 the project folder data/config of the implemented IVIS infrastructure comprises dedicated mapping files to configure the mediation between heterogeneous data sources. In
total,
five
mapping
files
have
to
be
configured.
First,
the
GlobalSchemaToWrapperMapping.xml file that maps each selectable element of the global schema to a list of IvisWrapper implementations. For instance, Listing 18 illustrates, how the global XPath selector bookstore/book is mapped to three IvisWrapper instances, each handling access to the corresponding data source. The
complete file is attached in appendix C). With the help of this mapping, the IVIS infrastructure is configured to access all three data sources for book data.
P a g e 89 | 143
Evaluation
bookstore/book XmlWrapper CsvWrapper DatabaseWrapper Listing 18 Exemplar mapping entry of the GlobalSchemaToWrapperMapping.xml file
The next mapping file, SubqueryMapping.xml, is used to identify atomic properties of an aggregated object. With respect to the bookstore application, clients visualize the aggregated object book. In consequence, the subquery mapping is defined as shown in Listing 19. The global XPath selector bookstore/book is mapped to a list of nodes, each providing the global XPath selector to a characteristic atomic property of a book instance. With the help of this mapping definition, the IVIS infrastructure is configured to retrieve composed book instances comprising all atomic book properties.
P a g e 90 | 143
Evaluation
bookstore/book bookstore/book/@id bookstore/book/@stock bookstore/book/@reorderLevel bookstore/book/@reordered bookstore/book/@language bookstore/book/title bookstore/book/author bookstore/book/category bookstore/book/price bookstore/book/price/@currency Listing 19 Exemplar SubqueryMapping.xml file
Finally, for each implementation of IvisWrapper, an additional configuration file is necessary to map global XPath selectors to local data source specific selectors. Within the scope of the bookstore application, three concrete wrappers (CsvWrapper, XmlWrapper and DatabaseWrapper) must be configured to access book information stored in the respective data source. The appendices D) to F) include the whole mapping definition for each of the wrappers. In case of the XmlWrapper, the local selectors store an XPath expression according to the local schema of the source file. With regard to
P a g e 91 | 143
Evaluation
CsvWrapper,
a local selector represents the HEADER name of the associated property. Concerning the DatabaseWrapper, each local selector stores a reference to the relation/table name as well as the column name, separated by a colon. For instance, Book:amount_in_stock refers to the relation Book and the column amount_in_stock. With the help of this mapping, each individual wrapper knows how to interpret the local selector and thus knows which elements should be accessed. 5.1.2.4 Mapping the Abstract Book Data to an X3DOM Visualization Object Within the scope of the bookstore application, key properties of the book instances have to be transformed into an adequate X3DOM representation. Concerning the implemented IVIS infrastructure, this transformation is performed by the src/main/java/ application_template/impl/bookstoreApplication/BookstoreApplicationTem plate.java class. According to the visual specification from section 5.1.1, a book’s
stock value should be represented by a coloured extruded bar with an additional marker plate as visual representation of the reorder value property. To realize this, X3D/X3DOM offer several visual primitives and other base nodes (Brutzman & Daly, 2007). In short, each visual object is represented as a node, consisting of an as well as a geometry node. Via surrounding nodes, the location, orientation and scale of a shape can be defined. The shape’s RGB-colour can be set via the attribute diffuseColour of the node, which is a child node of . Overall, the representation of a book instance consists of a total number of three shapes, one for the coloured extruded bar, one for the marker plate and an additional text label to display the book title. The bar’s geometry is realized as a node, where the size attribute resembles the stock value (to be precise, the y-component of the size attribute, as the bar grows in y-direction for increasing stock values). In a similar manner, the marker plate’s geometry is also implemented as a small node, having a small extent in y-direction, where the correct positioning of the plate along the bar reflects the reorder value. The text label is realized as a node, which automatically orients the contained node to always face the user, independent from the viewpoint. An exemplar X3DOM representation of a book instance is illustrated in appendix G). Inspecting this exemplar X3DOM object, two more details have to be mentioned. For one, additional metadata about the book instance are included using the nodes and , each storing the name and value of a certain book property. Clients may refer to these metadata tags and extract the information, as demonstrated in section 5.1.4.3. Second, the all-surrounding node contains a unique identifier per book within the attribute id. With the help of this id, each X3DOM object can be addressed as a DOM element, offering all DOM modification functionalities like accessing/manipulating attributes or child nodes. For instance, sections 5.1.4.2 and 5.1.4.4 demonstrate, how scene objects are replaced with a newer version of the same book instance by searching the DOM for an element with the same id.
P a g e 92 | 143
Evaluation
5.1.3 Client-Side Configuration The
exemplar
client
bookstore application is located at project folder src/main/resources/static, comprising the index.html page, the app.css CSS file, the used libraries in folder lib and a JavaScript file js/application.js containing application logic. Of special interest is how the client connects to the IVIS infrastructure and how it must be configured to send messages to the dedicated endpoints as well as receive messages. As denoted in section 4.4.2, the IVIS infrastructure utilizes SockJS as an HTTP fallback mechanism and the STOMP-protocol for message exchange. In consequence, the client side uses JavaScript equivalents of both base technologies to establish the connection, as presented in Listing 20. var stompClient = undefined; // is called as soon as the document is loaded function connect() { // declare socket via SockJS to ensure HTTP fallback var socket = new SockJS('/initial/visualize'); // declare stompClient var holding connection to STOMP broker stompClient = Stomp.over(socket); // establish connection stompClient.connect({}, function(frame) { // subscriptions to STOMP endpoints // initial scene stompClient.subscribe('/user/queue/initial/visualize', function(object) { // parse received JSON message var serverSideVisualizationMessage = JSON.parse(object.body); // get relevant content from message var x3domSceneString = serverSideVisualizationMessage.responseScene; // process content integrateSceneIntoDOM(x3domSceneString); }); // data source change event stompClient.subscribe('/topic/dataSourceChange', function(object) { // code omitted, see appendix H) }); // the remaining subscriptions are omitted! See appendix H) }); } Listing 20 Connecting to the IVIS infrastructure
First a variable named stompClient is defined to hold the connection. The subsequent function connect() is called, when the whole document is loaded (e.g. by using jQuery’s
P a g e 93 | 143
Evaluation
method $(document).ready()). The method uses the SockJS library to declare a socket with target URL /initial/visualize, enabling WebSocket connection to the IVIS infrastructure with HTTP fallback. With the help of this socket and the STOMP library, the variable stompClient is initialized. Then the connection to Spring’s STOMP broker is established by calling the stompClient.connect() method, which takes a function as second parameter, in which subscription to server-side STOMP endpoints are defined. For instance, the client subscribes to the STOMP endpoint /user/queue/ initial/visualize, from which a server-side-information-visualization-message, as presented in section 4.6.1.1 can be received. The associated subscribe() method takes a callback function as second argument, in which the received message must be parsed and processed. Of particular interest is the prefix /user/queue, which configures the STOMP broker to interpret the subscription as per single user by assigning a unique identifier to each user. By doing so, a message from the IVIS infrastructure via the STOMP broker will only be delivered to the requesting user, which is referred to by its unique identifier. In opposite, Listing 20 also contains the subscription to the endpoint /topic/dataSourceChange, where the prefix /topic indicates that all clients receive a message send to that endpoint, independent from a certain user identifier. Note that the listing only shows how to subscribe for two exemplar STOMP endpoints. To use all features of the IVIS infrastructure, the client has to subscribe to all other STOMP endpoints as well, as shown in the full connect() method attached in appendix H). Another crucial aspect is how clients send messages to the dedicated endpoint offered by the IVIS infrastructure. Basically, once the connection is established, the variable stompClient offers the method send(), which takes a mandatory STOMP-destination, an optional JavaScript object containing additional headers, and the optional message payload as arguments (Mesnil, 2012). As mentioned in section 4.4.2, the IVIS infrastructure is configured to receive client-sent messages prefixed with /ivisApp. As a result, Listing 21 presents an overview of relevant send() method calls to destinations offered by the IVIS infrastructure. For each dedicated endpoint/feature, a JavaScript object, representing the associated message body is build and used as payload for the respective request. Note that each destination is indicated by a relative link, because the exemplar client application is deployed on the same server within the same project.
P a g e 94 | 143
Evaluation
=== Server Side IVIS – Initial Visualization === // creation of message omitted var serverSideVisualizationMessage = { … }; stompClient.send('ivisApp/initial/visualize', {}, JSON .stringify(serverSideVisualizationMessage)); === Runtime – Visualize Additional Data === // creation of message omitted var runtimeAdditionalDataMessage = { … }; stompClient.send('ivisApp/runtime/visualizeAdditionalData', {}, JSON .stringify(runtimeAdditionalDataMessage)); === Runtime – Modify Data Instances === // creation of message omitted var runtimeModificationMessage = { … }; stompClient.send('ivisApp/runtime/modify', {}, JSON .stringify(runtimeModificationMessage)); === Synchronize Request === // creation of message omitted var synchronizationMessage = { … }; stompClient.send('ivisApp/synchronize', {}, JSON .stringify(synchronizationMessage)); Listing 21 Sending messages to the IVIS infrastructure
5.1.4 Cognitive Walkthrough of Core Features After having introduced how the IVIS infrastructure is configured to the data model of the exemplar bookstore application, this section guides through the core features of the application scenario highlighting, how the client side visual interface interacts with the IVIS infrastructure. For this purpose, user interactions are explained referring to consecutive figures attached in the appendix. 5.1.4.1 Fetch Initial Visualization With the help of the bookstore application, book stocks can be visualized using a Web browser. As exemplar data, necessary information about 33 books is stored in three heterogeneous data sources (CSV and XML files as well as a relational database). On page load, the visual interface is split in two distinct sections, an explanation and configuration area on the left and a (yet empty) area for X3DOM visualizations, as shown in appendix I). Consequently, the basic page layout is organised as outlined in Listing 22. Moreover, the HTML page contains a Bootstrap Modal (Bootstrap, 2016 b), providing additional details about a clicked visualized book, as explained in section 5.1.4.3.
P a g e 95 | 143
Evaluation
Listing 22 Basic bookstore HTML page layout
During page load, the application connects to the IVIS infrastructure via the connect() method introduced in the section 5.1.3. In the beginning, only the retrieval of an initial X3DOM visualization is enabled. All other options (e.g. loading additional data or perform/receive updates of data instances) are disabled. To retrieve all available book stocks as interactive X3DOM visualization, users may press the “Visualize Book Stocks” button, located in the centre of the left-hand configuration area. The button triggers the client to build and send a server-side-information-visualization-message against the STOMP destination /ivisApp/initial/visualize. As a result, the client receives a complete X3DOM scene String from the IVIS infrastructure, which is integrated into the DOM as child elements of the
element of the HTML page. Using the X3DOM method x3dom.reload(), the library inspects the new DOM elements and renders the visualization according to appendix K). Each book stock is displayed as a coloured extruded bar, as specified according to section 5.1.1. The visualized items are sorted bottom-up, showing the books with few remaining quantities at the bottom. As an alternative to visualizing all book stocks, users may previously enable and define certain filters via the corresponding form elements and then hit the button. For this reason, two exemplar filter options are offered by the visual interface, each referring to a dedicated book property. For one, books can be filtered by author. As second filter option, users may specify a price value and select a comparison operator. In addition, the “Filter Strategy” selection defines how to join both filters (options are logical AND / OR).
P a g e 96 | 143
Evaluation
Requesting a filtered visualization, the defined filters are included in the server-sideinformation-visualization-message sent to the IVIS infrastructure. Appendix J) demonstrates a paradigmatic filter definition and resulting visualization, where the retrieved books have the properties author='Bernhard Hennen' and price>='9.99'. After integration of the retrieved X3DOM scene, the scene view automatically zooms to fit all scene elements. Now users may freely explore the interactive scene. More importantly, the remaining functionalities are enabled, comprising scene removal, requesting additional data, view book metadata, modify stock values and receive synchronization updates for visualized items. These core interactions with the IVIS infrastructure are addressed in the subsequent sections. 5.1.4.2 Request Additional Data As soon as an initial scene is displayed, users may retrieve additional data that will be integrated into the existing scene by pressing the “Visualize additional Book Stocks” button. The same filter options as introduced in the previous section can be applied. This causes the client to generate and send a runtime-request-data-message to the STOMP endpoint /ivisApp/runtime/visualizeAdditionalData of the IVIS infrastructure. The response message contains an array of visualization objects consisting of an identifier and the X3DOM representation. For each returned item, the client checks whether the item is already contained in the existing scene by searching for an equal identifier. If the scene contains a previous version of the requested item, it is replaced with the new one. If the requested item is indeed a new visualization object, it is appended to the DOM and integrated into the scene below the existing ones. As an example, basing on the filtered visualization of appendix J), users might request additional book stocks with property author='J.R.R. Tolkien'. Appendix L) shows the resulting filter definition and visualization, where four new book stocks are integrated at the bottom of the scene. 5.1.4.3 Modify Data Instances One of the two crucial functional features of the IVIS infrastructure includes users being able to modify data properties of visualized instances not only within their local visualization, but persist this change at data source tier. In consequence, clients can click on a visualized book stock (either on the bar or the label) to open a Bootstrap Modal offering book metadata, as presented in appendix M). The metadata is extracted from the associated nodes of the X3DOM representation, as introduced in section 5.1.2.4, and converted into an HTML table. Of particular interest is the possibility to modify the stock value at the bottom of the modal. In the associated input field, users may enter the new stock value as integer and hit the “Change Stock Value” button, which causes the client to generate and send a runtime-modification-message against the STOMP endpoint /ivisApp/runtime/modify of the IVIS infrastructure. On the server side, the modification of the selected data instance is persisted in the corresponding data source and a notification about success or fail is returned to the client. As a simple notification mechanism, the bookstore application uses a popup to show the notification text, as demonstrated in appendix N). Noteworthy, the visualization still shows the
P a g e 97 | 143
Evaluation
unmodified visual representation of the book instance, as the actual retrieval of the modified instance is executed as a result of a synchronization event, as presented successively. 5.1.4.4 Synchronization Event Synchronizing all connected clients due to a modified data instance is the second vital functionality. In response to a data source change event, either triggered by a user-driven modification or any other external process, the IVIS infrastructure sends a data-sourcechange-message containing the identifiers of all modified instances to the STOMP endpoint /dataSourceChanged, from where it is broadcast to all subscribers, as explained in section 4.6.4. In particular, all clients of the bookstore application have subscribed to this endpoint (compare section 5.1.3) and receive this message. Each client then prepares an individual synchronization-message to request only the modified instances of the currently visualized books by sending the message to the destination /ivisApp/synchronize of the IVIS infrastructure. The response message comprises an individual array of modified X3DOM visualization objects per client, that should replace the outdated elements. In consequence, for each modified book instance, the associated outdated DOM element is identified via the equal id property and replaced by the new X3DOM element. As a simple notification, users are faced with a popup, reporting which element has been replaced, as shown in appendix O). Once the popup is closed, the visualization is updated accordingly. For instance, modifying the stock value of the book instance with title='The Fellowship of the Ring' from three to 13, causes the visualization from appendix L) to be updated to a visualization according to appendix P), where the length and colour of the bar changed in accordance to the updated stock value. In summary, each of the characteristic functional features of the proposed synchronization-enabled IVIS infrastructure has been verified by this exemplar bookstore application. In particular, the execution of modifying data instances through the visual interface as well as notifying and synchronizing connected clients in case of modified data instances represent the key functionalities. As already denoted in section 4.6.4.2, an improvement for future development would be to check the necessity to send a synchronization request on the client side. Currently, each client sends a request, regardless whether the client visualized affected data instances or not.
5.2
Comparison to Implementation of Leissler et al.
Compared to the implementation of Leissler et al. (1999) from section 2.3, several conceptual enhancements towards a state-of-the-art generic IVIS infrastructure can be identified:
Basing on the mediator-wrapper pattern, the IVIS infrastructure may support an arbitrary number of heterogeneous data sources. To provide access to a new data source, an associated IvisWrapper implementation has to be added to the codebase.
P a g e 98 | 143
Evaluation
5.3
Due to the use of several mapping files, the IVIS infrastructure is designed in a generic fashion for support of arbitrary application data stored in arbitrary data sources.
Giving the client the option to choose between several application templates, the client-side visualization can easily be switched. To provide an alternative visual output, a new implementation of ApplicationTemplate can be added to the codebase.
Using X3DOM as state-of-the-art Scene Description Language proves a powerful way to realize an interactive three-dimensional user interface. In contrast to standalone VRML/X3D, it includes the advantages of native Web browser support without any client-side plugins as well as native DOM integration of scene contents. More importantly, the latter enables typical DOM access and modification of X3DOM elements using JavaScript or higher level APIs like jQuery. Still, future research will have to investigate how X3DOM can be used to visualize Big Data with the help of suitable visual metaphors and aggregation mechanisms.
Relying on the emerging WebSocket and STOMP protocols for overall communication between clients and the IVIS infrastructure enables full-duplex bidirectional message exchange. In particular, the Spring framework offers a ready-to-use WebSocket infrastructure, including fallback options via SockJS and an internal STOMP broker to manage dedicated endpoints for client subscription and automatic deliverance of messages to the subscribers. This reduces the need to manually manage client connections as well as client identification, as this is done by Spring components.
Summary
In conclusion, the prototypical implementation of the proposed IVIS infrastructure covers all targeted aims formulated in section 1.4. The resulting IVIS infrastructure enables client applications to retrieve arbitrary application data from heterogeneous data sources using predefined application templates to generate corresponding visual output (e.g. interactive X3DOM scenes). The exemplar bookstore application did not explicitly address processing and display of Big Data within an X3DOM scene. Appropriate visual metaphors and further investigation on how to integrate Big Data into interactive X3DOM scenes is left for future research.
P a g e 99 | 143
Conclusion
6.
Conclusion
In the context of Information Retrieval and Information Visualization, abstract data from various data sources is transformed into cognitive-efficient visualizations to aid users in perceiving and analysing the presented data and their relationships. As a prominent visualization pipeline, which conceptualizes the necessary transformational steps from raw or structured data over visualization objects to concrete views, the IVIS Reference Model has been introduced. Conceived by Card et al (1999), it focused static input data from a single data source. Facing rising user demands for more user empowerment as well as growing challenges in the field of Big Data, the reference model evinces several weaknesses. To be precise, keywords like the Participative Web (OECD, 2007) or Web 2.0 embody users’ claims for more interaction with application data as well as user generated content. Although the IVIS Reference Model offers configurable transformation steps from data to view, reversely directed transformations from view to data, intending to modify or create application data, are neglected. Moreover, concerning Big Data scenarios, relevant domain data might be distributed to multiple heterogeneous data sources, each having a syntactically and/or semantically different access interface. In consequence, one goal of this thesis was to conceive a bidirectional extension of the visualization pipeline in order to allow users to interact with dynamic application data within concrete views and modify the server-side stored domain data through directmanipulative means within the client-side visual interface. More importantly, the concept of dynamic data and heterogeneous data sources had to be considered and reflected within a refined visualization pipeline. Due to these considerations, the overall objective of the thesis was to establish an IVIS infrastructure capable of synchronizing heterogeneous data source and interactive 3D information visualization. This infrastructure is characterized by three main functional features:
Server Side Information Visualization to initially transform abstract data into an interactive 3D information visualization
Runtime Information Visualization, which comprises user-driven runtime features within an existing visualization like requesting additional data and modify data instances through the visual interface
Synchronization to ensure that server-side data sources and derived client-side visualizations represent the same informational state.
For this reason, additional motivation aspects were introduced for justification and to reveal associated research questions and more concrete objectives. First, a Web interface was constituted due to a broad user mass, independence from fixed runtime environments as well as enablement of collaboration for spatially distributed users from all over the world. Also, a 3D user interface was targeted because a third dimension opposes additional opportunities to map abstract data attributes to visual properties such as position or the spatial extent. Furthermore, an interactive 3D environment might boost user experience and interaction compared to classical 2D visualizations. With regard to the process of gaining insight, the benefit of a synchronization-enabled IVIS infrastructure was highlighted. Having achieved a certain insight after extensive
P a g e 100 | 143
Conclusion
analysation of a certain dataset, it would be recommendable to persist this new knowledge within the data source and, thus make it accessible for other researchers, analysing the same dataset. Instead of redoing the same analytic steps, they could profit from the persisted results of other researchers and, in consequence, increase productivity. As exemplar research projects, where the proposed IVIS infrastructure could be employed as a visual front-end for data access and analysis, the EU Horizon 2020 funded projects EarthServer (Baumann, 2016) and SenseCare (SenseCare, 2016 a) were referenced. While the former needs a visual interface to analyse Big Earth Data, the latter provides observed Big Medical Data of patients to better understand and monitor their illness. To both projects, the proposed IVIS infrastructure could provide a visual access to the data and, in addition, offer functionalities to persist achieved insight from analytic tasks and share this knowledge with others. From a technological point of view, a reference implementation from Leissler et al. (1999) was introduced, that already implemented a similar IVIS infrastructure. However, the implementation was database-driven und relied on technologies that have evolved or been replaced by new technological developments over the last 17 years. Hence, another important aspect of this thesis was to identify stateof-the-art technologies and concepts to realize a modernized generic implementation that supports arbitrary domain data from arbitrary heterogeneous data sources. In consequence, the following main research questions/topics were identified:
Which state-of-the-art technologies and concepts suit best?
How can the system architecture be designed in a generic fashion to allow arbitrary domain data stored in arbitrary data sources?
How can the transformation process from abstract data to generated information visualization be kept generic and configurable to allow different visual outputs?
How can the client-side visual interface be realized to allow intuitive interaction with and proper display of domain data?
How can the visualization pipeline be extended to manifest the concepts of dynamic data and user-driven modification and synchronization functionalities?
How can Big Data be supported on both sides of the visualization pipeline?
A solution to all of these challenges could not be given within a single Master thesis. Hence, as a first step, this thesis aimed to conceive and implement a state-of-the-art generic synchronization-enabled 3D IVIS infrastructure, capable of transforming discretionary abstract domain data from heterogeneous data sources into interactive 3D visualizations that can be embedded in a client-side Web browser. In addition, user-driven modification of data instances and synchronization aspects should be implemented and evaluated by an exemplar application scenario. Subsequently the thesis continued with a state-of-the-art and related work analysis. Beneath the IVIS Reference Model, the mediator-wrapper architectural pattern has been identified as a generic mechanism to semantically integrate heterogeneous data sources. Realizing the virtual integration, the pattern consists of a central mediator and several
P a g e 101 | 143
Conclusion
wrapper components, one for each available data source. The mediator comprises a global data schema, which defines the global representation of the domain data. In accordance, each wrapper comprises a local data schema, resembling how the concrete data is stored within each data source. By delegating incoming queries against the global data schema to the appropriate wrappers, the process of data retrieval from heterogeneous data sources is kept generic. As main state-of-the-art technologies, X3DOM and the WebSocket protocol were acknowledged. The former is a JavaScript library that allows native Web browser integration of X3D scene content by embedding X3D nodes into the browser’s DOM and rendering the scene plugin-less with the help of WebGL. X3D is a standardized and ISO-certified 3D format to create interactive 3D visualizations. Thus, X3DOM became the technology of choice to implement the client-side visual interface. The WebSocket protocol is an emerging protocol for full-duplex bidirectional communication in a client-server environment. Upgrading from HTTP, a socket connection is maintained between the parties enabling each side to send arbitrary messages at any point of time. Compared to HTTP, this reduces the need for client-side polling strategies to query the server side for updates and also reduces message overhead. The use of the identified technologies was validated by a related work analysis. In particular, 3D visual interfaces, often basing on X3D/X3DOM, become more popular in the fields of medicine, cultural heritage, construction or geo sciences. With regard to a generic and configurable visualization pipeline, several projects applied a template mechanism in order to switch between visual outputs. This motivated the implementation of the proposed IVIS system to establish a template mechanism for configurable visualization generation as well. Having collected the necessary contemporary technologies and approaches, an abstract concept of a synchronization-enabled IVIS infrastructure was presented. It comprised a detailed description of the vital functional features as well as a conceptual system architecture and an extension of the visualization pipeline towards dynamic data. Basing on the mediator-wrapper pattern and the template mechanism, the abstract IVIS infrastructure is composed of three main components:
a central 3D-IVIS-Mediator component, which employs one wrapper for each accessible data source
a Visualization Generation component to transform abstract data into interactive information visualization, e.g. based on a template mechanism, where different templates produce different visualizations of the same data.
a notification/broadcast component to deliver appropriate messages to clients
With regard to the conceptual bidirectional refinement of the visualization pipeline, the IVIS Reference Model was enriched with a new Data Sources component as well as a new transformation called Data Generation and Selection to indicate dynamic input data for the visualization generation. Moreover, the user is empowered with a functionality to modify data instances within a concrete View. This feature is directed from View to Data Sources to manifest that this modification has to be made persistent at the original data sources.
P a g e 102 | 143
Conclusion
Based on the abstract concept, a prototypical Java implementation of the proposed IVIS infrastructure was realized using the base technologies X3DOM, WebSocket as well as the mediator-wrapper pattern. Although there is a native WebSocket support within the Java Development Kit version 8, the WebSocket support of the open-source Spring framework was favoured. The well-structured Model-View-Controller infrastructure is what spotlights Spring. In addition, Spring provides a dependency injection mechanism to automatically manage dependencies between Java components. More importantly, Spring contains an enhanced WebSocket support, as is ensures HTTP fallback options via SockJS for clients with outdated technologies, such as routers or Web browsers that reject the relatively young WebSocket protocol. In addition, the text-based STOMP protocol was layered on top of WebSocket, realizing a publish-subscribe service, where a message directed at a certain channel is automatically broadcast to all subscribers of that channel. In consequence, the IVIS infrastructure prototype specifies dedicated STOMP-endpoints to receive client-sent requests and send messages to clients, who have to subscribe to the corresponding STOMP-endpoints in order to receive messages. Message distribution is then handled by Spring’s internal STOMP broker. With respect to the abstract architecture of the conceived IVIS infrastructure, each of the abstract system components has been implemented as follows:
3D-IVIS-Mediator: the central mediation component comprises the following sub-components o Spring Controller classes that act as request handlers according to the MVC pattern. For each of the vital functional features (Server Side Information Visualization, Runtime Information Visualization, Synchronization), a dedicated Controller class is implemented, handling requests against a specified STOMP endpoint. o A central IvisMediator component realizing the mediator from the mediator-wrapper pattern o Multiple implementation of the interface IvisWrapper, to handle access to a certain data source. To be precise, the prototype provides access to three data sources, CSV-files, XML-files and a relational database (in particular a PostgreSQL database).
Visualization Generation component: following a generic template mechanism, the implementation provides the interface ApplicationTemplate. Concrete implementations of this interface can provide alternating generated information visualization output.
Notification/Broadcast component: for message delivery, Spring’s internal STOMP broker is employed. Offering dedicated endpoints, any message directed at a certain endpoint is automatically distributed to all subscribers of this endpoint.
Due to basing on Spring, several configurations are necessary, comprising bean declaration for dependency injection, controller definition, registering STOMP endpoints handled by controllers and enabling fallback via SockJS.
P a g e 103 | 143
Conclusion
To be independent from certain data sources as well as to support arbitrarily structured domain data, the semantic integration of heterogeneous data sources has been realized with the help of several mapping files. In particular, the IVIS infrastructure expects data queries to include an XPath selector against of global XML-based schema. Via this global selector, clients may point to the data they intend to visualize. Based on this selector a global-schema-to-wrapper-mapping definition controls, which wrapper (and, thus which data source) stores requested domain data. As this single global selector may point to an aggregated object consisting of multiple atomic properties, the subquery-mapping definition stored all global XPath selectors of all atomic properties of an aggregated object. The IVIS infrastructure may use them to retrieve all atomic properties and compose an aggregated object. As a third vital mapping definition a global-to-localselector-mapping has to be defined for each wrapper in order to map the global XPath selector to a String-based identifier referring to the local data schema of the wrapper. With the help of these three crucial mapping definitions, realizing the mediation and semantic integration of heterogeneous data sources with varying local schemas, the IVIS infrastructure is kept generic. Special focus has been paid to dynamic aspects of each vital functional feature of the synchronization-enabled IVIS infrastructure. In particular, the exchanged message format, the controller interface (including the STOMP-endpoints) and workflow details between the main system components were highlighted. In general, a controller receives a client request, delegates data retrieval or modification of data instances to the mediatorwrapper components, from which relevant data is extracted/modified by accessing the appropriate data sources. If necessary, the controller forwards retrieved data to the requested application template, where the abstract data is transformed into interactive X3DOM nodes. Finally, the STOMP broker is used to deliver the response to the clients. With respect to the synchronization feature, which is triggered on a data-source-changeevent, additional source-file-monitoring components have been developed that monitor each data source for changes and, if required, broadcast a notification to all connected clients via the STOMP broker in order to synchronize their local views. Evaluation of the implemented prototype was performed using the Cognitive Walkthrough technique on an exemplar bookstore application, where clients can visualize and modify book stock data. Each book stock should be visualized as a coloured and extruded bar and an additional marker plate should indicate the reorder value of the book instance. For this reason, a number of book instances has been inserted into the three data sources (CSV, XML and PostgreSQL database) and the presented mapping definitions were adjusted to fit the bookstore data model. For each of the vital functionalities of the synchronization-enabled IVIS infrastructure, a demonstration of the client-side interaction was employed with the aid of helpful figures. Eventually, a comparison to the reference implementation from the year 1999 revealed that the implemented prototype proves a state-of-the-art enhancement, which is able to conquer current challenges regarding user empowerment and support of heterogeneous data sources in Big Data Scenarios.
P a g e 104 | 143
Discussion and Outlook
7.
Discussion and Outlook
Finalizing this thesis, this section is intended to give an overview of future tasks and developments. As main outcome of this thesis, the prototype of a generic synchronizationenabled Web-based 3D IVIS infrastructure has been developed. From a scientific perspective, the concepts of dynamic data and the associated synchronization of heterogeneous data sources and information visualization have been manifested in a bidirectional extension of the IVIS Reference Model. Concerning the formulated research questions from section 1.3, the presented work only covers parts and represents a first step towards a mature and extensively validated IVIS infrastructure that provides a solution for all identified issues. Hence, the following research issues still remain open:
The approach requires more validation of the employed mediation mapping definitions with respect to a generic infrastructure. A first draft has been implemented and evaluated by an exemplar application scenario, but more concrete use cases with discretionary domain data and visualization demands have to be identified and realized to optimize mapping configuration as well as the implementation workflow.
In addition, a formal information/data model should be considered in order to acquire a universal data model, which can be applied to several concrete application domains. Currently, visual structures are represented as X3D/X3DOM elements and abstract data structures are defined through XML mapping files. A future goal should be to formalize the information/data model on the data structure tier. One benefit could be to derive concrete formal mapping rules embodied within a formal mapping language (e.g. using XML syntax). Due to the bidirectional visualization pipeline, this formal mapping language should provide transformations in both directions, from data structures to visualization objects and vice versa. In addition, it could be considered to allow further adaptions/configurations of the IVIS infrastructure through the mapping language (e.g. dynamic integration of additional data sources).
Beneath synchronous processing of modifications users should be allowed to work in an asynchronous manner. Hence, the IVIS infrastructure should be extended by an asynchronous processing for use cases with non-frequent changes of the domain data. As mentioned in section 3.3.3, this raises new challenges with regard to conflicting modifications and the ability to unambiguously resolve multiple modifications in the reverse transformation from visualization objects to source data.
The current implementation of the exemplar user interface was kept simple. To have a real impact on concrete applications, the user interface has to be improved at several levels, empowering the user with more capabilities regarding configuration of and interaction with visualizations.
The implemented exemplar application scenario only focused one modifiable property of a data instance. In consequence, ongoing investigation on the mapping
P a g e 105 | 143
Discussion and Outlook
of more complex abstract data with numerous modifiable properties to adequate visual representations is required. This includes the employment of adequate interaction techniques within the visual interface to allow intuitive modification of each property.
The explicit support for large datasets in the context of Big Data was neglected within the implementation. However, the IVIS infrastructure is designed to provide a homogeneous query interface for heterogeneous data sources and, thus is future-proof for application in Big Data scenarios. What remains open for investigation is how large datasets can be efficiently stored, retrieved as well as displayed. Suitable aggregation techniques and visual metaphors have to be identified to maintain a high user experience and usability working with Big Data.
From an engineering point of view, the developed prototype can be enhanced in future progress. The most relevant aspects are:
The handling of concurrent/competing modifications has not been considered explicitly. Currently, two concurrent user-driven modifications are prevented by inspecting a Boolean property indicating whether another user is already performing a modification. More importantly, the case of a competing user-driven modification and an external modification process (which is not under control of the IVIS infrastructure) has been neglected completely. In theory, competing modifications could cause loss of data or inconsistent states on either side of the visualization pipeline. This has to be prevented and explicitly considered for future developments.
Currently, in response to a data-source-change-event, each client sends a synchronization request, even if no modified instance has to be retrieved. The implementation should be changed in order to check this necessity on client side. Only those clients that visualize affected data instances should send a synchronization request in order to update their local visualization.
The database monitoring component uses a PostgreSQL specific Notify/Listen mechanism to react on data-source-change-events. A more generic concept should be applied instead. For instance, the IVIS infrastructure could offer an additional STOMP endpoint for external components like databases or Web services that may actively send messages against that endpoint to notify the infrastructure about a data source change. This would reduce the need, to keep additional monitoring components running in a separate Thread waiting to process events.
If data has to be retrieved from multiple data sources, the retrieval is currently executed one after the other. To optimize processing time, the retrieval could be executed concurrently using separate Threads.
Improvements of visual interface and Big Data handling according to the remaining research issues from above
P a g e 106 | 143
Discussion and Outlook
In conclusion, the abstract concept as well as the prototypical implementation of the synchronization-enabled IVIS infrastructure requires ongoing research and validation. For this reason, more concrete application scenarios have to be identified and employed to evaluate and improve the infrastructure.
P a g e 107 | 143
Appendix
Appendix A)
X3D Thematic World Sphere Web Application
P a g e 108 | 143
Appendix
B)
Synchronisation Event Processing Workflow
P a g e 109 | 143
Appendix
C)
Exemplary GlobalSchemaToWrapperMapping.xml File for Bookstore Application
bookstore/book XmlWrappe r CsvWrappe r Data baseWrapper bookstore/book/@id XmlWrappe r CsvWrappe r Data baseWrapper bookstore/book/@stock XmlWrappe r CsvWrappe r
P a g e 110 | 143
Appendix
Data baseWrapper bookstore/book/@reorderLevel XmlWrappe r CsvWrappe r Data baseWrapper bookstore/book/@reordered XmlWrappe r CsvWrappe r Data baseWrapper bookstore/book/@language XmlWrappe r CsvWrappe r Data baseWrapper bookstore/book/title
P a g e 111 | 143
Appendix
XmlWrappe r CsvWrappe r Data baseWrapper bookstore/book/author XmlWrappe r CsvWrappe r Data baseWrapper bookstore/book/category XmlWrappe r CsvWrappe r Data baseWrapper bookstore/book/price XmlWrappe r CsvWrappe r
P a g e 112 | 143
Appendix
Data baseWrapper bookstore/book/price/@currency XmlWrappe r CsvWrappe r Data baseWrapper
P a g e 113 | 143
Appendix
D)
Exemplary XmlWrapper Configuration File for Bookstore Application
bookstore/book books/book bookstore/book/@id books/book/@id bookstore/book/@stock books/book/amountInStock bookstore/book/@reorderLevel books/book/@reorderLevel bookstore/book/@reordered books/book/@isReordered bookstore/book/@language books/book/title/@lang
P a g e 114 | 143
Appendix
bookstore/book/title books/book/title bookstore/book/author books/book/author bookstore/book/category books/book/category bookstore/book/price books/book/cost/price bookstore/book/price/@currency books/book/cost/currency bookstore/book/@id books/book/@id bookstore/book books/book
P a g e 115 | 143
Appendix
E)
Exemplary CsvWrapper Configuration File for Bookstore Application
bookstore/book COMPLETE ROW bookstore/book/@id ID bookstore/book/@stock NumberInStock bookstore/book/@reorderLevel ReorderLevel bookstore/book/@reordered IsReordered bookstore/book/@language Language
P a g e 116 | 143
Appendix
bookstore/book/title Title bookstore/book/author Author bookstore/book/category Category bookstore/book/price Price bookstore/book/price/@currency Currency bookstore/book/@id ID bookstore/book COMPLETE ROW
P a g e 117 | 143
Appendix
F)
Exemplary DatabaseWrapper Configuration File for Bookstore Application
bookstore/book Book:* bookstore/book/@id Book:id bookstore/book/@stock Book:amount_in_stock bookstore/book/@reorderLevel Book:reorder_value bookstore/book/@reordered Book:is_reordered bookstore/book/@language
P a g e 118 | 143
Appendix
Book:language bookstore/book/title Book:title bookstore/book/author Book:author bookstore/book/category Book:category bookstore/book/price Book:price bookstore/book/price/@currency Book:currency bookstore/book/@id Book:id bookstore/book Book:*
P a g e 119 | 143
Appendix
G)
Generated X3DOM Representation of an exemplar Book Instance
P a g e 120 | 143
Appendix
P a g e 121 | 143
Appendix
H)
Client-side Configuration - Connecting to the IVIS Infrastructure
var stompClient = undefined; // is called as soon as the document is loaded function connect() { // declare socket via SockJS to ensure HTTP fallback var socket = new SockJS('/initial/visualize'); // declare stompClient var holding connection to STOMP broker stompClient = Stomp.over(socket); // establish connection stompClient.connect({}, function(frame) { console.log('Connected: ' + frame); // subscriptions to STOMP endpoints // initial scene stompClient.subscribe('/user/queue/initial/visualize', function(object) { var serverSideVisualizationMessage = JSON.parse(object.body); var x3domSceneString = serverSideVisualizationMessage.responseScene; integrateSceneIntoDOM(x3domSceneString); }); // runtime additional data ta',
stompClient.subscribe('/user/queue/runtime/visualizeAdditionalDa function(object) { var runtimeAdditionalDataMessage =
JSON.parse(object.body); var additionalObjects = runtimeAdditionalDataMessage.additionalObjects; integrateSceneIntoDOM_runtime(additionalObjects); }); // runtime user triggered modification stompClient.subscribe('/user/queue/runtime/modify', function(object) { var runtimeModificationMessage = JSON.parse(object.body); var infoMessage = runtimeModificationMessage.responseInfoMessage;
P a g e 122 | 143
Appendix
alert(infoMessage); }); // data source change event stompClient.subscribe('/topic/dataSourceChange', function(object) { if($("x3d").length > 0){ var dataSourceChangeMessage = JSON.parse(object.body); sendSynchronizationRequest(dataSourceChangeMessage); } }); // synchronization updates stompClient.subscribe('user/queue/synchronize', function(object) { var syncMessage = JSON.parse(object.body); var modifiedObjects = syncMessage.responseVisualizationObjects; synchronizeSceneContents(modifiedObjects); reloadAndZoomScene(); }); }); }
P a g e 123 | 143
Appendix
I)
Bookstore Application – Initial Page Load
P a g e 124 | 143
Appendix
J)
Bookstore Application – Filtered Visualization
P a g e 125 | 143
Appendix
K)
Bookstore Application – Visualizing all Book Stocks
P a g e 126 | 143
Appendix
L)
Bookstore Application – Retrieve Additional Data
P a g e 127 | 143
Appendix
M)
Bookstore Application – Object Metadata and Modification of Stock Value
P a g e 128 | 143
Appendix
N)
Bookstore Application – Modification Notification
P a g e 129 | 143
Appendix
O)
Bookstore Application – Synchronize Notification
P a g e 130 | 143
Appendix
P)
Bookstore Application – Synchronized/Updated Visualization
P a g e 131 | 143
Appendix
Bibliography Adnan, K., Sazzad, K., Emdad, A. & Rokonuzzaman, M., n.d. Scene Graph Management for OpenGL based 3D Graphics Engine, North South University, Dhaka 12, Bangladesh: Department of computer Science. Agrawal, D., Bernstein, P. & Bertino, E., 2012. Challenges and Opportunities with Big Data - A community white paper developed by leading researchers across the United States. [Online] Available at: www.purdue.edu/discoverypark/cyber/assets/pdfs/BigDataWhitePaper.pdf [Accessed 20 August 2016]. Akase, R. & Okada, Y., 2015. Web based Time-tunnel: An Interactive Multidimensional Data Visualization Tool Using Genetic Algorithm. Barcelona, Spain, IEEE Xplore. Akenine-Möller, T., Haines, E. & Naty, H., 2008. Real-Time Rendering, Third Edition. 3. ed. Massachusetts: CRC Press. Allendoerfer, K. et al., 2005. Adapting the Cognitive Walkthrough Method to Assess the Usability of a Knowledge Domain Visualization. Washington, DC, USA, IEEE Computer Society. Analytical Graphics, 2016. Cesium. [Online] Available at: https://cesiumjs.org/ [Accessed 26 April 2016]. Bartelme, N., 2005. Geoinformatik: Modelle, Strukturen, Funktionen. 4. ed. Graz: Springer. Bar-Zeev, A., 2007. Scenegraphs: Past, Present, and Future. [Online] Available at: http://www.realityprime.com/scenegraph.php [Accessed 29 March 2016]. Baumann, P., 2016. EarthServer 2. [Online] Available at: http://www.earthserver.eu/about [Accessed 18 May 2016]. Behr, J., Eschler, P., Jung, Y. & Zöllner, M., 2009. X3DOM: a DOM-based HTML5/X3D integration model. Darmstadt, ACM, New York, pp. 127-135. Bootstrap, 2016 a. Get Bootstrap. [Online] Available at: http://getbootstrap.com/ [Accessed 22 August 2016]. Bootstrap, 2016 b. Modal. [Online] Available at: http://v4-alpha.getbootstrap.com/components/modal/ [Accessed 05 September 2016].
P a g e 132 | 143
Appendix
Bornschlegl, M. et al., 2016. A Reference Model and Conceptual System Architecture for Advanced Visual Interfaces Supporting Big Data Applications in Virtual Research Environments. Bari, Italia, s.n., p. forthcoming. Bowman, D., Kruijff, E., Laviola Jr., J. & Poupyrev, I., 2004. 3D User Interfaces: Theory and Practice. Boston, USA: Addison-Wesley. Brutzman, D., 2015. X3D Resources - Applications, Players and Plugins for X3D / VRML Viewing. [Online] Available at: http://www.web3d.org/x3d/content/examples/X3dResources.html [Accessed 22 January 2016]. Brutzman, D. & Daly, L., 2007. X3D: Extensible 3D Graphics for Web Authors. San Francisco: Elsevier. Campesato, O. & Nilson, K., 2010. Web 2. 0 Fundamentals: with AJAX, Development Tools, and Mobile Platforms. s.l.:Jones & Bartlett Learning. Card, S., Mackinlay, J. & Shneiderman, B., 1999. Readings in Information Visualization: Using Vision to Think. s.l.:Morgan Kaufmann Publishers. Cellary, W. & Walczak, K., 2012. Interactive 3D Content Standards. In: W. Cellary & K. Walczak, eds. Interactive 3D Multimedia Content. London: Springer-Verlag, pp. 1335. Chaturvedi, K., Yao, Z. & Kolbe, T., 2015. Web-based Exploration of and Interaction with Large and Deeply Structured Semantic 3D City Models using HTML5 and WebGL. In: T. Kersten, ed. Bridging Scales - Skalenübergreifende Nah- und Fernerkundungsmethoden (35. Wissenschaftlich-Technische Jahrestagung der DGPF). Köln, Deutschland: Deutsche Gesellschaft für Photogrammetrie, Fernerkundung und Geoinformation (DGPF) e.V., pp. 296-306. Chen, C., 2013. Information Visualization and Virtual Environments. Luxemburg: Springer Science & Business Media. Chen, J. Q. & Heath, R. D., 2005. Web Application Development Methodologies. In: Web Engineering: Principles and Techniques. s.l.:Idea Group Inc (IGI), pp. 76-96. Clark, J., 1999. XSL Transformation (XSLT). [Online] Available at: https://www.w3.org/TR/xslt [Accessed 26 April 2016]. Clark, J. & DeRose, S., 2015. XML Path Language (XPath). [Online] Available at: https://www.w3.org/TR/xpath/ [Accessed 22 August 2016]. Coward, D., 2014. Java WebSocket Programming. New York: McGraw-Hill Education.
P a g e 133 | 143
Appendix
Czarnecki, K. et al., 2008. Bidirectional Transformations: A Cross-Discipline Perspective, GRACE Meeting Notes, State of the Art, and Outlook. Tokyo, Japan, Springer. Dalling, T., 2009. Model View Controller Explained. [Online] Available at: http://www.tomdalling.com/blog/software-design/model-view-controllerexplained/ [Accessed 22 August 2016]. Daniel, F. & Matera, M., 2014. Mashups: Concepts, Models and Architectures. s.l.:Springer. Dom4J, 2016. dom4j 1.6.1. [Online] Available at: http://www.dom4j.org/dom4j-1.6.1/ [Accessed 22 August 2016]. Dübel, S., Röhlig, M., Schumann, H. & Trapp, M., 2014. 2D and 3D Presentation of Spatial Data: A Systematic Review. Paris, France, IEEE. Easy Computer Academy, 2016. What is a Database Trigger?. [Online] Available at: http://www.essentialsql.com/what-is-a-database-trigger/ [Accessed 01 September 2016]. ECMA International, 2015. Standard ECMA-262: ECMAScript® 2015 Language Specification. [Online] Available at: http://www.ecma-international.org/publications/standards/Ecma-262.htm [Accessed 04 April 2016]. Ericsson, J., 2009. Mediation systems: An approach to retrieve data homogeneously from multiple heterogeneous data sources, Gothenburg, Sweden: University of Gothenburg - Department of Applied Information Technology. Fette, I. & Melnikow, A., 2011. The WebSocket Protocol. [Online] Available at: https://tools.ietf.org/html/rfc6455 [Accessed 08 April 2016]. Fisher, M., Stoyanchev, R. & Nicoll, S., 2016. Class AbstractMessageSendingTemplate - convertAndSend. [Online] Available at: http://docs.spring.io/spring/docs/current/javadocapi/org/springframework/messaging/core/AbstractMessageSendingTemplate.html#conv ertAndSend-D-java.lang.Object[Accessed 30 August 2016]. Fowler, M., 2004. Inversion of Control Containers and the Dependency Injection pattern. [Online] Available at: http://martinfowler.com/articles/injection.html [Accessed 22 August 2016].
P a g e 134 | 143
Appendix
Fraunhofer-Gesellschaft, 2016. X3DOM - Instant 3D the HTML way. [Online] Available at: http://www.x3dom.org/ [Accessed 22 August 2016]. Fraunhofer-IGD, 2015. EarthServer. [Online] Available at: https://www.igd.fraunhofer.de/Institut/Abteilungen/VCST/Projekte/EarthServer [Accessed 18 May 2016]. git, 2016. git. [Online] Available at: https://git-scm.com/ [Accessed 22 August 2016]. Github Inc, 2016. GitHub is how people build software. [Online] Available at: https://github.com/about/ [Accessed 22 August 2016]. Google Earth, 2016. Google Earth. [Online] Available at: https://www.google.de/intl/de/earth/ [Accessed 26 April 2016]. Goralski, W., 2009. The Illustrated Network: How TCP/IP Works in a Modern Network. s.l.:Morgan Kaufmann. Haines, S., 2003. Data Access Object Pattern. [Online] Available at: http://www.informit.com/guides/content.aspx?g=java&seqNum=137 [Accessed 20 August 2016]. Havele, A., 2015 a. Web3D and X3D Overview. [Online] Available at: http://www.web3d.org/sites/default/files/page/About%20Web3D%20Consortium/Web3 D%20and%20X3D%20Overview_1.pdf [Accessed 01 April 2016]. Havele, A., 2015 b. X3D: THE REAL-TIME 3D SOLUTION FOR THE WORLD-WIDE WEB. [Online] Available at: http://www.web3d.org/sites/default/files/page/About%20Web3D%20Consortium/What _is_X3D_Aug%202015_0.pdf [Accessed 01 April 2016]. Heer, J. & Shneiderman, B., 2012. Interactive dynamics for visual analysis. Communications of the ACM, 55(4), pp. 45-54. Herschel, M., 2014. Information Integration: Materialized and Virtual Integration. [Online] Available at: https://www.ipvs.unistuttgart.de/export/sites/default/ipvs/abteilungen/as/abteilung/mitarbeiter/Melanie.Hersc
P a g e 135 | 143
Appendix
hel_infos/resources/03_materialized_vs_virtual.pdf [Accessed 12 April 2016]. Hiemstra, D., 2009. Information Retrieval Models. In: Information Retrieval: Searching in the 21st Century. s.l.:John Wiley & Sons, pp. 01-20. Hogan, P. & Kim, R., 2011. World Wind Java SDK. [Online] Available at: http://worldwind.arc.nasa.gov/java/ [Accessed 26 April 2016]. Hsieh, H. & Shipman, F., 2002. Manipulating structured information in a visual workspace. Tokyo, Japan, ACM, New York, NY. Hu, Y. et al., 2013. A Multi-stage Collaborative 3D GIS to Support Public Participation. International Journal of Digital Earth 8(3), pp. 212-234. InfoVis:Wiki, 2013. Information Visualization. [Online] Available at: http://www.infovis-wiki.net/index.php?title=Information_Visualization [Accessed 27 March 2016]. instant3Dhub, 2016. instant3Dhub. [Online] Available at: http://instant3dhub.org/ [Accessed 26 April 2016]. Jackson, D., 2014. WebGL Specification. [Online] Available at: https://www.khronos.org/registry/webgl/specs/1.0/ [Accessed 12 February 2016]. Jankowski, J. et al., 2013. Declarative Integration of Interactive 3D Graphics into the World-Wide Web: Principles, Current Approaches, and Research Agenda. San Sebastian, Spain, s.n. Johnson, R. & et al., 2016 a. 22.3 Implementing Controllers. [Online] Available at: http://docs.spring.io/spring/docs/current/spring-frameworkreference/htmlsingle/#mvc-controller [Accessed 28 August 2016]. Johnson, R. & et al., 2016 b. 26.4.5 Sending Messages. [Online] Available at: http://docs.spring.io/spring/docs/current/spring-frameworkreference/html/websocket.html#websocket-stomp-handle-send [Accessed 22 August 2016]. Johnson, R. & et al., 2016 c. 7.3 Bean overview. [Online] Available at: http://docs.spring.io/spring/docs/current/spring-frameworkreference/htmlsingle/#beans-definition [Accessed 25 August 2016]. Jones, D., n.d. Static / Dynamic Information - Introduction. [Online] Available at: http://www.teach-
P a g e 136 | 143
Appendix
ict.com/as_a2_ict_new/ocr/AS_G061/311_data_info_knowledge/static_dynamic_data/ miniweb/index.htm [Accessed 20 June 2016]. Jung, Y., Behr, J., Drevensek, T. & Wagner, S., 2012. Declarative 3D Approaches for Distributed Web-based Scientific Visualization Services. Lyon, France, CEUR Workshop Proceedings (CEUR-WS.org). JUnit, 2016. JUnit. [Online] Available at: http://junit.org/junit4/ [Accessed 22 August 2016]. Khronos Group, 2016. OpenGL ES 2.0 for the Web. [Online] Available at: https://www.khronos.org/webgl/ [Accessed 04 April 2016]. Klimke, J. & Döllner, J., 2010. Combining Synchronous and Asynchronous Collaboration within 3D City Models. Geographic Information Science: 6th International Conference, Volume Volume 6292. Kloss, J. H., 2010. X3D Programmierung interaktiver 3D-Anwendungen für das Internet. München: Addison-Wesley Verlag. Laplante, P., 2007. What Every Engineer Should Know about Software Engineering. Boca Raton: CRC Press. Le Feuvre, J., 2012. Towards Declarative 3D in Web Architecture. Lyon, France, CEUR Workshop Proceedings (CEUR-WS.org). Leissler, M., Hemmje, M. & Neuhold, E. J., 1999. Supporting Image-Retrieval by Database Driven Interactive 3D Information-Visualization. Amsterdam, SpringerVerlag, Berlin Heidelberg. Leman, S. et al., 2010. A Bi-directional Visualization Pipeline that Enables Visual to Parametric Interation (V2PI), s.l.: FODAVA (Foundation of Data and Visual Analytics). Li, B., Wu, J., Pan, M. & Huang, J., 2015. Application of 3D WebGIS and real-time technique in earthquake information publishing and visualization. Earthquake Science, 16 June, Issue 28(3), pp. 223-231. Lubbers, P. & Greco, F., 2015. HTML5 WebSocket: A Quantum Leap in Scalability for the Web. [Online] Available at: http://www.websocket.org/quantum.html [Accessed 20 February 2016]. Mahajan, A., 2016. 3D Is The New 2D. [Online] Available at: https://techcrunch.com/2016/02/02/3d-is-the-new-2d/ [Accessed 30 June 2016].
P a g e 137 | 143
Appendix
McCann, M., Yoo, B. & Brutzman, D., 2014. Integration of X3D Geospatial in a Data Driven Web Application. Vancouver, ACM, New York, NY, p. 145. McHenry, K. & Bajcsy, P., 2008. An Overview of 3D Data Content, File Formats and Viewers, University of Illinois at Urbana-Champaign, Urbana, IL: National Center for Supercomputing Applications. Mesnil, J., 2012. STOMP Over WebSocket. [Online] Available at: http://jmesnil.net/stomp-websocket/doc/ [Accessed 04 September 2016]. Mesnil, J. & Lindsay, J., 2015. STOMP.js. [Online] Available at: https://github.com/jmesnil/stomp-websocket [Accessed 22 August 2016]. Mozilla Developer Network, 2016. XPath. [Online] Available at: https://developer.mozilla.org/en-US/docs/Web/XPath [Accessed 26 September 2016]. Nicolaescu, P., Toubekis, G. & Klamma, R., 2015. A Microservice Approach for Near Real-Time Collaborative 3D Objects Annotation on the Web. Guangzhou, China, Springer International Publishing, pp. 187-196. North, C., Endert, A., Andrews, C. & Fink, G., 2010. The Visualization Pipeline is Broken, s.l.: FODAVA (Foundation of Data and Visual Analytics). Object Management Group, 2015. OMG Unified Modeling Language TM (OMG UML). [Online] Available at: http://www.omg.org/spec/UML/2.5/PDF [Accessed 27 September 2016]. OECD, 2007. Participative Web and User-Created Content Web 2.0, Wikis and Social Networking, Paris, France: OECD Publishing. OGC, 2012. CityGML. [Online] Available at: http://www.opengeospatial.org/standards/citygml [Accessed 26 April 2016]. Oracle, 1996. Database Triggers. [Online] Available at: https://docs.oracle.com/cd/A57673_01/DOC/server/doc/SCN73/ch15.htm [Accessed 01 September 2016]. Oracle, 2015. Watching a Directory for Changes. [Online] Available at: https://docs.oracle.com/javase/tutorial/essential/io/notification.html [Accessed 01 September 2016]. Oracle, 2016 a. Java Development Kit 8. [Online] Available at: http://www.oracle.com/technetwork/java/javase/8u-relnotes-2225394.html [Accessed 22 August 2016].
P a g e 138 | 143
Appendix
Oracle, 2016 b. Java SE Technologies - Database. [Online] Available at: http://www.oracle.com/technetwork/java/javase/jdbc/index.html [Accessed 22 August 2016]. Ortega, F. et al., 2016. Interaction Design for 3D User Interfaces: The World of Modern Input Devices for Research, Applications, and Game Development. Boca Raton, Florida, USA: CRC Press. Pivotal Software, 2016 a. Spring Framework. [Online] Available at: http://projects.spring.io/spring-framework/ [Accessed 22 August 2016]. Pivotal Software, 2016 b. WebSocket Support. [Online] Available at: http://docs.spring.io/spring/docs/current/spring-frameworkreference/html/websocket.html [Accessed 22 August 2016]. rasdaman GmbH, 2015. rasdaman - raster data manager. [Online] Available at: http://www.rasdaman.com/ [Accessed 18 May 2016]. Rodrigues, J., Figueiredo, M. & Costa, C., 2013. Web3DGIS for city models with CityGML and X3D. London, IEEE Xplore. Schubotz, R. & Harh, A., 2012. Towards Networked Linked Data-Driven Web3D Applications. Lyon, France, dblp computer science bibliography. Schweizer-Ries, P., 2015. Der Erlebnisraum Nachhaltige Entwicklung (ENE). [Online] Available at: http://www.hochschulebochum.de/fbe/integrinstnachentwicklung/forschungsprojekte/fh-strukturprojektforschungsschwerpunkt-nachhaltige-entwicklung/erlebnisraum-nachhaltigeentwicklung-ene.html [Accessed 04 April 2016]. SenseCare, 2016 a. Overview - SenseCare. [Online] Available at: http://www.sensecare.eu/ [Accessed 18 May 2016]. SenseCare, 2016 b. SenseCare - About. [Online] Available at: http://www.sensecare.eu/about-us/ [Accessed 18 May 2016]. Settapat, S., Archirapatkave, V., Achalakul, T. & Ohkura, M., 2010. A Framework of Web 3D-Based Medical Data Reconstruction and Visualization. Lyon, France, IEEE Xplore, pp. 43-47. Settapat, S., Ohkura, M. & Achalakul, T., 2009. A Web-based 3D Collaborative Virtual Environment for Distance Learning. Fukuoka, Japan, ICCAS-SICE.
P a g e 139 | 143
Appendix
Shklar, L. & Rosen, R., 2003. Web Application Architecture: Principles, Protocols and Practices. s.l.:John Wiley & Sons. SockJS, 2016 a. SockJS Protocol. [Online] Available at: https://github.com/sockjs/sockjs-protocol [Accessed 22 August 2016]. SockJS, 2016 b. SockJS-client. [Online] Available at: https://github.com/sockjs/sockjs-client [Accessed 22 August 2016]. Spence, R., 2014. Information Visualization: An Introduction. Berlin: Springer. Spence, R. & Apperlay, M., n.d. Focus + Context Displays as Visualization Transformations. [Online] Available at: https://www.interaction-design.org/literature/book/the-encyclopedia-ofhuman-computer-interaction-2nd-ed/bifocaldisplay#heading_Focus_+_Context_Displays_as_Visualization_Transformations_page_ 12476 [Accessed 27 March 2016]. Statista, 2016. Anteil der Internetnutzer in Deutschland in den Jahren 2001 bis 2015. [Online] Available at: http://de.statista.com/statistik/daten/studie/13070/umfrage/entwicklungder-internetnutzung-in-deutschland-seit-2001/ [Accessed 28 March 2016]. STOMP, 2012 a. STOMP. [Online] Available at: http://stomp.github.io/index.html [Accessed 22 August 2016]. STOMP, 2012 b. STOMP Frames. [Online] Available at: http://stomp.github.io/stomp-specification-1.2.html#STOMP_Frames [Accessed 22 August 2016]. STOMP, 2012 c. STOMP Protocol Specification, Version 1.2. [Online] Available at: http://stomp.github.io/stomp-specification-1.2.html [Accessed 22 August 2016]. STOMP, 2015. STOMP Implementations. [Online] Available at: http://stomp.github.io/implementations.html [Accessed 22 August 2016]. Stoyanchev, R., 2012. Spring MVC 3.2 Preview: Techniques for Real-time Updates. [Online] Available at: https://spring.io/blog/2012/05/08/spring-mvc-3-2-preview-techniques-forreal-time-updates/ [Accessed 22 August 2016].
P a g e 140 | 143
Appendix
The Apache Software Foundation, 2016 a. Introduction to the Standard Directory Layout. [Online] Available at: https://maven.apache.org/guides/introduction/introduction-to-the-standarddirectory-layout.html [Accessed 25 August 2016]. The Apache Software Foundation, 2016 b. Welcome to Apache Maven. [Online] Available at: https://maven.apache.org/ [Accessed 22 August 2016]. The jQuery Foundation, 2016. JQuery - write less, do more.. [Online] Available at: https://jquery.com/ [Accessed 22 August 2016]. The PostgreSQL Global Development Group, 2016 a. LISTEN. [Online] Available at: https://www.postgresql.org/docs/current/static/sql-listen.html [Accessed 01 September 2016]. The PostgreSQL Global Development Group, 2016 b. NOTIFY. [Online] Available at: https://www.postgresql.org/docs/current/static/sql-notify.html [Accessed 01 September 2016]. The PostgreSQL Global Development Group, 2016 c. PostgreSQL -About. [Online] Available at: https://www.postgresql.org/about/ [Accessed 22 August 2016]. The PostgreSQL Global Development Group, n.d. Listen / Notify. [Online] Available at: https://jdbc.postgresql.org/documentation/81/listennotify.html [Accessed 01 September 2016]. UniVocity Data Integration, 2016. About uniVocity-parsers. [Online] Available at: http://www.univocity.com/pages/about-parsers [Accessed 22 August 2016]. Vale, S. & UNECE, 2013. Classification of Types of Big Data (UNECE). [Online] Available at: http://www1.unece.org/stat/platform/display/bigdata/Classification+of+Types+of+Big+ Data [Accessed 20 June 2016]. W3C Community Group (Declarative 3D), 2016. Declarative 3D for the Web Architecture Community Group. [Online] Available at: https://www.w3.org/community/declarative3d/ [Accessed 08 April 2016]. W3School, 2016 a. Web TCP/IP. [Online] Available at: http://www.w3schools.com/website/web_tcpip.asp [Accessed 08 April 2016].
P a g e 141 | 143
Appendix
Waibel, G., 2016. Smithsonian X 3D. [Online] Available at: http://3d.si.edu/ [Accessed 25 April 2016]. Walczak, K., 2012 a. Building Configurable 3D Web Applications with Flex-VR. In: W. Cellary & K. Walczak, eds. Interactive 3D Multimedia Content. London: SpringerVerlag London, pp. 103-136. Walczak, K., 2012 b. Dynamic Database Modeling of 3D Multimedia Content. In: W. Cellary & K. Walczak, eds. Interactive 3D Multimedia Content. London: Springer, pp. 55-102. Wang, V., Salim, F. & Moskovits, P., 2013. The Definitive Guide to HTML5 WebSocket. New York: Apress. Ward, M. O., Grinstein, G. & Keim, D., 2015. Interactive Data Visualization: Foundations, Techniques, and Applications, Second Edition. s.l.:CRC Press. Ware, C., 2004. Information Visualization - Perception for Design. 2. ed. San Francisco: Morgan Kaufmann, Elsevier. Web3D Consortium, 2008. Extensible 3D (X3D): Part 1: Architecture and base components (ISO/IEC 19775-1:2008). [Online] Available at: http://www.web3d.org/documents/specifications/19775-1/V3.2/ [Accessed 03 April 2016]. Web3D Consortium, 2013. Extensible 3D (X3D): Part 2: Scene access interface (SAI) Concepts. [Online] Available at: http://www.web3d.org/documents/specifications/197752/V3.3/Part02/concepts.html [Accessed 13 01 2016]. Web3D Consortium, 2015. Join the Web3D Consortium. [Online] Available at: http://www.web3d.org/join [Accessed 31 March 2016]. Web3D Consortium, 2016. Why Use X3D. [Online] Available at: http://www.web3d.org/x3d/why-use-x3d [Accessed 29 March 2016]. Wiederhold, G., 1992. Mediators in the Architecture of Future Information Systems. IEEE Computer Magazine, Issue 04/1992, pp. 38-49. Wiza, W., 2012. Interactive 3D Visualization of Search Results. In: W. Cellary & K. Walczak, eds. Interactive 3D Mutlimedia Content. London: Springer-Verlag, pp. 253291.
P a g e 142 | 143
Appendix
X3DOM, 2016. Profile. [Online] Available at: http://www.x3dom.org/nodes-2/ [Accessed 04 April 2016]. Zuech, R., Khoshgoftaar, T. & Wald, R., 2015. Intrusion detection and Big Heterogeneous Data: a Survey. Journal of Big Data, 27 February.
P a g e 143 | 143