Bull. Chem. Soc. Ethiop. 2016, 30(2), 263-272. Printed in Ethiopia DOI: http://dx.doi.org/10.4314/bcse.v30i2.10
ISSN 1011-3924 2016 Chemical Society of Ethiopia
SYNTHESES AND CHARACTERIZATIONS OF THE CYANIDE-BRIDGED HETERONUCLEAR POLYMERIC COMPLEXES WITH 2-ETHYLIMIDAZOLE Dursun Karaağaç1*and Güneş Süheyla Kürkçüoğlu2 1
2
Ulubatlı Hasan Anatolian High School, 16320 Bursa, Turkey Eskişehir Osmangazi University, Faculty of Arts and Sciences, Department of Physics, 26480 Eskişehir, Turkey (Received October 28, 2015; revised June 25, 2016)
ABSTRACT. Three new cyano-bridged heteronuclear polymeric complexes, [Cu(etim)3Ni(CN)4]n, {[Zn(etim)3Ni(CN)4]∙H2O}n and [Cd(etim)2Ni(CN)4]n (etim = 2-ethylimidazole, hereafter abbreviated as Cu–Ni– etim, Zn–Ni–etim and Cd–Ni–etim) have been prepared in powder form and characterized by FT-IR and Raman spectroscopies, thermal (TG, DTG and DTA) and elemental analyses. The spectral features of the complexes suggest that the Ni(II) ion is four coordinate with four cyanide-carbon atoms in a square planar geometry, whereas the Cu(II) and the Zn(II) ions of the Cu–Ni–etim and the Zn–Ni–etim complexes are completed by nitrogen atoms of two cyano groups of [Ni(CN)4]2- coordinated to the adjacent M(II) ions and three nitrogen atoms of the etim ligands. The Cd(II) ion of the Cd–Ni–etim complex is six-coordinate, completed with the two nitrogen atoms of the etim ligands and the four nitrogen atoms from bridging cyano groups. Polymeric structures of the Cu–Ni–etim and the Zn–Ni–etim complexes are 1D coordination polymer, while complex the Cd–Ni–etim presents a 2D network. The thermal decompositions in the temperature range 30–700 C of the complexes were investigated in the static air atmosphere. KEY WORDS: Tetracyanonickelate(II) complex, 2-Ethylimidazole complex, Cyanide-bridged complex, Vibration spectra, Thermal analysis
INTRODUCTION Coordination polymers include metal ions linked by coordinated ligands into an endless array. This endless net must be defined by coordination bonds. Coordination polymers can form surprising supramolecular contractions which indicate regulation one, two, three dimensional due to coordination bonds. Cyanometallate complexes in coordination polymers have an important place and they are known to be among the first coordination compounds that has been prepared, studied, described and used up to now. Therefore, they have still continued actuality in the coordination chemistry [1-3]. Additionally, cyanometallate complexes exhibiting polymeric structures have found many application areas such as electrical conductivity [4], molecular sieves and ion exchange materials [5], molecular magnetic nanowires [6] and host-guest systems [7]. Cyanide anions having binding ability to various center atoms are used in the synthesis of one, two or three dimensional structures in organometallic and coordination chemistry. Cyanometallate building blocks containing cyanide groups, [M(CN)x]n- such as [Ni(CN)6]4-, [Ni(CN)4]2-, [Pd(CN)4]2-, [Pt(CN)4]2- and [Au(CN)4]- have been extensively utilized to form multidimensional networks [3, 8-10]. This is due to fact that both the carbon and the nitrogen ends of the cyanide ion act as Lewis bases that can coordinate two different metal cations acting as the corresponding Lewis acids. Accordingly, cyanometallate readily forms coordination polymers when reacted with transition-metal cations and can promote strong magnetic exchange. However, there have been many studies on octahedral [M(CN)6]n- but little interest has been drawn to square-planar [M(CN)4]n- [M(II) = Ni, Pd or Pt] bridging units [11-13]. The well-known Hofmann-type structures consist of building blocks [M(CN)4]n- and the general __________ *Corresponding author. E-mail:
[email protected]
264
Dursun Karaağaç and Güneş Süheyla Kürkçüoğlu
formula is shown as [M(L)xM′(CN)4] n [where x = 2 or 1; M(II) = Mn, Fe, Co, Ni, Cu, Zn or Cd; M′(II) = Ni, Pd or Pt] [14]. In our previous studies, we reported the tetracyanonickelate(II) or tetracyanopalladate(II) complexes with imidazole [15], N-methylimidazole [16], 2-methylimidazole [15, 17], 4(5)methylimidazole [18] and 1-ethylimidazole [19]. In this study, three new complexes using 2ethylimidazole molecule, [Cu(etim)3Ni(CN)4]n, {[Zn(etim)3Ni(CN)4]∙H2O}n and [Cd(etim)2Ni(CN)4] n, were synthesized and investigated by vibrational spectral (FT-IR and Raman), thermal and elemental analyses techniques. EXPERIMENTAL Materials Nickel(II) chloride hexahydrate (NiCl26H2O-97%, Riedel-de Haen), copper(II) chloride dihydrate (CuCl22H2O-99%, Merck), zinc(II) chloride (ZnCl2-96%, Merck), cadmium(II) chloride hemi(pentahydrate) (CdCl22.5H2O-99%, Across Organics), potassium cyanide (KCN96%, Sigma-Aldrich) and 2-ethylimidazole (C5H8N2-98%, Sigma-Aldrich) from commercial sources were used as received. Syntheses of the complexes To water solution of nickel(II) chloride hexahydrate (1 mmol, 0.238 g) was added a solution of potassium cyanide (4 mmol, 0.260 g) in water solution and K2[Ni(CN)4]H2O complex was obtained as crystallized. The K2[Ni(CN)4]H2O (1 mmol, 0.259 g) complex was dissolved in distilled water, then 1 mmol of the metal(II) chloride (CuCl22H2O = 0.170 g, ZnCl2 = 0.136 g and CdCl22.5H2O = 0.228 g) dissolved in distilled water were added to this solution under stirring and the M[Ni(CN)4]H2O [M = Cu(II), Zn(II) or Cd(II)] complexes obtained were filtered and dried in air. To 1 mmol of M[Ni(CN)4]H2O {Cu[Ni(CN)4]H2O = 0.244 g, Zn[Ni(CN)4]H2O = 0.246 g or Cd[Ni(CN)4]H2O = 0.293 g} aqueous solution, 2 mmol of the etim (0.192 g) dissolved in ethyl alcohol were slightly added to this solution under stirring. The final mixtures were stirred for 3 h at room temperature. The products obtained were filtered and washed with water, ethanol and ether, respectively, and dried in air. The freshly prepared complexes were analyzed for C, H and N with the following results: Anal. found (calcd.) (%) for C19H24N10NiCu (Mw = 514.70 g/mol) : C, 43.94 (44.34); H, 4.90 (4.70); N, 26.84 (27.21); for C19H26N10ONiZn (Mw = 534.56 g/mol) : C, 42.50 (42.69); H, 4.91 (4.90); N, 25.37 (26.20); for C14H16N8NiCd (Mw = 467.43 g/mol) : C, 35.18 (35.97); H, 3.44 (3.45); N, 23.91 (23.97). Measurements Elemental analyses were performed using a CHNS-932 (LECO) analyzer for C, H and N at the Middle East Technical University Central Laboratory in Ankara, Turkey. The FT-IR spectra of the etim and the complexes were recorded as KBr pellets in the range of 4000–400 cm-1 (2 cm-1 resolution) on a Perkin Elmer 100 FT-IR spectrometer which was calibrated using polystyrene and CO2 bands. The Raman spectra of the complexes were recorded in the range of 4000–250 cm-1 on a Bruker Senterra Dispersive Raman instrument using laser excitation of 785 nm. A Perkin Elmer Diamond TG/DTA thermal analyzer was used to record simultaneous TG, DTG and DTA curves of the complexes in a static air atmosphere at a heating rate of 10 K min-1 in the temperature range 30–700 ºC using platinum crucibles.
Bull. Chem. Soc. Ethiop. 2016, 30(2)
Syntheses of cyanide-bridged heteronuclear polymeric complexes with 2-ethylimidazole
265
RESULTS AND DISCUSSION 2-Ethylimidazole vibrations The etim molecule containing two nitrogen atoms can donate electrons. The nitrogen atom can coordinate with a transition-metal ion and form complexes with different properties. The molecular structure of the etim is shown in Scheme 1. N
N H
Scheme 1. The molecular structure of the etim.
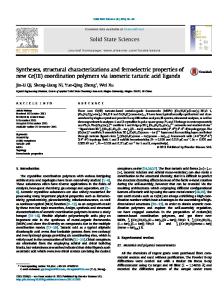
Figure 1. The FT-IR spectra of the etim and the complexes. Bull. Chem. Soc. Ethiop. 2016, 30(2)
266
Dursun Karaağaç and Güneş Süheyla Kürkçüoğlu
Figure 2. The Raman spectra of the complexes. The FT-IR and Raman spectra of all of the complexes are given in Figures 1 and 2, respectively. The tentative assignments of the modes of vibration of the free etim and that of the etim molecules in the complexes are listed in Table 1. The FT-IR spectrum of the Zn–Ni–etim complex contains absorption bands originating from (OH) and δ(OH)vibrations. In the Zn–Ni–etim complex, the absorption bands observed from 3700 to 3328 cm-1 may be attributed to the (OH) stretching mode of the water molecule. The δ(OH) bending mode is also observed at about 1600 cm-1 in the Zn–Ni–etim complex. In all the heterocyclic compounds, the (NH) stretching vibrations are typically located in the region 3500–3300 cm-1[20]. However, we have observed the (NH) stretching vibrations of the free etim at ca. 3153 cm-1 in FT-IR spectrum. The (NH) stretching vibrations of the etim ligand in the FT-IR and Raman spectra of the complexes were found to be between 3414 cm-1 and 3162 cm-1 and shifted to a higher frequency than the corresponding value of the etim molecule. This shift shows that the etim acts as monodentate ligand through the nitrogen atom of the imidazole ring. The in-plane (1375 cm-1) and out-ofplane (753 cm-1) bending vibrations of etim ligand are also supported to these shifts. The (CH) stretching vibrations arising from imidazole ring of the free etim are assigned at about 3136 cm-1 in the FT-IR spectrum and these vibrations are observed in the frequency range of 3171–3134 cm-1 in the vibration spectra of the complexes. As seen in Table 1, the etim ligand shows infrared bands in the 3110–2894 cm-1 region which are assigned to the (CH3) and (CH2) asymmetric and symmetric stretching frequencies, respectively. The absorption bands of the (CH3) and (CH2) groups in the complexes are observed in the region 3141–2932 cm-1, and Bull. Chem. Soc. Ethiop. 2016, 30(2)
Syntheses of cyanide-bridged heteronuclear polymeric complexes with 2-ethylimidazole
267
significantly shifted to lower or higher frequencies compared to that of the free ligand. The ρ(CH2) in-plane rocking vibration frequency is identified at 1105 cm-1 in the FT-IR spectrum of the etim and shifted to higher frequency compared to the free ligand in the complexes. The (CH3) in-plane and (CH3) out of plane bending modes are found at 1165 and 1123 cm-1 in the FT-IR spectrum, respectively. The bands obtained at 1009 and 957 cm-1 in FT-IR spectrum of the etim are assigned to CH3 in-plane and out-of plane rocking modes, respectively. The (C=N) stretching vibration in the imidazole is assigned to the wavenumber 1675 cm-1 in FT-IR spectrum. The observed bands at 1576, 1483 and 1453 cm-1 in FT-IR spectrum of the etim ligand are assigned to (C–N) stretching vibration. The (CC) stretching vibrations are observed at 1431 and 1395 cm-1 in FT-IR spectrum and these vibrations in the complexes shifted to higher frequency region around 1–11 cm-1 at 1431 cm-1 and lower frequency region around 1–12 cm-1 at 1395 cm-1, compared with the free etim molecule. These shifts can be explained as the coupling of the internal modes of the etim molecule with M–N(etim) vibrations. Similar shifts on coordination have been observed in the vibration spectra of the other metal-coordinated imidazole complexes [15-21]. [Ni(CN)4]2-group vibrations The modes of vibration of the [Ni(CN)4]2- group of the complexes are given in Table 2. In order to assign the bands attributable to the [Ni(CN)4]2- ion in the spectra, we refer to the work of McCullough et al. who presented vibrational data for the salt Na2Ni(CN)4 in the solid state [22]. Symmetrical vibration band [ν(CN), Eu] of complex K2[Ni(CN)4]H2O is observed at 2120 cm-1, A1g and B1g symmetry stretching vibrations arising from Raman active ν(C≡N) vibration are observed at 2160 and 2137 cm-1. In FT-IR and Raman spectra of the complexes the dominant feature is represented by strong and sharp well identifiable absorption bands due to the ν(C≡N) stretching vibrations [1, 23]. The cyanide groups exhibit strong and sharp absorption bands in vibrational spectra between 2200 and 2100 cm-1, due to the stretching vibrations of the cyanide group. The ν(C≡N) stretching vibrations are an important tool to distinguish between terminal and bridging character in the cyanide complexes. The bridging cyanide frequencies in cyano-bridged complexes are usually observed at higher wavenumbers than those of the terminal cyanide. Shifting to higher wavenumbers of the cyanide stretching frequency upon the formation of cyanide bridges occur due to both the kinematic coupling and increasing the CN force constant when a second metal center is attached to the CN unit. In the FT-IR spectra of the complexes, the ν(C≡N) absorption bands are observed at 2173, 2160, 2135 and 2128 cm-1 (for the Cu–Ni– etim), 2173 and 2143 cm-1 (for the Zn–Ni–etim) and 2142 cm-1 (for the Cd–Ni–etim). Thus, in the Cu–Ni–etim complex, the two high wavenumbers, 2173 cm-1 and 2160 cm-1, correspond to the bridging cyanide and the two low wavenumbers, 2135 cm-1 and 2128 cm-1, correspond to the terminal cyanide. Additionally, in the Zn–Ni–etim complex, the two (CN) bands, which appeared at 2173 and 2143 cm-1, can be assigned to the bridging and terminal cyanide groups, respectively. However, the Cd–Ni–etim complex contains only one ν(C≡N) absorption band at 2142 cm-1 belonging to the bridging cyano groups. From the FT-IR spectra of the complexes, it is determined that the (C≡N) stretching vibrational mode of the cyanide has shifted to approximately 22-53 cm-1 higher frequency (see Table 2). The cyanide stretching bands in the Raman spectra of the complexes were observed at 2166 and 2131 cm-1 in the Cu–Ni–etim, at 2182 and 2142 cm-1 in the Zn–Ni–etim, at 2156 cm-1 in the Cd–Ni–etim, respectively. On the other hand, the in-plane bending vibrational mode, δ(NiCN) was observed at 414 cm-1 in the FT-IR spectrum of the K2[Ni(CN)4]H2O which was shifted to the higher frequency range around 1–12 cm-1 for the complexes. This result supports the shift of ν(C≡N) stretching vibrational band. Such frequency shifts have been observed for the other cyanide complexes [15, 16, 19, 24]. The representative illustrations of the complexes are shown in Scheme 2. Bull. Chem. Soc. Ethiop. 2016, 30(2)
268
Dursun Karaağaç and Güneş Süheyla Kürkçüoğlu
Table 1. The modes of vibration of the etim in the complexes (cm-1). Assignments [20] (NH) (99) (CH) (97) νas(CH3) (98) νs(CH3) (99) as(CH2) (96) s(CH2) (98) (C=N) (90) (C–N) (86) (C–N) (87) (C–N)(86) (C–C) (96) (C–C) (96) δ(NH)(78), δ(CN)(19) R bend1 (75), δ(CC)(18) R bend2 (72), δ(CC)(20) δ(CH)(78), δ(CN)(20) δ(CH)(88), δ(CN)(18) δ(CH3) (98) δ(CH3)(97) δ(CH3)(99) r(CH2)(71), δ(CN)(18) ω(NH)(62), ω(CH)(22) r(CH3) (74) r(CH3)(76) ω(CH)(65), (CC) (23) δ(CC)(75), (CN) (23) ω(CH)(63), ω(CN)(24) δ(CC)(72), δ(CN)(20) τR bend1 (60) τR bend2 (61)
Etim (liquid) 3153 w 3136 vw 3110 w 3046 w 2981 m 2894 w 1675 w 1576 vs 1483 w 1453 vs 1431 w 1395 m 1375 vw 1332 m 1312 w 1260 vw 1245 vw 1165 vw 1154 w 1123 w 1105 vs 1052 vs 1009 m 957 vs 911 m 796 w 753 vs 736 s 653 vw 626 vw
Cu–Ni–etim FT-IR Raman 3316 vs 3162 m 3154 w 3120 vw 3021 w 2978 m 2985 w 2938 w 2934 m 1708 w 1567 vs 1564 w 1497 vw 1495 vs 1464 vs 1436 vw 1438 w 1383 m 1364 w 1363 m 1318 m 1320 w 1291 w 1289 w 1237 w 1231 vw 1200 vw 1154 w 1132 w 1136 m 1111 vs 1108 vw 1054 vs 1062 w 1007 vw 1008 w 961 w 959 w 930 vw 929 m 853 w 852 vw 756 vs 756 vw 721 s 721 vw 652 w 651 s 625 vw -
Zn–Ni–etim FT-IR Raman 3189 w 3196 vw 3136 w 3134 s 3112 vw 3020 sh 3015 sh 2978 m 2938 w 2938 vs 1718 vw 1575 m 1499 sh 1498 vs 1456 vs 1474 vs 1442 vs 1390 vw 1395 vw 1376 w 1377 w 1320 s 1318 w 1276 vw 1247 m 1240 w 1176 m 1176 m 1144 s 1144 s 1122 vw 1054 vs 1063 m 1012 vw 1034 m 953 m 959 m 929 vw 930 w 842 vw 842 w 760 s 784 vw 743 vs 739 w 655 w 656 s -
Cd–Ni–etim FT-IR Raman 3419 vs 3414 w 3138 w 3171 w 3141 w 3010 w 2973 w 2970 w 2932 w 2939 m 1691 vw 1561 vs 1561 vw 1498 w 1497 s 1465 m 1430 s 1433 w 1391 vw 1382 vw 1366 w 1366 w 1319 w 1311 vw 1273 w 1276 vw 1232 w 1226 vw 1207 vw 1200 vw 1158 w 1132 w 1131 m 1105 vs 1057 vs 1056 w 1007 vw 1007 w 966 w 965 w 927 w 928 w 858 m 854 vw 780 w 790 vw 747 vs 748 vw 642 m 659 w 607 m -
Abbreviations: –stretching; as – asymmetricstretching; s – symmetricstretching; δ – bending; ω – out-of-plane bending; R – ring; r –rocking.
Table 2. The modes of vibration of the [Ni(CN)4]2- group in the complexes(cm-1). Assignments [22] K2[Ni(CN)4]H2O Cu–Ni–etim Zn–Ni–etim Cd–Ni–etim A1g, ν(CN) (2160) vs (2166) vs (2182) vs (2156) vs B1g, ν(CN) (2137) m (2131) m (2142) m Eu, ν(CN) 2120 vs 2173 s, 2160 s, 2135 vs, 2128 vs 2173 vs, 2143 sh 2142 vs 13 ν( CN) 2084 vw 2090 vw Eu, ν(NiC) 542 w 548 vw 558 vw 542 vw A2u, π(NiCN) 443 w 441 vw 477 vw 461 w Eu, δ(NiCN) 414 vs 414 vs 426 vs 424 vs The symbols ν, δ and refer to valence, in-plane and out-of-plane vibrations, respectively. s strong, m medium, w weak, sh shoulder, v very. The bands observed in the Raman spectra are given in parentheses.
Bull. Chem. Soc. Ethiop. 2016, 30(2)
Syntheses of cyanide-bridged heteronuclear polymeric complexes with 2-ethylimidazole
(a)
269
(b)
Scheme 2. The representative illustration of the Cu–Ni–etim and the Zn–Ni–etim (a) and the Cd–Ni–etim (b). The water molecule is not shown in the Zn–Ni–etim. Thermal analysis Thermal decomposition behaviors of the complexes were performed in temperature range 30– 700 C in static air atmosphere. Thermoanalytical data and thermal decomposition curves of the complexes are given in Table 3 and Figures 3-5, respectively. Thermal decomposition of the complexes proceeds in the three stages. In the first stage, the Cu–Ni–etim and the Cd–Ni–etim complexes lose the one etim ligand in a single step in the temperature range of 161–192 C for the Cu–Ni–etim and 98–291 C for the Cd–Ni–etim, but the Zn–Ni–etim complex loses one water molecule between 30 and 160 C. In the second stage, the endothermic peaks in the temperature range 192–407 ºC for the Cu–Ni–etim and 160-463 ºC for the Zn–Ni–etim correspond to the loss of the two etim ligands but in the temperature range 291–407 ºC for the Cd–Ni–etim are released the one etim ligand. These values were found as following; the two etim ligands for the Cu–Ni–etim and the Zn–Ni–etim, the one etim ligand for the Cd–Ni–etim [found (calcd.) (%) = 35.17 (37.35) for the Cu–Ni–etim, 33.05 (35.96) for the Zn–Ni–etim and 19.64 (20.56) for the Cd–Ni–etim]. In the following stages of the Cu–Ni–etim and the Cd–Ni– etim complexes, the remaining four cyanide groups decompose as exothermic in the 407–476 ºC temperature range for the Cu–Ni–etim and in the 407–435 ºC temperature range for the Cd–Ni– etim. In the next step in the Zn–Ni–etim complex, the remaining four cyanide groups and the one etim ligand decompose between 463 and 504 C. The final decomposition products were identified as CuO and NiO for the Cu–Ni–etim, ZnO and NiO for the Zn–Ni–etim and CdO and NiO for the Cd–Ni–etim [found (calcd.) (%) = 28.78 (29.96) for the Cu–Ni–etim, 28.42 (29.19) for the Zn–Ni–etim and 42.08 (43.45) for the Cd–Ni–etim]. The thermal decomposition products were identified by FT-IR spectroscopy.
Bull. Chem. Soc. Ethiop. 2016, 30(2)
270
Dursun Karaağaç and Güneş Süheyla Kürkçüoğlu
Table 3. Thermoanalytical data of the complexes. Complexes
[Cu(etim)3Ni(CN)4] [Cu(etim)2Ni(CN)4] [CuNi(CN)4] [Zn(etim)3Ni(CN)4]∙H2O [Zn(etim)3Ni(CN)4] [Zn(etim)Ni(CN)4] [Cd(etim)2Ni(CN)4] [Cd(etim)Ni(CN)4] [CdNi(CN)4]
Stage Temperature DTGmax range (C) (ºC)
1 2 3 1 2 3 1 2 3
161 - 192 192 - 407 407 - 476 30 - 160 160 - 463 463 - 504 98 - 291 291 - 407 407 - 435
Removed group
174 (+) etim 195 (+) 2(etim) 411 (-) 4(CN) H2O 2(etim) 467 (-) etim+4(CN) 287 (+) etim 320 (+) etim 419 (-) 4(CN)
Mass loss % Calculated 18.67 37.35 20.21 3.37 35.96 37.42 20.56 20.56 22.26
Figure 3. The TG, DTG and DTA curves of the Cu–Ni–etim.
Figure 4. The TG, DTG and DTA curves of the Zn–Ni–etim.
Bull. Chem. Soc. Ethiop. 2016, 30(2)
Mass loss %
Residue
Found Calculated Found 16.29 35.17 19.76 29.96 28.78 CuO+NiO 2.95 33.05 35.13 29.19 28.42 ZnO+NiO 19.92 19.64 20.81 43.45 42.08 CdO+NiO
Syntheses of cyanide-bridged heteronuclear polymeric complexes with 2-ethylimidazole
271
Figure 5. The TG, DTG and DTA curves of the Cd–Ni–etim. CONCLUSION In this study, we synthesized the three new heteronuclear polymeric complexes, [Cu(etim)3Ni(CN)4] n, {[Zn(etim)3Ni(CN)4]∙H2O}n and [Cd(etim)2Ni(CN)4]n.We investigated these complexes using vibration (FT-IR and Raman) spectroscopy, thermal and elemental analyses techniques. On the basis of the spectroscopic results, we suggest that the polymeric structures of the Cu–Ni–etim and the Zn–Ni–etim complexes consist of 1D coordination polymer, while the Cd–Ni–etim complex presents a 2D network. The Ni(II) ion is four coordinate with four cyanide-carbon atoms in a square-planar geometry. Furthermore, the Cu(II) and Zn(II) ions are five coordinate with the three etim ligands and the two bridging cyanide groups, whereas the Cd(II) ion is six coordinate with the two etim ligands and the four bridging cyanide groups. We also showed that thermal analyses of the complexes support the spectroscopic results. ACKNOWLEDGEMENT This paper is dedicated to Prof. Dr. Ziya Kantarci, who died on January, 2012. REFERENCES 1. Sharpe, A.G. The Chemistry of Cyano Complexes of the Transition Metals, Academic Press: London; 1976. 2. Hofmann, K.A.; Küspert, F. Z. Anorg. Allgem. Chem. 1897, 15, 204. 3. Cernak, J.; Orendac, M.; Potocnak, I.; Chomic, J.; Orendacova, A.; Skorsepa, J.; Feher, A. Coord. Chem. Rev. 2002, 224, 51. 4. Sopková, A.; Reháková, M.; Šály, V. J. Incl. Phenom. 1989, 7, 401. 5. Kämper, M.; Wagner, M.; Weiß, A. Angew. Chem. 1979, 91, 517. 6. Lescouëzec, R.; Vaissermann, J.; Ruiz‐Pérez, C.; Lloret, F.; Carrasco, R.; Julve, M.; Verdaguer, M.; Dromzee, Y.; Gatteschi, D.; Wernsdorfer, W. Angew. Chem. Int. Ed. 2003, 42, 1483. 7. Şenyel, M.; Sertbakan, T.R.; Kürkçüoğlu, G.S.; Kasap, E.; Kantarcı, Z. J. Inc. Phenom. Macroc. 2001, 39, 175. Bull. Chem. Soc. Ethiop. 2016, 30(2)
272
Dursun Karaağaç and Güneş Süheyla Kürkçüoğlu
8. Iwamoto, T. J. Incl. Phenom. 1996, 24, 61. 9. Ohba, M.; Okawa, H. Coord. Chem. Rev. 2000, 198, 313. 10. Verdaguer, M.; Bleuzen, A.; Marvaud, V.; Vaissermann, J.; Seuleiman, M.; Desplanches, C.; Scuiller, A.; Train, C.; Garde, R.; Gelly, G. Coord. Chem. Rev. 1999, 190, 1023. 11. Blom, N.; Ludi, A.; Burgi, H.B.; Tichy, K. Acta Crystallogr. C 1984, 40, 1767. 12. Rosenzweig, A.; Cromer, D.T. Acta Crystallogr. 1959, 12, 709. 13. Hussain, M.S.; Al-Arfaj, A.; Naseem Akhtar, M.; Isab, A.A. Polyhedron 1996, 15, 2781. 14. Iwamoto, T. in Inclusion Compounds, Vol. 5, Atwood, J.L.; Davies, J.E.D.; MacNicol D.D. (Eds.), Oxford University Press: Oxford; 1991; chapter 6. 15. Kürkçüoğlu, G.S.; Yeşilel, O.Z.; Çaylı, İ.; Büyükgüngör, O. J. Inorg. Organomet. Polym. 2011, 21, 306. 16. Çaylı, İ.; Kürkçüoğlu, G.S.; Yeşilel, O.Z.; Şahin, O.; Büyükgüngör, O. Polyhedron 2011, 31, 386. 17. Kürkçüoğlu, G.S.; Gör, K.; Büyükgüngör, O. Spectrochim. Acta A 2014, 124, 588. 18. Kurkçüoğlu, G.S.; Yeşilel, O.Z:; Kavlak, İ.; Kurtaran, S.; Büyükgüngör, O. J. Inorg. Organomet. Polym. 2009, 19, 314 19. Çetinkaya, F.; Kürkçüoğlu, G.S.; Yeşilel, O.Z.; Hökelek, T.; Dal, H. Polyhedron 2012, 47, 126. 20. Arivazhagan, M.; Manivel, S.; Jeyavijayan, S.; Meenakshi, R. Spectrochim. Acta A 2015, 134, 493. 21. Kürkçüoğlu, G.S.; Yeşilel, O.Z.; Kavlak, İ.; Büyükgüngör, O. J. Inorg. Organomet. Polym. 2009, 19, 539. 22. McCullough, R.; Jones, L.; Crosby, G. Spectrochim. Acta 1960, 16, 929. 23. Kazuo, N. Infrared and Raman Spectra of Inorganic and Coordination Compounds. Vol. 1, John Wiley and Sons: New York; 1986, p 978. 24. Karaağaç, D.; Kürkçüoğlu, G.S. Bull. Chem. Soc. Ethiop. 2015, 29, 415.
Bull. Chem. Soc. Ethiop. 2016, 30(2)