Synthesis of a series of poly (methylmethacrylate)-graft-poly (styrene) polymer was carried out via ...... 22Na radioisotope and the annihilation γ-ray (0.511MeV).
Synthesis and characterization of comb-polymers with controlled structure
By
Wael Elhrari
Thesis presented in partial fulfillment of the requirement for the degree of Master of Science (Polymer Science) at the
University of Stellenbosch
Promoter: Dr. P. E. Mallon
Stellenbosch December 2006
DECLARATION
I, the undersigned hereby declare that the work contained in this thesis is my own original work and has not previously, in its entirety or in part, been submitted at any university for a degree.
_______________________
WKS Elhrari
_____________________
Date
إهﺪاء
إﻟﻰ أﻣﻰ وأﺑﻰ وإﺧﻮﺗﻰ
I dedicate this thesis to my mother and father, who were the reason of my being here and for their praying, to my brothers and sisters for their support, and my closest friends
Abstract Synthesis of a series of poly (methylmethacrylate)-graft-poly (styrene) polymer was carried out via free radical polymerization of methylmethacrylate and polystyrene macromonomers.
The
macromonomers
were
synthesized
via
living
anionic
polymerization techniques. Two series of macromonomers where synthesized with different polymerizable end group functionalities, by termination with p-vinyl benzyl chloride and 3-(dimethyl chloro silyl) propyl methacrylate. The branch density was varied by controlling the composition feed ratio of the macromonomers to comonomer. Liquid chromatographic techniques were used to fully characterize the chemical composition and branch distributions of the graft polymer. Liquid chromatography under critical conditions of adsorption of styrene coupling with Fourier Transform Infrared Spectra was used to investigate the chemical composition and distribution of the branches in the graft. Physical properties of the graft copolymers such as Tg and free volume were determined using differential scanning calorimetry and positron lifetime spectrometry respectively. The relationship between the chemical composition and the graft copolymer properties such as Tg and free volume were investigated. The results show that for long chain macromonomers phase segregation occurs in the graft copolymers. In the case of shorter chain macromonomers at low content no phase segregation is observed and the macromonomers have an antiplasticization effect on the graft polymers.
Acknowledgments
I would like to extend my thanks to Dr. P. E. Mallon who has been a determined guide and consultant throughout my study.
I would also like to thank the Libyan International Center for Macromolecular Chemistry and Technology Tripoli for their constant financial support and giving me the opportunity to study in this field.
I would also like to thank Prof. Y. C. Jean from the University of Missouri-Kansas City for giving us access to perform the positron annihilation lifetime measurements.
I would like to thank the Institute of Polymer Science at the University of Stellenbosch who welcome me and provide me with the opportunity to further my studies. I feel very fortunate to have attended lectures and conferences with the extraordinary department.
I would especially like to thank those who I spent my hours with in the lab 134, Abd Almonam, Elana, Elbuzedi, Gareth, Morné, and Sweed, Also many thanks to my friends and colleagues for their support and encouragement.
I would like to thank Dr. M. J. Hurndall, who assisted me with the corrections of the thesis.
I would like to express my profound regards to Jeanette and Uhan Groenewald for their warmth hospitality.
I would also like to extend my gratitude to my parents for their guidance and unwavering support throughout my life. They were behind me at every step in my life, even when I didn’t really know where I was going and helped to show me where I should always find my direction. I can only hope to show the same kind of dedication and love to them.
Opsomming ‘n Reeks poli(metielmetakrilaat)-ent-poli(stireen) kopolimere is gesintetiseer deur middle van vrye radikaal polimerisasie van metielmetakrilaat en polistireenmakromonomere. Anioniese polimerisasie is gebruik om twee reeks makromonomere met verskillende polimeriseerbare eindgroepe te maak deur middel van terminasie met onderskeidelik pvinielbensielchloried
en
3-(metielchlorosiliel)propielmetakrilaat.
Variasie
in
die
vertakkingsdigtheid is verkry deur die makromonomeer tot komonomeer voerverhouding te varieer. Vloeistofchromatografiese metodes is aangewend ten einde die volledige chemiese samestelling en vertakkings distribusie te bereken. Vloeistofchromatografie by die kritiese absorpsie kondisies van polistireen, gekoppel aan Fourier Transform Infrarooispektroskopie is gebruik om die chemise samestelling- en vertakkingsdistribusie in die gesintetiseerde ent-kopolimere te bepaal.
Die verwantskap tussen chemise
samestelling en fisiese eienskappe soos glasoorgangstemperatuur (Tg) en vrye volume is
bepaal
met
behulp
van
Differensiële
Skandeerkalorimetrie
en
Positron
Vernietigingsleeftydspektroskopie. Resultate dui daarop dat fasesegregasie verkry is in ent-kopolimere wat gesintetiseer is met die betrokke langkettingmakromonomeer, terwyl die afwesigheid van fasesegregasie bemerk is in alle ent-kopolimere waarvoor korter ketting makromonomere gebruik is.
Die korter ketting makromonomeer blyk ‘n
antiplastiseringseffek op die bogenoemde ent-kopolimere te hê.
Table of contents List of Acronyms........................................................................................................... iv List of Symbols.............................................................................................................. v List of Schemes............................................................................................................ vi List of Figures..............................................................................................................viii List of tables ................................................................................................................. xi
CHAPTER 1..........................................................................................................1 INTRODUCTION AND OBJECTIVES...................................................................1 1.1 Introduction ............................................................................................................. 1 1.2 Objectives ...............................................................................................................3 1.3 Thesis outline ..........................................................................................................3 1.4 References:............................................................................................................. 4
CHAPTER 2..........................................................................................................5 HISTORICAL AND THEORETICAL BACKGROUND ...........................................5 2.1 Branched polymers .................................................................................................5 2.2 Graft polymers......................................................................................................... 6 2.2.1 Introduction .................................................................................................................... 6 2.2.2 Synthesis of graft copolymers........................................................................................ 7 2.2.2.1 Grafting onto........................................................................................................... 8 2.2.2.2 Grafting from......................................................................................................... 10 2.2.2.3 Grafting through.................................................................................................... 11
2.3 Free radical polymerization ................................................................................... 15 2.3.1 Free radical copolymerization...................................................................................... 15
2.4 Anionic polymerization .......................................................................................... 17 2.4.1 Initiation of anionic polymerization............................................................................... 18 2.4.2 Propagation.................................................................................................................. 20 2.4.3 Termination .................................................................................................................. 21
2.5 Properties of branched polymers .......................................................................... 22 2.6 Free volume .......................................................................................................... 24 2.7 Application of positron annihilation techniques to study polymers ........................ 26 2.8 References:........................................................................................................... 29
i
CHAPTER 3........................................................................................................34 SYNTHESIS AND CHARACTERIZATION OF MACROMONOMERS AND GRAFTS .............................................................................................................34 3.1 Synthesis...............................................................................................................34 3.1.1 Materials ...................................................................................................................... 34 3.1.2 Purification of the monomers ....................................................................................... 34 3.1.3 Purification of the solvents........................................................................................... 35
3.2 Anionic polymerization of styrene ......................................................................... 35 3.2.1 Monomer conversion ................................................................................................... 35 3.2.2 Synthesis of styrene macromonomers ........................................................................ 36 3.2.3 Copolymerization reaction “graft formation” ................................................................ 37
3.3 Characterization ....................................................................................................39 3.3.1 Size exclusion chromatography (SEC) ........................................................................ 39 3.3.2 Nuclear magnetic resonance (NMR) spectroscopy ..................................................... 40 3.3.3 Fourier-transform infrared (FTIR) spectroscopy .......................................................... 40 3.3.4 Light scattering............................................................................................................. 40 3.3.4.1 SEC-MALLS.............................................................................................................. 41 3.3.5 LC-transform ................................................................................................................ 42 3.3.6 Liquid chromatography under critical conditions (LCCC) ............................................ 44 3.3.7 Differential scanning calorimetry (DSC)....................................................................... 44 3.3.8 Lifetime spectrometry................................................................................................... 45
3.4 References:...........................................................................................................47
CHAPTER 4........................................................................................................49 RESULTS AND DISCUSSION ...........................................................................49 4.1 Determination of conversion versus time for the functional termination of polystyrene macromonomers...................................................................................... 49 4.2 Synthesis of macromonomers............................................................................... 51 4.2.1 Synthesis of (p-vinylbenzyl) polystyrene macromonomer ........................................... 51 4.2.2 Synthesis of (methacryloxypropyl) polystyrene macromonomer................................. 54
4.3 Characterization of the macromonomers .............................................................. 55 4.4 Graft formation ......................................................................................................58 4.4.1 Extraction of the unreacted macromonomer ............................................................... 60
4.5 Polymacromonomer-polystyrene .......................................................................... 61 4.6 Styrene graft styrene macromonomer................................................................... 62
ii
4.7 Characterization of (MMA-g-PS) graft copolymers after extraction....................... 63 4.7.1 SEC analysis................................................................................................................ 63 4.7.2 FTIR analysis ............................................................................................................... 64 4.7.3 1H-NMR analysis.......................................................................................................... 67 4.7.4 Determination of molecular mass and graft density of polymer .................................. 71
4.8 Chromatographic analysis of graft copolymers ..................................................... 77 4.8.1 Critical point of adsorption of styrene .......................................................................... 77 4.8.2 LC-transform analysis (chemical compositions as a function of molar mass)............. 80
4.9 Thermal analysis of graft copolymer (DSC) .......................................................... 84 4.10 Positron lifetime................................................................................................... 87 4.11 References.......................................................................................................... 96
CHAPTER 5........................................................................................................98 CONCLUSIONS AND RECOMMENDATION .....................................................98 5.1 Conclusions...........................................................................................................98 5.2 Recommendation ................................................................................................100
iii
List of Acronyms ABS ACN AFM AIBN ATRP CF DIFF DISC CDCl3 DMPA DSC ELSD FT-IR 1 H-NMR HIPS HPLC IUPAC LALS LCCC LC-FTIR LDA LDPE KOH MALLS MMA MCA MMD n-BuLi Ni PA PAL PBd PC PCL PCL-PS-g-PEO PDI PE PEO PI PM PMMA PSDMPA PSVB PVC P2VPs-g-PI RI SEC SEM Sec-BuLi SFRP SMS STM Sty TAC TEM THF
Acrylonitrile-butadiene-styrene Acetonitrile Atomic force microscopy 2,2’-azobis(isobutyronitrile) Atom transfer radical polymerization Constant fraction differential discriminator Deuterated chloroform Dimethyl silyl propyl methacrylate Differential scanning calorimetry Evaporative laser light scattering detector Fourier-transform infrared spectroscopy Proton Nuclear magnetic resonance spectroscopy High-impact polystyrene High performance liquid chromatography International union of pure and applied chemistry Low angle light scattering Liquid chromatography under critical conditions Liquid chromatography Fourier-transform infrared spectroscopy Lithium diisopropylamide Low density polyethylene Potassium hydroxide Multi-angle laser light scattering Methyl methacrylate Multichannel analyzer Molecular mass distribution linear butyl lithium Nickel Polyamide Positron annihilation lifetime spectroscopy Polybutadiene Polycarbonate Poly(ε-caprolactone) Poly(ε-caprolactone)-styrene-g-poly(ethyleneoxide) Polydisparity Polyethylene Polyethyleneoxide Polyisoprene Photomultiplier tube Polymethylmethacrylate Polystyrene Dimethyl silyl propyl methacrylate terminated Polystyrene vinyl benzyl terminated Polyvinylchloride Poly(2-vinylpyridine)-graft-polyisoprene Refractive index Size exclusion chromatography Scanning electron microscopy Sec-butyl lithium Stable free-radical mediated polymerization 4-[(trimethylsilyl) methyl] styrene Scanning tunneling microscopy Styrene Time to amplitude converter Transmission electron microscopy Tetrahydrofuran
iv
TMEDA UV VB
N,N,N’,N’-tetramthylethylenediamine Ultraviolet Vinyl benzyl
List of Symbols kt kp rA. rB [A], [B] Rp Rt kd f [I]
DPno x XLi Mn Mw Me Ngraft N g b L Tg G` Mc
η
v vf a(T) WLF f(T) fg Bf,M o-Ps p-Ps Ps 22 Na
τ1 τ2 τ3
R Ro ΔR I3 C Rθ dn/dc n NA K*
Rate constant of termination Rate constant of propagation Reactivity ratios of monomer and macromonomer respectively Concentration of monomer and macromonomer respectively Rate of propagation Rate of termination Rate constants of initiator decomposition Rate constant of initiation efficiency Initiator concentration Number-average degree of polymerization Fraction of disproportionation in termination Alkyllithium Number average molecular weight Weight average molecular weight Average molecular mass between nearest-neighbor branch points Average number of branches Average number of the graft chains per backbone chain Branching factor Mean-square radius of gyration of the branched polymer Mean-square radius of gyration of the linear polymer Glass transition temperature Storage modulus Molecular weight of backbone between branched point Viscosity Specific volume Free volume Time and temperature shift factor Williams, Landel and Ferry equation Free volume fraction Fraction of free volume at Tg Coefficients of free volume Ortho positronium Para positronium Positronium Sodium 22-isotope Lifetime of para positronium Lifetime of self-annihilation of positron Lifetime of ortho positronium Hole radius Infinite spherical potential radius Empirical parameter Total fraction of o-Ps formed in the polymer Mean hole volume Empirical scaling constant Excess intensity of scattered light at angle θ Refractive index increment Refractive index Avogadro’s number Optical parameter
v
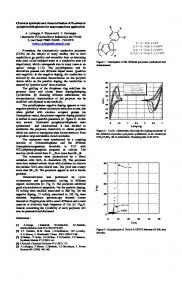
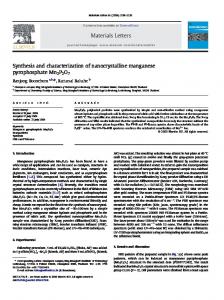
List of Schemes Chapter 2 Scheme 2.1 Different types of branched polymers: (I) hyper-branched, (II) comb or graft, (III) star and (IV) network polymers. .......................................................................... 5 Scheme 2.2 Simple structure of a graft copolymer. .......................................................... 6 Scheme 2.3 Three methods used to synthesize graft polymers: grafting onto, grafting from and grafting through. ......................................................................................... 8 Scheme 2.4 Examples of different functional groups that can be used in grafting polymers:...................................................................................................................9 Scheme 2.5 Synthesis of comb-branched polystyrene using the grafting onto method. .. 9 Scheme 2.6 Synthesis of polyisoprene-graft-polystyrene using the grafting from method. ................................................................................................................................ 10 Scheme 2.7 Synthesis of comb-branched polystyrenes using the grafting through route. ................................................................................................................................ 12 Scheme 2.8 Synthesis of a graft copolymer using stable free-radical mediated polymerization and the grafting through technique. ................................................ 12 Scheme 2.9 Capping reaction; ω-carbanionic polystyrene with p-vinylphenyldimethylchlorosilane. ............................................................................................................ 13 Scheme 2.10 Direct coupling reaction of polystyryllithium with an excess of p-vinylbenzyl chloride.................................................................................................................... 14 Scheme 2.11 Macromonomer having an end function and a side-chain functions......... 15 Scheme 2. 12 Charge delocalization in styrene, which gives high stability in anionic polymerization. ........................................................................................................17 Scheme 2. 13 Charge delocalization in acrylates, which gives low stability and leads to side reactions in anionic polymerization.................................................................. 18 Scheme 2. 14 Side reactions that take place with the initiation of acrylate (R=H) and methacrylate (R= CH3) monomers by an alkyllithium (XLi). .................................... 18 Scheme 2. 15 Electron transfer reaction between sodium and naphthalene.................. 19 Scheme 2. 16 (I) Tetramer structure of sec-butyl lithium, (II) hexametric structure of nbutyl lithium. ............................................................................................................20 Scheme 2. 17 An example of the use of linking agents for the synthesis of mixed star arm (Miktoarm) polymers. ....................................................................................... 22
vi
Chapter 3 Scheme 3.1 Examples of synthesis of macromonomers via anionic polymerization: (a) pvinyl benzyl polystyrene macromonomer (b) methacryloxyproply polystyrene macromonomer. ...................................................................................................... 37 Scheme 3.2 Further examples of copolymerization reactions to synthesize graft copolymers via macromonomer techniques: (a) methylmetacrylate-graftmethacryloxypropyl-styrene macromonomer, (b) methylmetacrylate-graft-p-vinyl benzyl-styrene macromonomer............................................................................... 38
Chapter 4 Scheme 4.1 Mechanism of one electron transfer for formation of dimmer ..................... 52 Scheme 4.2 Illustration of “double macromonomer” graft on the PMMA backbone, yielding double combs.............................................................................................53
vii
List of Figures Chapter 3 Figure 3.1 Solvent purification setup............................................................................... 35 Figure 3.2 Glassware used for the preparation of vinyl benzyl terminated macromonomer. ...................................................................................................... 36 Figure 3.3 LC-transform unit showing collection disc and optic module ......................... 43 Figure 3.4 Standard positron lifetime set-up: PM TUBE, photomultiplier tube, CF DIFF DISC, constant fraction differential discriminator, DELAY, delay box fixed length of 50 Ω cable, TAC, time-to-amplitude converter, MCA, multichannel analyzer......... 46
Chapter 4 Figure 4.1 Monomer conversions versus time for anionic polymerization of styrene...... 49 Figure 4.2 Molar mass distribution of styrene conversion............................................... 50 Figure 4.3 Molar mass distributions of the chain extension of the anionic polymerization of styrene, Mn= 4472 and 7109 before and after extension. ................................... 51 Figure 4.4 SEC traces of styrene macromonomer terminated by VB (detectors response normalized) (a) bimodal styrene macromonomer, (b) mono-modal styrene macromonomer. ...................................................................................................... 52 Figure 4.5 SEC traces of styrene macromonomer terminated by DMPA (detectors, response normalized).............................................................................................. 54 Figure 4.6 1H-NMR spectrum in CDCl3 of styrene macromonomer terminated by p-vinyl benzyl chloride. .......................................................................................................56 Figure 4.7 1H-NMR spectrum in CDCl3 of styrene macromonomer terminated by 3(dimethyl chloro siliy) propyl methacrylate. ............................................................. 56 Figure 4.8 FTIR spectrum of styrene macromonomer PSDMPA........................................ 57 Figure 4.9 SEC traces of un-extracted graft copolymer MMA-g-PSDMPA (10 wt %).( Note: RI and UV detector response have been normalized) ............................................ 60 Figure 4.10 SEC trace (RI detector) showing the efficiency of the extraction procedure. ................................................................................................................................ 61 Figure 4.11 SEC traces of polymacromonomer and macromonomer (a) free radical polymerization, macromonomer is MD3. (b) Anionic polymerization. ..................... 62 Figure 4.12 SEC traces of PS-g-PS (5 wt% macromonomer) graft polymer and unreacted macromonomer. ..................................................................................... 63
viii
Figure 4.13 An example of SEC traces of graft copolymer (styrene macromonomer terminated via VB (10 wt %)) illustrating the styrene distribution. ........................... 64 Figure 4.14 FTIR spectra of (a) styrene macromonomer terminated by p-vinyl benzyl chloride and graft copolymer MMA-g-PS (b) styrene macromonomer terminated by 3-(dimethyl chloro siliy) propyl methacrylate and graft copolymer MMA-g-PS........ 65 Figure 4.15 1H-NMR spectrum in CDCl3 of extracted graft copolymer (PMMA-g-PSDMPA terminated). .............................................................................................................68 Figure 4.16 1H-NMR spectrum of extracted styrene macromonomer from the PMMA-gPSDMPA graft copolymer. ..........................................................................................68 Figure 4.17 Illustration of the difference between groups in grafts (a) PMMA-g-PSVB, and (b) PMMA-g-PSDMPA. ............................................................................................... 70 Figure 4.18 1H-NMR spectra shown the specific peaks of Si-CH2 and CH2-O-, for PMMAg-PSDPMA..................................................................................................................70 Figure 4.19 Effect of the molar mass of the macromonomer on the molar mass of the graft and concentration of the macromonomer in the feed...................................... 75 Figure 4.20 Determination of critical conditions for polystyrene by varying solvent composition. ............................................................................................................ 78 Figure 4.21 Chromatogram representing the critical point of adsorption for polystyrene standard. .................................................................................................................78 Figure 4.22 Typical example of critical point of MMA-g-PS under critical conditions...... 79 Figure 4.23 Chromatogram represents the elution of different graft copolymers at the critical point of adsorption for polystyrene. .............................................................. 80 Figure 4.24 Waterfall diagram obtained from the 2D separation of SEC LC-transform with FTIR detection of graft copolymer PMMA-g-PS 10% macromonomer content. ................................................................................................................................ 81 Figure 4.25 Chromatogram represent Gram-Schmidt of graft copolymer 10 wt % VB terminated macromonomer content. ....................................................................... 82 Figure 4.26 Chromatogram representation of the Gram-Schmidt of two series of graft copolymers having macromonomer terminated via DMPA (a,b) (50,10 wt% respectively) , graft copolymers have macromonomer terminated via VB (c,d) (50, 10 wt% respectively). .............................................................................................. 83 Figure 4.27 Relationship between macromonomer content and Tg of graft copolymers with short branches. ................................................................................................86
ix
Figure 4.28 A typical Positron lifetime spectra PALS of synthesized graft copolymer PMMA-g-PS with three different decays decomposing Ps lifetimes fitted using PATFIT. ...................................................................................................................87 Figure 4.29 o-Ps lifetime τ3 in graft copolymer PMMA-g-PS as function of macromonomer content (wt %) and radius of free volume holes. ........................... 88 Figure 4.30 o-Ps intensity I3 in graft copolymer PMMA-g-PS as function of macromonomer content (wt %) and branch length. ................................................ 90 Figure 4.31 Hole size distribution curves (determined using the MELT program) for the graft copolymers a) PMMA-g-PSDMPA, b) PMMA-g-PSVB with various macromonomers content. ....................................................................................... 91 Figure 4.32 FWHM vs. macromonomer content of graft copolymer ............................... 92 Figure 4.33 FWHM vs. styrene content determined via NMR in the graft copolymer ..... 92 Figure 4.34 Illustrate the relationship between glass transition temperature Tg with o-Ps lifetime τ3 and macromonomer content of graft copolymers (a) methacryloxyproply terminated macromonomer, (b) vinyl benzene terminated macromonomer............ 93 Figure 4.35 Illustrate the relationship between glass transition temperature Tg with fractional free volume ffv and macromonomer content of graft copolymers (a) methacryloxyproply terminated macromonomer, (b) vinyl benzene terminated macromonomer. ...................................................................................................... 93 Figure 4.36 Illustrate the relationship between glass transition temperature Tg with o-Ps lifetime τ3 of graft copolymers (a) vinyl benzene terminated macromonomer, (b) methacryloxyproply terminated macromonomer ..................................................... 94 Figure 4.37 Illustrate the relationship between glass transition temperature Tg with fractional free volume ffv of graft copolymers (a) methacryloxyproply terminated macromonomer, (b) vinyl benzene terminated macromonomer.............................. 95
x
List of tables Chapter 4 Table 4.1 Compositions and characteristics of the productions of the anionic polymerizations of PSVB macromonomers prepared using n-butyllithium as initiator and p-vinylbenzyl chloride as terminating agent ..................................................... 53 Table 4.2 Anionic polymerization compositions and characteristics for the synthesis of PSDMPA macromonomers using n-butyllithium as initiator and 3-(dimethyl chloro siliy) propyl methacrylate as terminating agent ............................................................... 55 Table 4.3 FTIR data of the functional groups of styrene macromonomers terminated by DMPA ......................................................................................................................58 Table 4.4 Formulation and characterization of graft copolymers .................................... 59 Table 4.5 Molar masses of macromonomers and formed polymacromonomer via free radical and anionic polymerizations ........................................................................ 62 Table 4.6 IR absorption data for graft copolymer MMA-g-PS-VB ................................... 66 Table 4.7 IR absorption data for graft copolymer MMA-g-PS-DMPA.............................. 66 Table 4.8 Chemical compositions of graft copolymers PMMA-g-PS determined using 1HNMR ........................................................................................................................69 Table 4.9 The average number of the graft chains per backbone chain (N) and Average molecular mass between nearest-neighbor branch points (Me) estimated via equation 4.5. ........................................................................................................... 73 Table 4.10 Molar mass and molar mass distribution of graft copolymers PMMA-g-PS and their macromonomers ............................................................................................. 74 Table 4.11 The number average molar mass and weight average molar mass of the graft copolymers obtained via SEC- MALLS. .................................................................. 76 Table 4.12 Glass transition temperature of graft copolymers with their molar mass and molar mass of macromonomer................................................................................ 85 Table 4.13 Positron data, lifetime (τ3) relative intensity (I3) radius of free volume hole (R) free volume (fv) fractional free volume (ffv) and full width at half- maximum (FWHM) ................................................................................................................................ 89
xi
Chapter 1: Introduction and Objectives
Chapter 1 Introduction and Objectives
1.1 Introduction The ability to produce polymers with well defined and controlled structures has allowed the study of the structure property relationships in polymer materials. An understanding of this relationship is essential in predicting polymer properties and in designing materials with new properties. Branched polymers are a useful structure that can be used successfully to adapt the processing characteristics and properties of polymers. Branched polymers are distinguished by the presence of the branch points as well as the presence of more than two chain end groups per molecule. The presences of these branches affect various properties such as crystallinity, glass transition temperature, viscoelastic properties, and viscosities of the polymers.
It is, however, difficult to predict the relationships between degree of branching and properties based on the behaviour of most branched polymers, because the branching reaction generally occurs in a random mode. Essential understanding of the effects of chain branching on polymer properties requires the availability of a variety of branched polymers with well-defined structures and low degree of compositional heterogeneity.
Living polymerization is considered the best technique for the synthesis of polymers with predictable structures. In living polymerization including anionic, cationic, and even radical mechanisms, greater control can be obtained over the polymer structure. Living anionic polymerization is very versatile for the synthesis of well-defined polymers with precisely controlled molecular structure and molecular weight [1] as well as functionalities [2]. Introduction of polymerizable end groups into a polymer chain can be rather easily achieved by anionic polymerization techniques. Functional initiation or electrophilic termination are the main ways to include the active groups [3, 4]. These types of polymers with precisely controlled
functionality can be used as
1
Chapter 1: Introduction and Objectives
macromonomers [5], which can undergo further reactions in order to produce branch polymers. The most important kind of branched polymer are graft copolymers, which contain polymer units that are incorporated as side chains onto a backbone polymer chain. Graft copolymers are generally prepared by three general methods the grafting-onto, graftingfrom, and macromonomer techniques [3, 6]. The “grafting onto” method involves a coupling reaction between the backbone and the branches, which are prepared separately by a living polymerization mechanisms [7]. Functional groups are distributed along the chain backbone, which can react with the living branches. In the “grafting from” method, active sites are required along the main chain backbone that are able to initiate the polymerization of the second monomer which results in the formation of branches and the final graft copolymer. In the macromonomer method, polymer chain having polymerizable end group known as “macromonomers” are copolymerized with another monomer in order to produce the graft copolymer [5]. The macromonomer technique can be regarded to give access to well-defined branched polymers, at least in the sense of the chain length. Also the composition of the backbone to branch may be controlled in principle by the copolymerization.
The graft polymers can contain various branch architectures, such as linear or branched chains. The variety in the structure and nature of graft units, along with that of the backbone, provides opportunity for tailoring the properties of graft copolymers and producing special and advanced materials. For instance, glass transition temperature and free volume of the graft vary with branch density and length. The relationship between the free volume and the branching density and length for polyolefin copolymers was investigated by Dlubek et al. [8] using differential scanning calorimetric and positron lifetime. In the present work the poly (methylmethacrylate)-graft-polystyrene copolymers were prepared using the macromonomer technique. The relationship between the free volume and the branching density and branches length was investigated, where the branch density was varied by free radical copolymerization with the co-monomers corresponding to the polymerizable end group of the macromonomer and branches length were controlled by using anionic polymerization technique.
2
Chapter 1: Introduction and Objectives
1.2 Objectives The objectives of this project were: •
To synthesize styrene macromonomers terminated with two different terminating agents p-vinyl benzyl chloride and 3-(dimethyl chloro silyl) propyl methacrylate and different molar mass using anionic polymerization technique.
•
To synthesize graft copolymers of methylmethacrylate graft styrene free radically using the macromonomer technique.
•
To study the difference between the graft copolymers produced using macromonomers with the two different polymerizable end groups.
•
Develop and investigate various liquid chromatography techniques to fully characterize the chemical composition and branch distributions of the graft polymer.
•
Finally, to investigate the relationship between the chemical composition and the graft copolymer properties such as Tg and free volume as well as morphology in term of phase segregation.
1.3 Thesis outline Since graft copolymers are a class of branched polymers, the historical and theoretical background (chapter 2) information provided in this thesis first identifies the different families of branch polymers. The synthesis of graft copolymers is highlighted, and then a summary of these methods is provided, including some examples, followed by the properties of the branch polymers and how these are different from the linear polymers, using Tg and free volume as an example. The application of positron annihilation techniques to study polymers is also included in this chapter. Chapter 3, the experimental part of the thesis, describes the synthesis of the macromonomer and the graft copolymers. The characterization techniques used in the project are highlighted in this chapter. The obtained results for macromonomers and graft copolymers were discussed in Chapter 4. Finally a conclusion is drawn from the obtained results and suggestions for future research are given in chapter 5.
3
Chapter 1: Introduction and Objectives
1.4 References: 1.
F. Welch. Journal of the American Chemical Society. 1959, 81, 1345.
2.
J. E. McGrath. Preface. Anionic polymerizarion kinetis, mechanisms, and synthesis. J. E. McGrath. Eds. 1981, American Chemical Society: Washington, D. C. xi.
3.
M. Pitsikalis, S. Pispas, J. Mays, N. Hadjichristidis. Advances in Polymer Science. 1998, 135, 1.
4.
N. Hadjichrisridis, H. Latrou, S. Pispas, M. Pitsikalis. Current Organic Chemistry. 2002, 6, 155.
5.
K. Ito. Progress in Polymer Science. 1998, 23, 581.
6.
N. Hadjichristidis, M. Pitsikalis, S. Pispas, H. Iatrou. Chemical Review 2001, 101, 3747.
7.
Z. Yousi, L. Donghai, D. Lizong, Z. Jinghui. Polymer. 1998, 39, 2665.
8.
G. Dlubek, D. Bamford, A. Rodriguez-gonzalez, S. Bornemann, J. Stejny, B. Schade, M. A. Alam, M. Arnold. Polymer Physics. 2002, 40, 434.
4
Chapter 2: Historical and theoretical background
Chapter 2 Historical and theoretical background 2.1 Branched polymers Branching in polymers is a useful structural variable that can be used to modify the processing characteristics and properties of polymers. Branching affects the crystallinity, crystalline melting point, glass transition temperature, physical properties [1], viscoelastic properties, solution viscosities, and melt viscosities of polymers. A branched polymer comprises molecules with more than one backbone chain; it is a nonlinear polymer. Different techniques have been used to synthesize branched polymers, including freeradical, condensation, and ionic polymerization techniques. These techniques lead to various different types of branched polymers, as shown in Scheme 2.1.
(I)
(II)
(III)
(IV)
Scheme 2.1 Different types of branched polymers: (I) hyper-branched, (II) comb or graft, (III) star and (IV) network polymers.
For example, random branched polymers or hyper-branched polymers can be synthesized via free-radical polymerization, the best example of which is low-density polyethylene (LDPE). Network polymers are highly branched macromolecules in which, essentially, each segment is connected to another. These can be synthesized by free radical, ionic, or condensation polymerization. In the case of crosslinked polyisoprene rubber chains segments may be connected to each other by sulfur bridges. Star
5
Chapter 2: Historical and theoretical background
polymers are branched polymers consisting of several linear chains liked to a central core [2]. A graft polymer consists of a main polymer chain with one or more species of blocks attached, as side chains, to the main chain. The side chains have different configuration features to the main chain.
2.2 Graft polymers 2.2.1 Introduction Grafting of polymers is a common technique by which to modify the chemical and physical properties of polymers [3]. Graft copolymers consist of two different types of polymer, which are usually incompatible or immiscible. The incompatibility between the main chain and the branch makes graft polymers similar to polymer blends, but in the case of graft polymers the immiscible phases are joined by covalent bonds. These micro-phase separations can exhibit remarkable thermal and mechanical properties, and applications. Graft polymers can be used as surfactants, compatibilization agents in polymer blends, additives in high-impact materials, adhesives, thermoplastic elastomers [3] and pigment dispersants [4] They exhibit enhanced tensile strength, improved metal adhesion, controlled wettability, and surface modification [5]. The simplest case of a graft copolymer is illustrated by the structure below:
-AAAAAAXAAAAAAB B B B B B B Scheme 2.2 Simple structure of a graft copolymer.
where the A sequence is referred to as the main chain, the B sequence is referred to as the branch or side chain, and X is the unit to which the graft is attached [6]. According to international union of pure and applied chemistry nomenclature IUPAC [7] the name of the backbone polymer should be given first and the name of the grafts second; for
6
Chapter 2: Historical and theoretical background
example, in polybutadiene-graft-polystyrene, polybutadiene is the backbone while polystyrene is the graft.
2.2.2 Synthesis of graft copolymers Free-radical polymerization is the oldest method used for the synthesis of graft polymers. It involves radical chain transfer and addition reactions of the polymerizing monomer to the polymer backbone. This process is used to synthesize high-impact polystyrene (HIPS), acrylonitrile-butadiene-styrene (ABS) and other commercial, multiphase polymeric materials. Free-radical polymerization, however, usually gives heterogeneous materials that are difficult to characterize [7]. Ionic polymerization is a ‘living system’ which allows better control over the synthesis of polymers, leading to products with predictable molecular weights and nearly monodisperse distributions of molecular weight [3, 8-11]. Using this technique, greater control of polymer branch length can be obtained. Three synthetic techniques have been used to obtain graft or comb-polymers [12], as outlined in Scheme 2.3.
7
Chapter 2: Historical and theoretical background
Backbone Grafting onto
Active site Macromonomer
Functional group in macromonomer
Graft copolymer
Backbone Grafting from
Graft copolymer
Monomers
Grafting through
Monomers
Graft copolymer
Macromonomers
Scheme 2.3 Three methods used to synthesize graft polymers: grafting onto, grafting from and grafting through.
2.2.2.1 Grafting onto In the “grafting onto” method, the backbone and branches are prepared separately. The backbone has functional groups distributed along the chain, and these functional groups can undergo reaction with the preformed polymer. A reaction takes place after mixing two polymers under suitable experimental conditions. The number of functional groups along the main chain determines the number of branches on the backbone. The molecular weight and polydispersity of the produced polymer can be controlled by using an anionic polymerization mechanism or other controlled polymerization techniques [2, 13]. The branching sites can be introduced into the backbone either by post-polymerization reactions or by copolymerization of the main backbone monomer(s) with a suitable comonomer containing the desired functional group.
8
Chapter 2: Historical and theoretical background
Branches of graft copolymers are commonly synthesized by anionic polymerization. Backbones with electrophilic functionalities such as anhydrides (V), esters, pyridine (VI), and benzylic halide (VII) groups are used, as shown in Scheme 2.4 [2, 14, 15]. Alkyllithium
+
O O
n
m
O
O O
O
PSLi
O
n
m
O
O
O
O
O OC2H5 OC2H5
OC2H5 O
O
n
HO
(V )
n
n
CH3OH
n
PI Li
N
N
P2VP-g-PI
PS-g-PS
Li
+ SP
Li PI
H
(VI)
Br
(VII)
Scheme 2.4 Examples of different functional groups that can be used in grafting polymers: (V) poly(methacrylic acid) graft polystyrene (VI) poly(2-vinylpyridine) graft polyisoprene (P2VPs-g-PI) (VII) poly(styrene) graft polystyrene [2].
It is possible to evaluate the number of grafts per chain and the average distance between two grafts along the backbone by characterizing the backbone and grafts individually, and knowing the molecular weight of each polymer, and the overall composition of the graft copolymer. The example in Scheme 2.5 below shows how the “grafting onto” technique can be used to make comb-branched polystyrenes (IX). This is done by first introducing chloro-methyl groups along a polystyrene backbone (IIX) followed by coupling with polystyryllithium. Using this approach, the grafted polymer chains are, in general, randomly distributed along the backbone of the substrate polymer. PS
PS
CH3-O-CH2Cl SnCl4 CCl4 o 0C
PS
PS
CH2Cl
PS Li
PS
PS
CH2Cl
(IIX)
PS
(IX)
PS
Scheme 2.5 Synthesis of comb-branched polystyrene using the grafting onto method.
In 2005 Jianping Deng and Wantai Yang [15] were successful in grafting a block copolymer of styrene and maleic anhydride onto low-density polyethylene film (LDPE) by
9
Chapter 2: Historical and theoretical background
using a one-step method. They injected a solution of styrene, maleic anhydride and photo-initiator between two LDPE films, and then irradiated the system with UV light. There are, however, several conditions that must be met of coupling reactions to yield well-defined graft polymers. Both the grafted polymers chains and substrate polymer must have a narrow molecular weight distribution.
2.2.2.2 Grafting from In the “grafting from” method a polymeric substrate is first functionalized to bear a number of accessible reactive groups, then these groups are activated to provide initiating sites, followed by the addition and subsequent polymerization of a monomer, resulting in the formation of branches and the final graft copolymer. The number of branches can be theoretically controlled by the number of active sites generated along the backbone [2, 16]. Grafting from can also be achieved by γ-ray irradiation of a polymer chain in the presence of a monomer, where the radical sites formed on the backbone initiate the growth of the graft. Hadjichristidis et al. [17] described the grafting of styrene monomer to rubber via anionic polymerization. Anionic centers are generated along a polyisoprene backbone (X) using N,N,N',N'-tetramethylethylenediamine (TMEDA) and sec-butyllithium (sec-BuLi). From these reactive sites (XI), the polymerization of styrene monomer (sty) is initiated, yielding a graft copolymer (XII), as illustrated in Scheme 2.6 PI
CH3
PI CH3
CH3
TMEDA
PI
CH3
Li
PI
BuLi / THF
Li
CH3
CH3
(X)
(XI) PS
PI
CH3
PS
CH3
PI
Sty
CH3
(XII)
Scheme 2.6 Synthesis of polyisoprene-graft-polystyrene using the grafting from method.
Graft copolymers have also been synthesized using controlled radical polymerization. Initially studies focused on the use of both the atom transfer radical polymerization (ATRP) technique as well as stable free-radical mediated polymerization (SFRP). Matyjaszewski et al. [18] reported the successful production of a graft polymer via ATRP polymerization.
10
Chapter 2: Historical and theoretical background
A number of synthetic limitations may, however, be encountered when using the grafting from technique. The grafted side chains are usually generated by ionic or free-radical polymerization of a suitable monomer. However, it may be difficult to obtain a macromolecule with randomly distributed reactive sites. The solubility of polymeric substrates bearing multiple charges is also limited, leading to heterogeneous reaction conditions and products with broad molecular weight distribution.
2.2.2.3 Grafting through The “grafting through” approach to the preparation of graft polymers consists of two steps [2]: First, a linear polymer bearing a terminal polymerized end group is prepared; this species is referred to as a macromonomer. Second, copolymerization of the macromonomer with a suitable co-monomer is carried out, generally by radical polymerization. Living polymerization techniques are ideally suited to the preparation of well-defined macromonomers, since they allow precise control over the molecular weight and chainend functionality. The most common methods by which to incorporate a polymerizable group at the chain end are functional initiation or reactive termination (end capping). Since the macromonomer is prepared separately, it can be fully characterized. The radical copolymerization of the macromonomer and monomers leads to the formation of the backbone. The number of branches per backbone can generally be controlled by the ratio of the molar concentration of the macromonomer to that of the co-monomer. Several other factors have to be considered, among them the copolymerization behaviour of the macromonomer and the co-monomer forming the backbone. Comb-branched polystyrenes can be achieved by first preparing a polystyrene macromonomer (XV), by deactivation of poIystyryllithium (XIII) with p-chlorovinylbenzene (XIV), as shown in Scheme 2.7. The subsequent free-radical copolymerization of the macromonomer with styrene yields the comb-branched graft polymer (XVI) [19].
11
Chapter 2: Historical and theoretical background
Li
+ Cl
+
PS
(XIII)
(XV)
Cl
(XIV) PS
AIBN
(XVI)
Scheme 2.7 Synthesis of comb-branched polystyrenes using the grafting through route.
Using
controlled
free-radical
polymerization
or
stable
free-radical
mediated
polymerization to prepare graft copolymers via the grafting through technique, Wang et al. [8, 20] reported the synthesis of poly(ε-caprolactone)-styrene-g-poly(ethyleneoxide) (PCL-PS-g-PEO). It was prepared by copolymerization between the macromonomer PEO with a styryl end group and styrene, in the presence of poly(ε-caprolactone) (PCL) with a 2,2,6,6-tetramethylpiperidinyl-1-oxy end group. See Scheme 2.8.
H[ O(CH2 )5 C ]O m
NO +
H[ O(CH2 )5 C ]O
+
NO [ (CHCH2) (CHCH2) ]
n
m
p
CH2(OCH2CH ) OCH 2 3
p
CH2(OCH2CH2)OCH3
Scheme 2.8 Synthesis of a graft copolymer using stable free-radical mediated polymerization and the grafting through technique.
a) Macromonomers The term “macromonomer” was first introduced as a trademark by a group of researchers at ICI for the development of well-known, high solids, nonaqueous dispersions [7]. Macromonomers are linear polymeric or oligomeric species that have a
12
Chapter 2: Historical and theoretical background
reactive end group and that can polymerize with themselves or with other comonomers. These reactive groups are usually an unsaturation or oxirane ring, or any functional group that undergoes free radical, ionic or condensation polymerization [7]. The interest in macromonomers arises from the fact that they provide an easy route to the synthesis of graft copolymers and star-shaped polymers [9]. The first macromonomers, bearing at their chain end an active double bound, were prepared by Greber et al. in 1962 [9]. They reacted the Grignard derivative of p-chlorostyrene with ω-chlorodimethylsiloxane oligomers and obtained polydimethylsiloxane macromonomers which had at their chain end a p-vinylphenyl group [21]. In 1978 the same authors developed two major methods by which to synthesize macromonomers. The first living anionic polymerization, where ωcarbanionic polystyrene was reacted with p-vinylphenyldimethyl-chlorosilane, later referred to as the capping reaction, is illustrated in Scheme 2.9. The second technique involved the use of unsaturated Grignard derivatives to initiate the polymerization of a vinyl monomer [21]. H2 PS C n
CH
CH3
H2C
Li +
Cl
Si
PS-CH2-CH n
Si
CH3
H3C
Scheme 2.9 Capping reaction; ω-carbanionic polystyrene with p-vinylphenyldimethylchlorosilane.
Atsushi et al. [22] synthesized a macromonomer with an anionic initiator containing an olefinic vinyl group. CH3 Si Li
n
Si(CH3)3Cl
CH3 CH3
Since then several methods have been used to synthesize macromonomers with functional end groups, including polyaddition and transformation of functional end groups [7]. Asami et al. [23] and Tsukahara et al. [24] reported that they synthesized macromonomers
composed
of
only
hydrocarbon
macromonomer,
namely
(p-
vinylbenzyl)polystyrene macromonomer, by the coupling of a polystyryllithium anion with
13
Chapter 2: Historical and theoretical background
p-chlorovinylbenzene, as outlined in the reaction in Scheme 2.10. Feast et al. [25] also successfully synthesized a macromonomer via coupled living anionic and living ringopening metathesis polymerization. Ito [26] reported on the synthesis of several types of macromonomers using anionic and free-radical polymerizations. Hadjichristidis et al. [10] synthesized end-functionalized macromonomers by using anionic polymerization; they N(CH3)2 which converted to another
used an intermediate functional group functional group
N(CH3)2CH2CH2CH2SO3 .
BuLi
PSt
CH2Cl CH2CH
Li
PSt CH2CH
CH=CH2
Scheme 2.10 Direct coupling reaction of polystyryllithium with an excess of p-vinylbenzyl chloride [23, 24].
Lizotte [27] also used stable free-radical polymerization methods to prepare macromonomers. Styrene macromonomers with diol or dicarboxyl end-groups were used in polyadditions with diisocyanate to afford PSt-graft-polyurethanes [28]. CH3
PSt
Si
CH2 CH2CHCH2 3
CH3
OHOH
Polyaddition and polycondensation can be used for the synthesis of macromonomers [29, 30]. In 1994 Nagasaki et al. [30] synthesized a new type of macromonomer with two different functional groups: a polymerizable vinyl end, and trimethylsilyl groups in the side chain. The organosilicon part was synthesized by using lithium diisopropylamide (LDA) to incorporate (lithium) metal into the styrene substituents 4-[(trimethylsilyl) methyl] styrene (SMS), then the lithium initiates isomerization polymerization as shown in Scheme 2.11
14
Chapter 2: Historical and theoretical background
CH Li
Si(CH3)3
Si(CH3)3
Si(CH3)3 +
CH2
CH
Si(CH3)3
CH n
Scheme 2.11 Macromonomer having an end function and a side-chain functions.
2.3 Free radical polymerization A free radical is basically a molecule with an unpaired electron. The tendency for this free radical to add an additional electron in order to form a pair makes it highly reactive, so that it will attack the bond on another molecule by taking off an electron, leaving that molecule with an unpaired election. Free radicals are often created by the splitting up of a molecule into two fragments along a single bond (initiator). After a reaction has been initiated, the propagation reaction takes place. The whole propagation reaction usually takes place within a fraction of a second. In this period the electron transfer and the active center down the chain proceeds until the whole process stops, when the termination reaction occurs. In general, termination occurs in two ways; by combination and by disproportionation. Combination occurs when the polymer's growth is stopped by free electrons from two growing chains that join and form a single chain. Disproportionation occurs when a free radical takes a hydrogen atom from an active chain and leaves behind an unsaturated chain.
2.3.1 Free radical copolymerization Polymerization of two or more different monomers simultaneously is known as copolymerization. The rate of addition of the monomer to the growing chain depends on the nature of the end group of the radical chain. In the case of macromonomers, polymerization and copolymerization it characterized by several factors [31, 32]. 1) Because of the high viscosity of the polymerization medium the polymerization of macromonomers is sensitive to the diffusion-controlled step of the polymerization reaction and is affected by entanglement formation. 2) The concentration of the polymerizable reactive end group is low.
15
Chapter 2: Historical and theoretical background
3) The propagation step is a repeat of macromonomer and the multi-branched radical. 4) High segment density or a multi-branched structure around the propagation radical site lead to a slow rate termination constant kt and less reduced rate propagation constant kp compared to the case with conventional monomers. Many studies have been carried out involving macromonomers, using the Mayo-Lewis equation without any change in the model [32, 33].
[A] d [A] 1 + rA [B ] = d [B ] 1 + r [B ] B [A]
2. 1
where d[A]/d[B] is the molar ratio of the monomer A and macromonomer B, [A]/[B] is the molar ratio, and rA and rB are the monomer and macromonomer reactivity ratios respectively. Since low concentration of the polymerizable reactive end group of macromonomer due to high molecular weight compared to co-monomers, the [A]/[B]>>1, the above equation will simplified to
[A] d [A] = rA [B] d [B ]
2. 2
From the above equation, the copolymer composition is essentially determined by the monomer reactivity ratio of the macromonomer and monomer composition. Based on free radical polymerization kinetics Ito [26] illustrated the equation for homopolymerization of macromonomer of well-known rate equation:
⎛ 2k f ⎞ R p = k p ⎜⎜ d ⎟⎟ ⎝ kt ⎠
1
2
[I ]12 [M ]
2. 3
and an equation to calculate kinetic chain length(ν ):
ν=
Rp Rt
=
k p [M ]
(2k d fk t ) 2 [I ] 2 1
1
=
(1 + x ) DP o 2
n
2. 4
16
Chapter 2: Historical and theoretical background
where Rp and Rt are the rates of propagation and termination of polymerization kp, kd and kt are the rate constants for propagation, initiator decomposition and termination respectively. ƒ is the rate constant of initiation efficiency, [I] and [M] are initiator and monomer concentrations. DPno is the instantaneous number-average degree of polymerization, and χ is the fraction of disproportionation in termination.
2.4 Anionic polymerization Anionic polymerization involving lithium and non-polar monomers has achieved a position of special interest and importance as result of the termination-less polymerization, which was first recognized by Ziegler, as reported McGrath [34]. This phenomenon of “living anionic polymerization” was demonstrated by Szwarc and coworkers in 1956, as reported by McGrath and Baskaran [34, 35]. In this type of polymerization reaction the active end group (propagating species) has a negative charge. Traditionally, anionic polymerization is applied specifically to olefin monomers [36], but it also includes the opening of double bonds as well as ring-opening reactions. Sensitivity of the anionic polymerization reaction toward an easily extracted proton limits the range of solvents that are suitable for anionic polymerization. Hydrocarbons and ethers are the solvents most commonly used. Monomers that undergo anionic polymerization are substituted with groups that stabilize the formation of carbanions. Charge delocalization provides the necessary stabilizing force for the monomers, such as styrene, as shown below in Scheme 2.12. R
R CH
R
R CH
CH
CH
Scheme 2.12 Charge delocalization in styrene, which gives high stability in anionic polymerization.
Polar substituents, such as acrylates, are less useful because of charge delocalizations which give low stability (see Scheme 2.13). Also, the high reactivity of the carbanion tends to produce side reactions with the carbonyl group of the monomer and polymer, and with the acidic hydrogen atom in acrylates, as shown below in Scheme 2.14 [35,
17
Chapter 2: Historical and theoretical background
37].
The same competitive reactions as shown here are also operative in the
propagation step. R
R R
R
C C
C C
O
O
O
O
R=H,CH3
CH3
CH3
Scheme 2.13 Charge delocalization in acrylates, which gives low stability and leads to side reactions in anionic polymerization.
CH2Li
R=CH3
H2C
C
XH
+
COOR`
R
R Side reaction XLi
+
H2C
H2C
C COOR`
R=CH3,H
C
+
R`OLi
COX
Li H2C R`=H
C
+
XH
COOR`
Scheme 2.14 Side reactions that take place with the initiation of acrylate (R=H) and methacrylate (R= CH3) monomers by an alkyllithium (XLi).
2.4.1 Initiation of anionic polymerization Initiation can be caused by strong or weak bases, depending on the monomer structure [36]. Monomers with electron-withdrawing groups attached to the double bonds are susceptible to polymerization. Vinylidene cyanide can be polymerized by even a base as weak as water. In addition, for initiation to occur anionically it requires compounds of the most electropositive elements, for instance alkali metals or alkaline earth metals [38, 39]. Anionic initiators are typically classified into two types: initiators which react by addition of a negative ion and initiators which undergo electron transfer.
18
Chapter 2: Historical and theoretical background
Organo-metallic initiators react either by addition of a negative ion to a double bond or by a ring-opening reaction [40]. As in alkyl lithium compounds, a unique characteristic of the organo-lithium compounds is that the C-Li bond exhibits properties of both covalent and ionic bonds [38]. This is a consequence of the fact that, unlike the other alkali metal compounds, lithium metal has the smallest radius, the highest electro-negativity, and the highest ionization potential [39]. In addition, rather low-energy, unoccupied p orbitals are available for bonding. The covalent character of the C-Li bond, along with the strong aggregation of the ionic pairs, is responsible for the higher solubility of alkyl lithium in hydrocarbon solvent, compared to the solubility of the anions with other alkali metals as a counter ion [38]. The higher alkyl metals have more ionic character and are usually insoluble, thus they initiate polymerization by heterogeneous methods [41]. Initiation of polymerization via electron transfer is a reaction of an alky metal, such as sodium, with a substrate, usually an aromatic compound, which can accept an electron from sodium to form a radical anion salt [41]. To stabilize this complex salt a polar solvent is required. The best example of electron transfer is the reaction between sodium and naphthalene.
Na
+
Na
Scheme 2.15 Electron transfer reaction between sodium and naphthalene.
The unique feature of alkyl lithium compounds is that they aggregate even in the most dilute solutions. The degree of aggregation is affected by the bulkiness of the alkyl metal ion, polarity of the solvent [42], solution concentration and temperature [39, 43]. Unhindered alkyl lithium compounds such as n-butyl lithium form hexametric aggregates in hydrocarbon solutions, but when the alkyl group has a branching point at an α- or βcarbon, such as t-butyl lithium and sec-butyl lithium, then the aggregates will change to tetrameric as illustrated in Scheme 2.16.
19
Chapter 2: Historical and theoretical background
R
Li
R Li
R
R
Li
R
Li
Li
Li
R
Li
Li
R
R R
R Li
(I)
Li
(II)
Scheme 2.16 (I) Tetramer structure of sec-butyl lithium, (II) hexametric structure of n-butyl lithium [38].
The reactivity of alkyl lithium is directly linked with the degree of association [41]. Hsieh [8, 43] illustrated reactivities of various alkyl lithiums for styrene and diene polymerizations, as given below: methyllithium> sec-BuLi> i-PrLi> t-BuLi> n-BuLi Owing to their extreme reactivity and versatility they rapidly react with oxygen, carbon dioxide and moisture [41]. For example:
Bu-Li
+ O2
BuOOLi
Bu-Li
+ CO2
BuCOOLi
Bu-Li
+ H2O or ROH
Bu-Li
2 BuOLi
BuH + LiOH or ROLi
These reactions are very fast, so the presence of these compounds in the reaction system will destroy the initiator, and prevent the initiation from occurring.
2.4.2 Propagation The propagation kinetics for styrene polymerization with lithium as the counterion has been studied in both aromatic and aliphatic solvents. The following equation is valid in both cases [41]. In anionic polymerization, where the rate of initiation is very high relative to that of propagation
d [M ] = k p [I ]o [M ] dt
2. 5
20
Chapter 2: Historical and theoretical background
where [M] is the concentration of the monomer, kp is the propagation rate coefficient, and [I]0 is the initiator concentration at time zero. In a solvent of low dielectric constant, e.g. tetrahydrofuran or tetrahydropyran, an alkali metal cation is associated with the anion, and consequently the structure is described as an anion pair rather than the free anions depicted [36]. In hydrocarbon solvents strong cation solvation is missing, so the polymer carbanion pairs associate in solution and produce a form of auto-solvation. This phenomenon is obvious with lithium alkyls. Although carbon pairs constitute the large number of active centres present in polar solvents such as tetrahydrofuran, some dissociation to free anions and cations must occur. The amount of dissociation is however very small in tetrahydrofuran, completely unimportant in dioxane, and becomes important in solvents with much higher dielectric constants, such as dimethyl sulfoxide.
2.4.3 Termination Typically, termination will not occur in the absence of impurities. The coupling and disproportionation terminations for free-radical polymerizations are not possible with anionic polymerizations due to the repulsion of two negatively-charged species. Termination involves a proton transfer from another species, such as from a solvent, monomer, polymer, water etc. [39]. However, there are no inherent termination steps in highly pure systems. Non-terminated polymeric species are referred to as "living" polymers. Living anionic polymerization is very versatile for the synthesis of well-defined polymers with precisely controlled molecular structure and molecular weight, as well as functionalities [2, 32]. The living polymers are fitted at the chain ends with carbanionic sites, which can either initiate further polymerization, or react with various electrophilic compounds, intentionally added to desired functionalizations. Another advantage of anionic polymerization is the capability of using difunctional initiators, which can yield linear polymers fitted at both chain ends with carbanionic sites. These terminal carbanionic sites of living polymers can be reacted with various electrophilic compounds, yielding α-functional polymers such as esters, nitriles, acid chlorides, anhydrides, epoxides, lactones and benzyl or allyl halogens. These derived end-groups can be used for spectrometric determinations of molecular weight (Mn) or other investigations, besides undergoing a variety of additional reactions e.g. chain extension, branching, or
21
Chapter 2: Historical and theoretical background
crosslinking reactions. The end-groups can also initiate polymerization of other monomers or coupling and linking with reactive groups on other oligomers or polymers. These terminating agents are characterized either as non-living (neutralization of active centers) or living (creation of new anionic active centers). The first linking reaction characterized as non-living was used in 1962 by Morton et al. [9] for the synthesis of 3and
4-arm
star
polystyrene,
by
the
reaction
of
living
polystyrene
with
trichloromethylsilane or tetrachlorosilane. Since then various branched-architecture polymers have been developed. Examples of living terminating agents that have been used in anionic polymerization are allyl halides, 1,1-diphenylethylene and oxirane. Allyl halides are efficient termination agents for living polymerization, although the reaction is not always quantitative due to side reactions involving attack of the active center anion at the double bond of allyl [9, 23, 44]. Oxirane and 1,1-diphenylethylene terminating agents are used for living anionic polymerization as end-capping for the anionic polymerization or as adapter to decrease the nucleophilicity of active center anions especially when methacryloyl chloride is used as end-capping, to avoid side reactions that involve the polar ester group [9, 23, 35]. Miktoarm (Greek word meaning ‘mixed’) or heteroarm star-branched polymers can be synthesized by linking several linear chains having different chemical composition to a central core [45, 46], as shown in Scheme 2.15. The two living polyisoprene PI chains were reacted with methyltrichlorosilane, and then coupled with another living chain, polybutadiene PBd. PISty2_3 Li
PI Li + Styrene
(PI Sty2-3)2 Si(CH3)Cl
+
PBd Li (excess)
(CH3)SiCl3
(PI Sty2-3) Si(CH3)Cl +
PI
Me
Si
PI
2LiCl
+
LiCl
PBd
Scheme 2. 17 An example of the use of linking agents for the synthesis of mixed star arm (Miktoarm) polymers.
2.5 Properties of branched polymers Branched polymers have properties which differ from the corresponding linear polymers of the same molecular weight, both in solution and in the bulk state. Branched polymer
22
Chapter 2: Historical and theoretical background
species have the property which causing an increase in the viscosity of a solvent, even when present in concentrations of less than 1%. This increase in viscosity is associated with more dissipation of the energy in flow, as the long, fine polymer molecules spin around in the sheared fluid. The effect of branching increases the segment density within the molecular coil. Therefore a branched molecule occupies a smaller volume and has a lower intrinsic viscosity than a similar linear molecule of the same molecular weight. The degree of branching is often characterized in terms of the branching factor, g, which distinguishes the effect of long-chain branches on the size of a branched macromolecule in solution, and is defined as the ratio between the mean-square radius of gyration of branched polymers, b, to the mean-square radius of gyration of the linear polymer, l, of the same Mw [47], as shown below:
g=
S2 S
b
2
2. 6
l
In terms of the glass transition temperature (Tg), branched molecules are expected to be significantly different from those of the corresponding linear polymer. Dlubek et al. [1] showed that the glass transition temperature of PSt polymacromonomers is mainly determined by the excess free volume effect of end groups per unit Mw. Generally the Tg value was found to increase with an increase in the Mw of the macromonomer and remain almost constant over a wide range of the backbone lengths [48, 49]. In terms of dynamic shear modulus, Tsukahara et al. [49] revealed that an increase in the backbone length of a polymacromonomer shows a weak rubbery plateau region in the master curves of the storage modulus G` compared to a linear polymer. Nambaa et al. [50] reported that when the lengths of the branches (molecular weight) are smaller than Mc (molecular weight of backbone between branched point), the rubbery plateau region become clear. In addition, polymacromonomers with branch lengths close to the molecular weight of the backbone between branch point Mc and very short backbone shows a clear rubbery plateau region. These results point out that the intermolecular chain entanglement might be strongly limited in a polymacromonomer due to the multibranched structure of high branchdensity, which explains the brittle property of polymacromonomer films [50].
23
Chapter 2: Historical and theoretical background
2.6 Free volume The concept of free volume, regardless of its qualitative nature, is very useful in explaining many properties and phenomena associated with polymers, such as mobility, viscosity, melt behaviour, transport of gases, etc.
For example, a polymer kept at
temperatures moderately below its Tg undergoes a slow relaxation process by which the volume decreases gradually, while at the same time the material becomes stiffer and more brittle. This phenomenon can be understood as resulting from a decrease in the free volume. The free-volume theory of materials is based on the idea that molecular motion in the bulk state depends on the presence of holes. In the case of small molecules, when a molecule moves into a hole, the hole exchanges the place with the molecule. However, in the case of macromolecules, more than one hole is required before macromolecule segments can move. These holes exist inside a polymer matrix due to the irregular packing of the chains in the amorphous state and the terminal chain ends [51]. The theory developed to explain the non-Arrhenius dependence of the fluidity or viscosity of liquids on temperature is known as the Doolittle equation [52, 53].
ln η = ln A + B
(υ − υ ) f
υf
2. 7
where η is the viscosity, ν is the specific volume and νf is the free volume. Williams, Landel and Ferry [54] found that free volume increased linearly with temperature, as described in their equation, the so-called “WLF”. (2.4). This was derived from the above equation.
⎡ M (T ) ⎤ log a(T ) = log ⎢ ⎥ ⎢⎣ M (Tg )⎥⎦
2. 8
where a(T) is the time-temperature shaft factor, and Tg is the reference temperature to which the master curves are generated by shifting the dynamic mechanical test data at other temperatures T, The free-volume interpretation of the WLF equation relies on two theories, linearity of the free-volume fraction:
f (T ) = f g + α f (T − Tg )
2. 9
24
Chapter 2: Historical and theoretical background
and
B f ,M = 1
2. 10
where M is a general parameter; (η viscosity, relaxation time τ, or diffusion coefficient 1/D ). (Tg) is the glass temperature or reference temperature, (T) is another temperature, αf is the free-volume-fraction expansion coefficient, f (T) is the free-volume fraction, fg is the fraction at Tg, and B f,M is the coefficients of free-volume f and M [55]. The quantitative measurement of the free volume size and free volume number has become a subject of great interest and importance. A number of techniques have been used for measurement of free volume; these include, small angle X-ray scattering and neutron diffraction, which have been used to determine density fluctuations to deduce free volume size distributions [41, 56]. Other techniques used to probe voids and defects in materials, such as scanning tunneling microscopy (STM) and atomic force microscopy (AFM), are both sensitive to angstrom-size holes, but are limited to static holes on the surface, limiting their use in polymers. Scanning electron microscopy (SEM) and transmission electron microscopy (TEM) are more sensitive to static holes at sizes of 10 Å or larger. Positron annihilation lifetime spectroscopy (PAL) has been established as a powerful tool for characterizing the free volume properties in polymers. Reasons for this include the following:
-
the small size of the positronium probe (1.59 Å) compared to other probes, which offers sensitivity to small holes and free volume of the order of angstrom magnitude,
-
relatively short lifetime of the o-Ps (typically about 2-4 ns in polymers),
-
PAL can probe holes due to molecular motion from 10-10s or longer,
-
PAL is capable of determining the local hole size and free volume in a polymer without being significantly interfered with by the bulk,
-
PAL has been developed to be a quantitative probe of free volume in polymers,
-
PAL gives detailed information on the distribution of free-volume hole sizes in the range from 1 to 10 Å.
25
Chapter 2: Historical and theoretical background
2.7 Application of positron annihilation techniques to study polymers The positron is an anti-electron. It was discovered by Anderson in 1933 [51, 52]. These anti-matter particles, upon meeting matter, destroy each other, hence the term annihilation. A positron in an electronic medium can pick up an electron and form a neutral atom called a Positronium (Ps), which forms in most molecular systems [48, 5153, 57-60]. There are two states of positronium atoms: p-Ps and o-Ps, from an antiparallel spin and parallel spin combination respectively. This leads to different lifetimes and annihilation events between these atoms; p-Ps has a shorter lifetime than o-Ps. When positrons emitted from an isotope source such as
22
Na are injected into materials,
they lose energy through ionization and excitation. After thermalization, positrons will diffuse in the media and finally they will be annihilated with electrons. A PAL analysis typically gives three lifetime components in polymers: τ1 attributed to para-positronium self-annihilation,
τ2 attributed
to
free
positron
and
positron-molecular
species
annihilation, and τ3 attributed to ortho-positronium pickoff annihilation. Ortho-positronium (o-Ps) pickoff annihilation is a quenching process during which the positron (localized in free volume cavities) annihilates with an electron (of opposite spin) from the surrounding cavity wall [52, 53]. The o-Ps lifetime is related to the free-volume size, while the o-Ps intensity contains information about many properties of polymers [51, 53]. The following equations shows the relationships between o-Ps lifetime (τ3), and freevolume radius (R).
τ 3−1
⎡ ⎤ ⎢ ⎥ R 1 ⎢ ⎥ ns −1 = 2 1− + ⎢ Ro ⎛ R ⎞⎥ ⎟⎥ ⎢ 2π sin ⎜⎜ 2π Ro ⎟⎠ ⎥⎦ ⎝ ⎣⎢
(
)
2. 11
where Ro = R+ΔR, and ΔR is an empirical parameter, Ro is the infinite spherical potential radius and R is the hole radius. In addition
to determining the hole size of polymers, it is also useful to determine
changes in fractional free-volume (fv), which is related to mechanical properties of a polymer. The fractional free-volume is a result of the average hole size and the hole concentration, and can be determined using the following equation [51]:
26
Chapter 2: Historical and theoretical background
fυ = CI 3 V f (τ 3 )
2. 12
where (fv) is free-volume fractions, (I3) is the total fraction of o-Ps formed in the polymer, 〈vf(τ3)〉 (in Å3) is the mean hole volume, and C is a empirical scaling constant. PAL has been used to examine other properties correlated to free volume in polymers and polymer blends, such as glass transition (Tg), gas permeation, mechanical properties, and chemical sensitivity. Amorphous polymers exhibit widely different physical and mechanical behaviours, depending on the temperature and structure of the polymer. The glass transition temperature, for instance, is accompanied by a change in free volume. A number of studies have been carried out to study this phenomenon using PAL [1, 60]. The diffusion of gases through polymers is determined by the mobility of gas molecules through the polymer matrix. McCulagh et al. [61] showed that there is a correlation between the free volume measured by PAL and the diffusivity of carbon dioxide and oxygen. In a series of polyester copolymers and polycarbonates they found that the lifetime data (τ3) is in direct proportion to gas permeability. PAL was also used to study the miscibility in polymer blends [51, 61]. Chen et al. [62] studied blend systems consisting of PE, PMMA, PC and PA, and found a decrease in o-Ps intensity with time in PE, PMMA and PC during positron annihilation. They suggested this was due to the formation of free radical by the positron irradiation. The influence of structural properties and molecular weight of the polymer on the PAL measurement of free volume is obviously. Yu et al. [63]
studied the effect of the
molecular weight of polystyrene samples on the free volume and found that the free volumes below Tg were not significantly different in high- and low- molecular weight samples, while above Tg the lower molecular weight sample had significantly higher fractional free volume than the high molecular weight sample. Another factor that has an effect on free volume, as measured by PAL, besides chain end, is stereoregularity in the chains. Hamielec et al. [64] found an increased lifetime with increased randomness of the chain configuration in a series of polyvinylchloride (PVC) samples. Side chains also have an effect on the lifetime of positrons, which is related to free volume. Dlubek et al. [1] studied a series of α-polyolefins, from polypropylene to poly-1-eicosene, and found that average hole sizes and o-Ps intensity decreased from polyethylene to
27
Chapter 2: Historical and theoretical background
polypropylene, followed by a slight increase to poly-1-butene, then a rise in hole size and intensity to poly-1-dodecene, followed by a gradual decrease until poly-1-eicosene. Another application of PAL is to study the structural relaxation of amorphous polymers far below and above their Tg [65, 66].
28
Chapter 2: Historical and theoretical background
2.8 References:
1.
G. Dlubek, D. Bamford, A. Rodriguez-gonzalez, S. Bornemann, J. Stejny, B. Schade, M. A. Alam, M. Arnold. Journal of Polymer Science: Part B: Polymer Physics. 2002, 40, 434.
2.
N. Hadjichrisridis, M. Pitsikalis, S. Pispas, H. Latrou. Chemical Reviews. 2001, 101, 3747.
3.
M. Fernadez-Garcia, J. Luis de la Fuente, M. Cerrada, E. Madruga. Polymer. 2002, 43, 3173.
4.
Steven A. Schwartz, Sallie J. Lee, Adam Chan. IS&T's NIP19: International Conference on Digital Printing Technologies, Final Program and Proceedings, New Orleans, LA, United States. 2003215-220.
5.
K. Ito, N. Usami, Y. Yamashita. Macromolecules. 1980, 13, 216.
6.
H. Tobita. Polymer. 1999, 40, 3565.
7.
C. A. Costello, D. N. Schulz. "Copolymers". Encyclopedia of Chemical Technology. J. I. Knoschwite, M. Howe-Grant. Eds, John Wiley and Sons: New York. Vol. 7. 349.
8.
A. Hirao, S. Loykulnant, S. Takashi. Progress in Polymer Science. 2002, 27, 1399.
9.
P. F. Rempp, E. Franta. Advances in Polymer Science. 1984, 58, 3.
10.
N. Hadjichristidis, S. Pispas, M. Pitsikalis. Progress in Polymer Science. 1999, 24, 875.
11.
P. F. Rempp, P. J. Lutz. "Synthesis of graft copolymers". Comprehensive Polymer Science the Synthesis, Characteriztion, Reaction and Applications of Polymer. Sir. G. Allen, J. C. Bevington. Eds. 1989, Pergamon Press: New York. Vol. 6. 403.
29
Chapter 2: Historical and theoretical background
12.
Y. Tezuka, H. Oike. Progress in Polymer Science. 2002, 27, 1069.
13.
R. Narayan, C. J. Biermann, M. O. Hunt, D. P. Horn. Adhesives from Renewable Resources. 1989, 338.
14.
M. Pitsikalis, S. Pispas, J. W. Mays, N. Hadjichristids. Advances in Polymer Science. 1998, 135, 1.
15.
J. Deng, W. Yang. European Polymer Journal. 2005, 41, 2685.
16.
H. Latrou, N. Hadjichrisridis, S. Pispas, M. Pitsikalis. Current Organic Chemistry. 2002, 6, 155.
17.
N. Hadjichristidis, J. Roovers. Journal of Polymer Science Part B: Polymer Physics. 1978, 16, 851.
18.
K. L. Beers, S. G. Gaynor, K. Matyjaszewski, S. S. Sheiko, M. Moller. Macromolecules. 1998, 31, 9413.
19.
S. Tanaka, M. Uno, S. Termachi, Y. Tsukahara. Polymer. 1995, 36, 2219.
20.
Y. Wang, G. Lu, L. Huang. Journal of Polymer Science: Part A: Polymer Chemistry. 2004, 42, 2093.
21.
P. Rempp, E. Franta, J. Herz. "Synthesis of model macromolecules of various types via anionic polymerization". Anionic Polymerization Kinetics, Mechanisms, and Synthesis. J. McGrath. Eds. 1981, American Chemical Society: Washington D. C. 59.
22.
A. Takano, T. Furutani, Y. Isono. Macromolecules. 1994, 27, 7914.
23.
R. Asami, M. Takaki, H. Hanahata. Macromolecules. 1983, 16, 628.
24.
Y. Tsukahara, K. Tsutsumi, Y. Yamashita, S. Shimada. Macromolecules. 1990, 23, 5201.
25.
W. J. Feast, V. C. Gibson, A. F. Johnson, E. Khosravi, M. A. Mohsin. Journal of Molecular Catalysis A: Chemical. 1997, 115, 37.
30
Chapter 2: Historical and theoretical background
26.
K. Ito. Progress in Polymer Science. 1998, 23, 581.
27.
J. R. Lizotte. Doctor of Philosophy in Chemistry Dissertation. State University of Virginia. 2003
28.
Y. Tezuka, A. Araki. Polymer. 1993, 34, 5180.
29.
V. Percec, J. H. Wang. Journal of Polymer Science Part A: Polymer Chemistry. 1990, 28, 1059.
30.
Y. Nagasaki, R. Ukai, M. Kato, T. Tsuruta. Macromolecules. 1994, 27, 7236.
31.
Y. Tsukahara, K. Mizuno, A. Segawa, Y. Yamashita. Macromolecules. 1989, 22, 1546.
32.
K. Ito, S. Kawaguchi. Advances in Polymer Science. 1999, 142, 130.
33.
F. Meijs, E. Rizzardo. Journal of Macromolecular Science, Reviews in Macromolecular Chemistry and Physics. 1990, C30 (3&4), 305.
34.
J. E. McGrath. "Preface". Anionic polymerizarion kinetis, mechanisms, and synthesis. J. E. McGrath. Eds. 1981, American Chemical Society: Washington, D. C. xi.
35.
D. Baskaran. Progress in Polymer Science. 2003, 28, 521.
36.
S. Bywater. "Anionic polymerization". Encyclopedia of Polymer Science and Engineering. H. F. Mark, N. M. Bikales, C. G. Overberger, G. Menges. Eds. 1985, John Wiley and sons: New York. Vol. 2. 2.
37.
C. Zune, R. Jerome. Progress in Polymer Science. 1999, 24, 631.
38.
R. N. Young, R. P. Quirk, L. J. Fetters. Advances in Polymer Science. 1984, 56, 3.
39.
M. Szwarc. Advances in Polymer Science. 1980, 49, 30.
40.
K. Hashimoto. Progress in Polymer Science. 2000, 25, 1411.
31
Chapter 2: Historical and theoretical background
41.
J. Hofmans, L. Maeseele, G. Wang, K. Janssens, M. van Beylen. Polymer. 2003, 44, 4109.
42.
M. Morton, L. J. Fetters, R. A. Pett, J. F.Meier. Macromolecules. 1970, 3, 327.
43.
H. Hsieh. Rubber Chemistry and Technology. 1970, 43, 22.
44.
G. Carrot, J. Hilborn, D. M. Knauss. Polymer. 1997, 38, 6401.
45.
R. P. Quirk, Y. Lee, J. Kim. Journal of Macromolecules Science Polymer Reviews. 2001, C41, 369.
46.
R. W. Pennisi, L. J. Fetters. Macromolecules. 1988, 21, 1094.
47.
H. Tobita, K. Sumi, Y. Yamashita, S. Shimada. Macromolecules. 1990, 23, 5201.
48.
G. Dlubek, H. M. Fretwell, M. A. Alam. Macromolecules. 2000, 33, 187.
49.
Y. Tsukahara, S. Namba, J. Iwasa, Y. Nakano, K. Kaeriyama, M. Akahashi. Macromolecules. 2001, 34, 2624.
50.
S. Nambaa, Y. Tsukaharaa, K. Kaeriyamaa, K. Okamotob, M. Takahashib. Polymer. 2000, 41, 5165.
51.
P. E. Mallon. "Application to Polymers". Principles and Applications of Positron and Positronium Chemistry. Y. C. Jean, P. E. Mallon, D. Schrader. Eds. 2003, World Scientific: Singapore. 253.
52.
W. Brandt, S. Berko, W. W. Walker. Physical Review. 1960, 120, 1289.
53.
I. Prochazka. Materials Structure. 2001, 8, 55.
54.
F. Bueche. Physical properties of polymers. 1979, New York: Robert E. Krieger.
55.
J. Bartos, K. Kristiakova, O. Sausa, J. Kristiak. Polymer. 1996, 37, 3397.
56.
N. Hadjichrisridis, M. Pitsikalis, S. Pispas, H. Iatrou. Journal of Polymer Science: Part A. 2000, 38, 3211.
32
Chapter 2: Historical and theoretical background
57.
H. A. Hristov, B. Bolan, A. F. Yee, L. Xie, D. W. Gidley. Macromolecules. 1996, 29, 8507.
58.
W. Brandt, I. Spirn. Physical Review. 1966, 142, 231.
59.
G. Dlubek, M. Supej, V. Bondarenko, J. Pionteck, G. Pompe, R. KrauseRehberg, I. Emri. Journal of Polymer Science: Part B: Polymer Physics. 2003, 41, 3077.
60.
A. J. Hill, S. Weinhold, G. M. Stack, M. R. Tant. European Polymer Journal. 1996, 32, 843.
61.
C. M. McCulagh, Z. Yu, A. M. Jamieson, J. Blackwell, J. D.McGervey. Macromolecules. 1995, 28, 6100.
62.
Z. Q. Chen, A. Uedono, T. Suzuki, J. S. He. Journal of Radioanalytical and Nuclear Chemistry. 2003, 255, 291.
63.
Z. Yu, U. Yahsi, J. McGervey, A. M. Jamieson, R. Simha. Journal of Polymer Science Part B: Polymer Physics. 1994, 32, 2637.
64.
A. E. Hamielec, M. Eldrup, O. Mogensen, J. Jansen. Journal of Macromoleciles Seience Polymer Reviews. 1973, C9(2), 305.
65.
D. Cangialosi, M. Wübbenhorst, H. Schut, A. van Veen, S. J. Picken. Materials Science Forum. 2004, 445-446, 271.
66.
A. Uedono, T. Kawano, S. Tanicawa, M. Ban, M. Kyoto, Uozumi T. Journal of Polymer Science: Part B: Polymer Physics. 1996, 34, 2145.
33
Chapter 3: Synthesis and characterization of macromonomers and grafts
Chapter 3 Synthesis and characterization of macromonomers and grafts 3.1 Synthesis Glassware and syringes were dried prior to use in an oven at 120 oC and then flushed with high purity argon gas.
3.1.1 Materials The following materials were used. Some compounds were purified further (3.1.2), styrene and methyl methacrylate (Plascon Research), potassium hydroxide (R & S, 85%), toluene (Analytical reagent, 99.9%), tetrahydrofuran (Sigma-Aldrich, 99.9%), methanol (Acros, 99.8%), n-butyllithium (Aldrich, 15% in hexane), benzophenone (Sigma), sodium metal (Saarchem), p-vinyl benzyl chloride (Fluka, 90%), and 3(dimethyl chloro silyl) propyl methacrylate (Fluka, 85%), hexane (Analytical Reagent), magnesium sulfate (Riedel-de Haen, 99.5%). 2,2`-azobis(isobutyronitrile) (AIBN, Delta scientific, 98%) was recrystallized from methanol. Deuterated chloroform (CDCl3, Cambridge Isotope Laboratories) was used as NMR solvent.
3.1.2 Purification of the monomers Styrene and methyl methacrylate monomers were purified to remove the inhibitors and any impurities by distillation under reduced pressure. The monomers were first washed with 0.3 M potassium hydroxide (KOH) solution to remove the hydroquinone inhibitor. Then the monomers were transferred into a round-bottom flask containing glass beads. The distillation was carried out under reduced pressure and low heat (about 35 oC) to avoid self polymerization of the monomers. The distilled fractions were collected and dried over anhydrous magnesium sulfate to ensure a completely dry monomer. The monomers were stored at -8 oC prior to use.
34
Chapter 3: Synthesis and characterization of macromonomers and grafts
3.1.3 Purification of the solvents Toluene and tetrahydrofuran were purified from any impurities and water that would effect the polymerization. The solvents were distilled over small pieces of sodium metal and benzophenone [1]. Distillation was carried out under an argon atmosphere for several hours to allow the sodium metal to dry the solvent, A deep blue-green colour, which is attributed to the formation of benzophenone ketyl, indicates that the solvent is dry and ready to use. Argon atmosphere
argon atmosphere to bauble
Figure 3.1 Solvent purification setup.
3.2 Anionic polymerization of styrene 3.2.1 Monomer conversion Monomer conversion was determined gravimetrically. This polymerization was considered as a reference anionic polymerization of styrene in terms of the required time for termination.
35
Chapter 3: Synthesis and characterization of macromonomers and grafts
3.2.2 Synthesis of styrene macromonomers Styrene macromonomers were synthesized by using the anionic polymerization techniques in order to obtain products with narrow polydispersity and control of molecular weight, using the relationship: Mn (g/mol) = (styrene (g)) / [BuLi (mol)]
A general procedure for the preparation of styrene macromonomer terminated with pvinyl benzyl is given by the following example. Freshly distilled styrene (8.3 mmol) and 10 ml of toluene were injected via a syringe into a 100 ml dry round-bottom flask equipped with a magnetic stirer bar and rubber septum, under an argon atmosphere. nButyllithium (1.8 mmol) initiator was added slowly until the characteristic colour of the styryl anion was achieved, indicating the initiation of the polymerization reaction. The reaction was allowed to proceed for 50 min at 30 oC before the polystyryllithium solution was transferred, under argon, through a channel to another flask (see Figure 3.2) containing a solution of p-vinyl benzyl chloride in a mixture of toluene and THF (using a five-fold excess of reagent over n-BuLi). This coupling reaction was carried out for 30 min at 0 oC. The macromonomer was then precipitated in methanol, collected by filtration, and dried under vacuum at room temperature overnight. The material was then extracted with hot methanol [2-4] for 4 hours and dried under vacuum at 40 oC to constant weight.
Polystyryl lithium solution
p-vinyl benzyl chloride
Figure 3.2 Glassware used for the preparation of vinyl benzyl terminated macromonomer.
In the case of the methacryloxypropyl-styrene macromonomer a similar procedure was used, except that as the termination agent is air sensitive, the reaction was completed inside an atmosbag in an argon atmosphere to prevent any contact with air. The reaction
36
Chapter 3: Synthesis and characterization of macromonomers and grafts
was terminated by introducing an equal amount of moles of terminating agent to n-BuLi, via a syringe, into the reaction mixture. Immediately the colour of the reaction mixture became colourless, indicating termination of the polymerization. The macromonomer was then precipitated in methanol, collected by filtration, and dried under vacuum at room temperature overnight to constant weight. The general synthesis reactions of pvinyl benzyl-polystyrene and methacryloxyproply-styrene macromonomers are shown in Scheme 3.1.
n-BuLi
+
Bu-
30 oC
Bu
Li
PS
+
LiCl
CL
(a)
n-BuLi
+
30 oC
Bu-
Bu
PS Li H2C
H3C i CL S CH3
CH3
O C O
CH3 Si H3C
+
O
C O
CH2 CH3
LiCl
(b)
Scheme 3.1 Examples of synthesis of macromonomers via anionic polymerization: (a) p-vinyl benzyl polystyrene macromonomer (b) methacryloxypropyl polystyrene macromonomer.
These macromonomers were then used to synthesize respective graft copolymers where they will be the side chain of the branched polymer. Grafting through polymerization with methyl methacrylate monomers should yield well controlled branch polymers in terms of branch length.
3.2.3 Copolymerization reaction “graft formation” Free radical polymerizations of the styrene macromonomers with different end groups were carried out with methyl methacrylate (MMA) in toluene as solvent. The reactions are illustrated in Scheme 3.2.
37
Chapter 3: Synthesis and characterization of macromonomers and grafts
CH3
CH3 H3C
C H2
H2 C
H3C Si
C H2
n
CH3H2 O C C C C H2 H2 O
CH3
CH2-C
MMA CH2
CH2-C
C
AIBN 60 oC
O
O
n
O
C O
O
O
CH3
CH3
(a)
CH2-CH
C
(CH2)3 H3C
Si
CH3
CH-CH2 Ph
H3C
C H2
H2 C
C H2
o
AIBN 60 C
C O CH3
(b)
CH2-C
CH2-C
MMA n
Ps
CH3
CH3
O
n
C
CH2-CH O
O CH3
H2C CH-CH2 Ph Ps
Scheme 3.2 Further examples of copolymerization reactions to synthesize graft copolymers via macromonomer techniques: (a) methylmethacrylate-graft-methacryloxypropyl-styrene macromonomer, (b) methylmethacrylate-graft-p-vinyl benzyl-styrene macromonomer.
A general procedure for the synthesis of the graft copolymers is given by the following example. The macromonomer and comonomer (in different ratios), were stirred in toluene in sealed tubes, under a nitrogen blanket at 70 oC for 24 h, 2,2`-azobisisobutyronitrile (AIBN) was used as initiator (1 wt% to total comonomer content). The copolymers were precipitated into methanol then filtered and dried under vacuum at room temperature overnight. The unreacted macromonomer was removed by precipitation using toluene as solvent and hexane as non-solvent [5]. A sample of about 0.5 g was dissolved in about 10 ml of toluene, and then precipitated in hexane. The resultant graft copolymer and methylmethacrylate homo-polymer precipitated out of solution, while the unreacted macromonomer was still soluble in the solution. The yield of the graft polymer was generally about 80-90%. The extraction of the unreacted macromonomer was tracked using SEC with UV and RI detectors. The graft copolymers were characterized by the following techniques: size exclusion chromatography (SEC) with dual detectors (UV, RI), Fourier-transform infrared spectroscopy (FT-IR), nuclear magnetic resonance spectroscopy (1H-NMR), LCtransform, and liquid chromatography under critical conditions (LCCC), differential scanning calorimetry (DSC) was used for thermal analysis, and positron annihilation lifetime spectroscopy.
38
Chapter 3: Synthesis and characterization of macromonomers and grafts
3.3 Characterization 3.3.1 Size exclusion chromatography (SEC) SEC is the most widely used liquid chromatographic technique for the separation of polymers according to their size in solution, or chain length which can be correlated with molar mass, either from a calibration or using molar mass sensitive detectors. In the calibration method a series of standards with narrow molecular mass distribution (MMD) is injected into the column to determine their elution volumes, in order to establish a calibration curve from which the molar mass for a given elution volume is obtained. Molar mass sensitive detectors are available, such as low angle light scattering (LALS) detector, multi-angle laser light scattering (MALLS) detector, and differential viscometers [5-8]. The molecule size in solution is influenced by molecular architecture as well as molecular mass. For linear homopolymers, SEC yields true molar masses. In the case of complex polymers the overlapping of molar masses of different polymers leads to the elution of polymers of different molar masses simultaneously. SEC coupling to more than one detector can provide information on the average chemical composition as a function of molar mass. A number of detectors can be used if the response factors of the detectors for the components of the polymer are sufficiently different; for example, a combination of UV and RI detection [8-10]. Number average and weight average molecular mass (Mn) as well as polydispersity indices were obtained through the use of SEC with two concentration dependent detectors, UV and RI. The UV was adjusted to 254 nm, corresponding to the absorption of the aromatic ring. Therefore this detector only shows a response when there is styrene present in the polymer. Macromonomer was dissolved in THF (5 mg/ml) and filtered through a 0.45-µm nylon filter. Analyses were carried out with a system comprising a waters 610 Fluid Unit, Waters 410 differential refractometer at 30 oC, Waters 717plus Auto sampler and Waters 600E system Controller. Two Plgel columns 5 µm Mixed-C 300*7.5 mm (Polymer Laboratories) and pre-column Plgel 5-µm guard 507.5 mm (Polymer Laboratories) were used. The column oven was set at 30 oC. The THF solvent flow rate was 1.0 mL/min, and the injection volume was 100-µl. The system was calibrated with narrow polystyrene standards. Millennium2005 was used for data acquisition and data analysis.
39
Chapter 3: Synthesis and characterization of macromonomers and grafts
3.3.2 Nuclear magnetic resonance (NMR) spectroscopy Proton NMR spectra were recorded in CDCl3, using a Varian Unity Inova 400 MHz NMR: Instrument, and a Varian VXR 300 MHz NMR: Instrument. The NMR spectra were used to determine the chemical composition of macromonomer and the extent of reaction of termination, as well as to characterize the graft copolymers.
3.3.3 Fourier-transform infrared (FTIR) spectroscopy FTIR was used to characterize the chemical bonding present in samples. As a beam of infrared radiation is passed through a sample (or reflected off of a sample) certain frequencies are absorbed by the sample's interatomic bonds, through resonance. The absorbed frequencies are measured by an interferometer and related to the chemical bonding present in the sample. For many polymer compounds the infrared spectrum is a virtual fingerprint, which may be used for positive identification. IR spectra of the macromonomers and graft were obtained using a Perkin Elmer Paragon 1000 FT-IR. Samples were prepared by grinding about 2-3 mg of sample and mixing with 300-400 mg KBr, then pressed to form transparent disks.
3.3.4 Light scattering Since there is no correlation between molar mass and elution volume for complex polymer using SEC analysis, the determination of molar mass using molar mass sensitive detectors, such as a light scattering detector, is necessary. When a polarized, mono-chromatic laser beam passes through a solvent containing polymer, the excess light scattered by the molecules at an angle to the incident beam over that scattered by the solvent alone is directly proportional to the molecular mass (Mw). The measurements of scattered light passing through a cell at different angles, from zero to 90 degrees, provides an accurate molecular mass and enable a calculation of the radius of gyration (Rg). The (excess) intensity Rθ of the scattered light at the angle θ is correlated to the weight average of molar mass Mw of the dissolved macromolecules, as shown in equation 3.1 [11, 12].
( )
⎤ K *c 1 ⎡ 16π 2 2 = rg sin 2 θ ⎥ + 2 A2 c, ⎢1 + 2 2 R(θ ) M ⎣ 3λ ⎦
3.1
40
Chapter 3: Synthesis and characterization of macromonomers and grafts
where K* is an optical parameter (described in equation 3.2), c is the solution concentration in mg/ml, λ is the wavelength of the light in vacuum, M is the weight 2 average molecular mass, rg is the mean square radius of gyration, and A2 is the second
virial coefficient.
K* =
(
4π 2 n02 dn
λ40 N A
) dc
2
3.2
here n is the refractive index, dn/dc is the refractive index increment of the solute, and NA is Avogadro’s number. A measurement at more than one angle can provide additional information. For a plot of K*c/Rϑ versus sin2(θ/2), the Mw value can be obtained from the intercept, and the radius of gyration from the slope. The molar mass determination requires knowledge of the specific refractive index increment dn/dc, which depends on chemical composition of the copolymer. The dn/dc value of a copolymer can be determined for a chemically mono-disperse fraction if the weight fraction wi and the dn/dc value of homopolymer values are known
(dn dc )
copolymer
(
= ∑ wi dn
dc
)
3.3
i
But in some cases good interactions between the monomer units in the polymer chain could move the (dn/dc)copolymer values away from the summation fraction [13]. In this study the dn/dc values of the graft copolymers were determined for pure graft copolymers, using a ScanRef monocolor instrument at a wavelength 633 nm. The dn/dc value for each graft polymer was determined by measuring the refractive indices of a series of prepared polymer samples in THF, of various concentrations, from single stock solution (0.5 mg/mL, 1.0 mg/mL, 2.0 mg/mL, 3.0 mg/mL and 4.0 mg/mL). 2.0 mg/mL samples of each graft were injected in the SEC which is coupled to a multiangle light scattering (MALLS) detector for the determination of the absolute molar mass of the graft.
3.3.4.1 SEC-MALLS The ability to study the scattered light intensity at difference angles gives very important information on the molar mass and root mean square radius of branched polymers. This
41
Chapter 3: Synthesis and characterization of macromonomers and grafts
technique was first achieved by using a so-called scanning goniometer, which comprises a single detector that moves along an arc around the sample and measures the intensity of scattering light at different angles. The development of this technique to measure the intensity of light scattering at different angles during the same experiment run with an array of detectors that are placed at fixed angles along an arc in the scattering place, allows the technique to be used as a detector coupled to SEC. The MALLS measurements carried out on molecular solutions give absolute molar mass and, root mean square radius values. In a conventional SEC-MALLS setup, a MALLS instrument is placed after the SEC column, followed by the RI detector. The SEC separates the sample with regard to hydrodynamic volume, and then the sample passes through the MALLS instrument, which subsequently performs analysis on each elution segment, giving the absolute molar mass and the size of molecules in each elution fraction. The sample then passes through the RI detector, which is concentration sensitive, so the concentration of each elution will be determined as it passes through detector.
A
chromatograph was used that consisted of a 610 Waters pump, a 717 autosampler (Waters, Milford, MA), a laser photometer miniDAWN (Wyatt Technology Corporation, Santa Barbara, CA) and a 410 differential referctometer (Waters). ASTRA software (Wyatt Technology Corporation) was used for data collection and processing.
3.3.5 LC-transform Size exclusion chromatography coupled with FTIR spectroscopy is a very useful technique because infrared spectroscopy provides information on the chemical substructures present in a sample and SEC gives an indication the molar mass of the sample. There are two techniques used for the coupling of SEC and FTIR. In the first technique there is a flow cell, where the mobile phase of SEC passes through the IR cell after sample separation according to hydrodynamic volume, while IR absorbance of the eluent is recorded. In the second technique use is made of an interface that evaporates the solvent and leaves behind a solid sample deposit on a germanium disc, and IR spectra are recorded at positions on the disc [14-16], as shown in Figure 3.3.
42
Chapter 3: Synthesis and characterization of macromonomers and grafts
Figure 3.3 LC-transform unit showing collection disc and optic module [13].
A LC-transform Model 303 (Lab Connections, series 300) interface was used to evaporate the eluent and to collect the chromatogram on a 60 x 2 mm (diameter x thickness) rear-surface-aluminized germanium disc. The nozzle was fixed at a distance of 8 mm above the collection disc surface. The nebuliser nozzle temperature was set at 35 oC. The disc movement during sample deposition was controlled by a motor at 10 o
/min. A pump was used to deliver a constant flow of 1 ml/min of THF containing 5 mg/ml
of polymer to the LC–FTIR interface. The pressure inside the vacuum chamber was maintained at 11 torr, using a (liquid nitrogen trapped) vacuum pump to remove solvent vapours. The LC–FTIR interface was operated in parallel with the ELSD detector via a flow splitter. After sample deposition, the collection disc was manually transferred to an optical module FTIR spectrophotometer, controlled by optics module (Lab Connections), at the same rotation speed at which deposition was made, to ensure a compatible run time with the chromatographic run. The scan resolution was set at 4 cm-1 and one accumulation was preformed for each point along the border of the germanium disc. Output data was analyzed using Timebase software V2.0 supplied by Perkin Elmer, where it was presented as a Gram-Schmidt chromatogram. IR absorption was obtained from 4500 to 400 cm-1. The maximum peak heights of ester and styrene ring absorptions from the selected IR absorption bands in each spectrum were calculated.
43
Chapter 3: Synthesis and characterization of macromonomers and grafts
3.3.6 Liquid chromatography under critical conditions (LCCC) Two main processes govern the separation of a polymer in liquid chromatography namely, steric exclusion and enthalpic interactions. In the case of using a good solvent for the polymer the enthalpic interaction ΔH= 0 between polymer and stationary phase is minimized and the separation will be governed by entropic exclusion and Gibbs free energy: ΔG= -TΔS. This mode is known as size exclusion chromatography. The addition of a poor solvent to the system would increase the enthalpic interaction between the polymer and the stationary phase. This interaction increases with the degree of polymerization, the higher molar mass the higher interaction will be, this mode is known as adsorption mode. So, somewhere between these two modes, while solvent strength change from good to poor solvent, there is one critical point where the entropic exclusion effects and enthalpic adsorption effects are equal to each other: ΔH= -TΔS and the Gibbs free energy would be equal zero: ΔG= 0 [7, 10, 17-19]. Under these chromatographic conditions the separation of a polymer sample is governed by chemical differences without regard to molecular mass [7, 10, 18]. It is possible, under these conditions of chromatographic analysis, to determine the heterogeneities of the polymer without any influence of the polymer molar mass. Experiments were carried out on conventional liquid chromatography equipment. The columns used were symmetry 300 C18 and Nucleosil 120 C18. The column oven temperature was set at 30 oC. The detectors used were the Waters 486 tunable absorbance UV detector at a wavelength of 254 nm and the Polymer Laboratories PLEMD960 evaporative light scattering detector (ELSD), nebulizer at 80 oC and Evaporator at 90 oC with a N2 carrier gas flow rate 1 SLM (standard liters per minute). Eluent was ACN-THF, with a flow rate of 0.5 mL/min. It was determined experimentally that an ACNTHF ratio of 50.2-49.8 was needed to be at the critical point of polystyrene. (This is discussed in section 4.8.1).
3.3.7 Differential scanning calorimetry (DSC) DSC measures the temperature and heat flow associated with transitions in materials as a function of time and temperature. This measurement provides quantitative and qualitative information about physical and chemical changes that involve endothermic or exothermic processes, or a change in heat capacity. The general definition of Tg is a
44
Chapter 3: Synthesis and characterization of macromonomers and grafts
temperature at which a material's characteristics change from that of a glass below Tg to that of rubber above it. In this study a TA instrument Q100 DSC system was used to measure the Tg. It was first calibrated by measuring the melting temperature of indium metal according to standard procedure. Polymer samples of known weight were placed in an aluminum pan. An empty aluminum pan was used as a reference. All measurements were carried out under a nitrogen atmosphere, and at a purge gas flow rate of 50 ml/min. The temperature profile of the DSC was carried out at a heating rate of 10 °C/min. The sample was quenched from room temperature at the maximum cooling rate (20 deg/min) to -40 °C and then scanned until 140 °C. The actual value for the Tg was estimated as the temperature at the midpoint of the line drawn between the temperature of intersection of the first departure with the departure drawn through the point of inflection of the trace and the temperature of intersection of the tangent drawn through the point of inflection with the final tangent.
3.3.8 Lifetime spectrometry The lifetime of a positron in matter (gas, liquid or solid) depends on the electronic environment in which it finds itself. When positrons are trapped in the free-volume of a material, the positron lifetime increases with respect to the free-volume, due to the decrease in the electron density of the hole. The intensity of these longer lifetime positrons is related to the free-volume concentration. The principle of operation of lifetime spectrometers is to measure the spectrum of time space between start signals, generated by detecting rapid gamma rays following the release of positrons, and stop signals from one of the annihilation gamma photons. A 25 -μCi
22
NaCl positron source was sealed in aluminum foil. For the spectra
measurements, the source was sandwiched between two identical pieces of the polymer sample. The positron annihilation lifetimes were measured by detecting the prompt γ-ray (1.28 MeV) from the nuclear decay that accompanies the emission of a positron from the Na radioisotope and the annihilation γ-ray (0.511MeV). A fast-fast coincident circuit
22
was used to measure the positron lifetime. The time resolution of the PAL spectrometer was monitored by using a 60Co source. Each spectrum was collected to at least 1 x 10⁶ counts. The lifetime spectra where resolved to finite lifetimes using the PATFIT programme. The free volume hole distributions where determined by using the MELT programme. It was found that three lifetime results give the best fit and most reasonable
45
Chapter 3: Synthesis and characterization of macromonomers and grafts
standard deviations. The shortest lifetime (τ1) is the lifetime of p-Ps, and the intermediate lifetime (τ2) is the lifetime of the positron. The longest lifetime (τ3) is due to the pick-off annihilation of o-Ps triplet Ps. In the current PAL method, τ3 is directly correlated to the free-volume hole size by the following equation:
τ3 =
1
λ3
=
⎛ 2πR ⎞⎤ 1 1⎡ R ⎟⎟⎥ + sin ⎜⎜ ⎢1 − 2 ⎣ Ro 2π ⎝ R0 ⎠ ⎦
3.4
Where τ3 is the o-Ps lifetime (ns), λ3 is the o-Ps annihilation rate (ns-1), R is the freevolume hole radius (Å), Ro=R+ΔR, and ΔR is the electron layer thickness, semiempirically determined to be 1.66 Å. The relative intensity of o-Ps annihilation lifetime, I3, is related to the free-volume hole fraction by the following empirical equation:
fυ = CI 3 V f (τ 3 )
3.5
Where fv is the fraction (%) of the free volume and Vf is the volume (Å3) of free-volume holes calculated from R from equation 3.4 for graft copolymers, C is an empirical constant (0.0018) determined from the specific volume data. Figure 3.4 illustrate the experimental setup of the system for PAL measurement.
Figure 3.4 Standard positron lifetime set-up: PM TUBE, photomultiplier tube, CF DIFF DISC, constant fraction differential discriminator, DELAY, delay box fixed length of 50 Ω cable, TAC, time-to-amplitude converter, MCA, multichannel analyzer [20].
46
Chapter 3: Synthesis and characterization of macromonomers and grafts
3.4 References: 1.
A. Schwartz. Chemical and Engineering News. 1978, 24, 88.
2.
G. Carrot, J. Hiborn, D. M. Knauss. Polymer. 1997, 38, 6401.
3.
A. Kikuchi, T. Nose. Polymer. 1995, 36, 2781.
4.
R. Asami, M. Takaki, H. Hanahata. Macromolecules. 1983, 16, 628.
5.
M. Konas, T. Moy, M. Rogers, A. Shultz, T. Ward, J. McGrath. Journal of Polymer Science part B: Polymer Physics. 1995, 33, 1441.
6.
M. D. Zammit, T. P. Davis. Polymer. 1997, 38, 4455.
7.
H. Pasch, B. Trathnigg. 1997, Berlin: Springer-Verlag Berlin Heidelberg.
8.
B. Trathnigg. "Size-exclusion Chromatography of Polymers". Encyclopedia of Analytical Chemistry. R. A. Meyers. Eds. 2000, John Wiley & Sons Ltd: New York
9.
H. C. Lee, M. Ree, T. Chang. Polymer. 1995, 36, 2215.
10.
H. Philipes. Journal of Chromatography A. 2004, 1037, 329.
11.
C. Wu. Macromolecules. 1993, 26, 3821.
12.
J. Wen, T. Arakawa, J. Philo. Analytical Biochemistry. 1996, 240, 155.
13.
H. Pasch. Advances in Polymer Science. 2000, 150, 1.
14.
http://www.labconnections.com/. [cited 21-09-2005].
15.
J. J. Gagel, K. Biemann. Analytical Chemistry. 1986, 58, 2184.
16.
J. J. Gagel, K. Biemann. Analytical Chemistry. 1987, 59, 1266.
17.
D. Berek. Progress in Polymer Science. 2000, 25, 873.
18.
T. Macko, D. Hunkeler. Advances in Polymer Science. 2003, 163, 61.
47
Chapter 3: Synthesis and characterization of macromonomers and grafts
19.
Y. Brun, P. Alden. Journal of Chromatography A. 2002, 966, 25.
20.
P.G. Coleman. "Experimental Techniques in Positron Spectroscopy". Principles and applications of positron and positronium chemistry. Y. C. Jean, P. E. Mallon, D. Schrader. Eds. 2003, World Scientific Publishing: Singapore. 50.
48
Chapter 4: Results and Discussion
Chapter 4 Results and discussion 4.1 Determination of conversion versus time for the functional termination of polystyrene macromonomers. The anionic polymerization of styrene using butyllithium is a rapid reaction, especially in polar solvents such as tetrahydrofuran. Therefore, it is necessary to determine the conversion versus time for the reaction. The determination of the conversion of styrene monomer was carried out gravimetrically. This experiment was used as a reference to optimize the time at which termination will take place at high conversion with the functionalized terminating agent. Figure 4.1 shows the monomer conversion versus time for the anionic polymerization of styrene. The polymerization takes places rapidly with an increase in the molar mass of the produced polymer and high conversion is achieved within the first 20 minutes of the reaction.
100
% conversion
80
60
40
20
0 0
10
20
30
40
50
60
70
Time (min)
Figure 4.1 Monomer conversions versus time for anionic polymerization of styrene.
Figure 4.2 shows the molar mass distribution of the polystyrene as a function of the conversion. The increase in the molar mass of the polymer is rapid at the beginning of the reaction. At high conversion the polymer has a molar mass (Mw) of 9500 g/mol and a low polydispersity of 1.2.
49
Chapter 4: Results and Discussion
e as re inc
high molar mass polymer
3
in e th n sio er nv co
2
low molar 1 mass polymer
0 4.8
5.0
5.2
5.4
5.6
5.8
6.0
6.2
6.4
6.6
6.8
7.0
retention time (min)
Figure 4.2 Molar mass distribution of styrene as a function of monomer conversion.
A chain extension experiment was preformed to confirm the living nature of the system, before the terminating agent was added, under certain conditions at which all experiments were carried out. (2.7 g) of freshly distilled styrene was added together with (26 g) of dry toluene in a 100 ml round bottom flask and purged with high purity nitrogen gas for about 10 min. (0.11 g) of butyllithium was added via syringe to the mixture. A 5 ml sample was withdrawn after 30 min and precipitated in methanol. The same amount of styrene and toluene (2.7 g, 26 g) was added immediately to the reaction flask after taking the sample and the polymerization reaction was allowed to proceed. Figure 4.3 shows the increase in molar mass of the polymer. The presence of a tail in the SEC trace indicated that some of the chains may have terminated and therefore did not undergo further reaction upon the addition of the styrene monomer. Nevertheless, the majority of the chains did have a living nature, as indicated by the shift in molar mass distribution.
50
Chapter 4: Results and Discussion
starting material increase in conversion
detector response
0.8
0.4
0.0 3.5
4.0
4.5
5.0
5.5
Log M
Figure 4.3 Molar mass distributions of the chain extension of the anionic polymerization of styrene, Mn= 4472 and 7109 before and after extension.
The results achieved at this point provides very important information regarding the optimum conditions required to obtain targeted molar mass of 100% conversion, with a high efficiency and allows for the determination of the time at which the polymerization reaction should be terminated, which is 30 min. Using this information, different macromonomers were synthesized by termination with two different functional terminating agents. The characteristics and formulation of the linear macromonomers of polystyrene are summarized in Tables 4.1 and 4.2.
4.2 Synthesis of macromonomers 4.2.1 Synthesis of (p-vinylbenzyl) polystyrene macromonomer The end-capping technique was used in this study in order to achieve control over the molecular weight, and functionality. Styrene macromonomers terminated via p-vinyl benzyl chloride, involving the direct coupling reaction between living polystyrene with pvinyl benzyl chloride, were carried out in a mixed solvent (toluene and THF). It emerged that these kinds of reactions are dependent on solvent polarity. Asami et al. [1] found that when the reaction was carried out in a mixed solvent of a hydrocarbon such as toluene and a polar solvent such as THF, the coupling reaction was quantitative, whereas when the reaction was carried out in a hydrocarbon solvent such as toluene,
51
Chapter 4: Results and Discussion
the coupling reaction involved some side reactions which formed dimeric, terminated living polystyrene, by a one-electron transfer mechanism [1, 2]. These side reactions are shown in Scheme 4.1. A similar result was found in this study where in some cases the dimeric macromonomer was formed. PSt H2C
H C
H2 H C C
CH2-Cl C H
CH2
Scheme 4.1 Mechanism of one electron transfer for formation of dimmer [2].
The SEC chromatograms of some of the macromonomers are presented below in Figures 4.4. The bimodal curve of PSVB in Figure 4.4 (a) was obtained when the coupling reaction between living polystyrene with p-vinyl benzyl was carried out at 0 oC in hydrocarbon solvent (toluene). In Figure 4.4 (b) mono-modal distributions were obtained when the coupling reaction was carried at 0 oC in a mixed solvent (polar and non-polar), namely toluene/THF.
0.8
0.8
detector response
detector response
RI UV 254 nm
1.0
UV 254 nm RI
0.4
0.6
0.4
0.2
0.0 0.0 14
15
16
retention time (min)
(a)
17
14
15
16
17
18
19
20
21
22
retention time (min)
(b)
Figure 4.4 SEC traces of styrene macromonomer terminated by VB (detectors response normalized) (a) bimodal styrene macromonomer, (b) mono-modal styrene macromonomer.
The first peak at lower elution time is attributed to be the dimeric-terminated polystyrene macromonomer which has twice the molecular weight of the PSt-Li. The second peak is attributed to PSt-VB macromonomer. The dimeric terminated macromonomer does not
52
Chapter 4: Results and Discussion
affect the grafting process because polymerizable end groups still exist, they simply give double macromonomers grafts onto the backbone, as illustrated in Scheme 4.2. The bulkiness of this dimeric macromonomer will obviously have on effect on the grafting reaction. The macromonomer with the bimodal distribution is designated as the MV3 in the subsequent reactions. All other vinyl benzene-terminated macromonomers were prepared in a mixed solvent and had mono-modal molecular mass distributions.
Scheme 4.2 Illustration of “double macromonomer” graft on the PMMA backbone, yielding double combs.
Table 4.1 shows the compositions and characteristics of the macromonomer produced by the anionic polymerizations of styrene, terminated by VB at 0 oC. The addition of excess terminating agent was to ensure quantitative coupling reactions. MV1 and MV2 are mono-disperse macromonomers prepared in a mixed solvent (toluene/THF 50/50 v/v) whereas MV3 is a bimodal-disperse macromonomer prepared in a hydrocarbon solvent (toluene). Termination efficiency was determined by 1H-NMR and is discussed in section 4.3. Table 4.1 Compositions and characteristics of the productions of the anionic polymerizations of PSVB macromonomers prepared using n-butyllithium as initiator and p-vinylbenzyl chloride as terminating agent PS-VB
Sty (mmol)
BuLi (mmol)
Terminating agent (mmol)
M V1 M V2 M V3
96 8.7 28
20 1.8 3
100 5.8 15
Mn
SEC
2455 1855 15280/6864
MwSEC
PDI
Termination efficiency 1 H-NMR
3768 2489 16197/7183
1.5 1.3 ---
0.7 0.7 0.8
53
Chapter 4: Results and Discussion
4.2.2 Synthesis of (methacryloxypropyl) polystyrene macromonomer In the synthesis of styrene macromonomers terminated by 3-(dimethyl chloro silyl) propyl methacrylate (DMPA), the coupling reaction was fast and efficient even at room temperature. This is because the terminating agent was selected to have a chlorosilane (Si-Cl) at the one end. This Si-Cl bond is highly reactive towards nucleophiles [3], the efficiency of terminating agent depends on the steric environment of the Si-Cl groups and on the reactivity of the living chain-ends [4, 5]. The reactivity of the chain ends increases with a decrease in the steric hindrance and an increase in charge delocalization.
The chlorosilanes generally give a more efficient and quantitative
termination of the living anionic system, than the C-Cl equivalent. In Figure 4.5 SEC traces show the mono-modal curve in the PSDMPA , and illustrates the efficiency of the termination reaction, even at room temperature, and without any affect of the solvent polarity, like in the case of the vinyl benzyl terminated where the polarity and reaction temperature play an important role in terms of the shape of the macromonomer.
RI UV 254nm
detector response
0.8
0.4
0.0 14
15
16
17
18
19
retention time (min)
Figure 4.5 SEC traces of styrene macromonomer terminated by DMPA (detectors, response normalized).
Table 4.2 shows the compositions and characteristics of the anionic polymerizations of styrene, terminated by DMPA. Equal molar amounts of terminating agent and initiator were added in these reactions. Termination efficiency illustrates that some styrene
54
Chapter 4: Results and Discussion
chains had died before the termination took place. Nevertheless a high termination efficiency was achieved.
Table 4.2 Anionic polymerization compositions and characteristics for the synthesis of PSDMPA macromonomers using n-butyllithium as initiator and 3-(dimethyl chloro silyl) propyl methacrylate as terminating agent
PS-DMPA
Sty (mmol)
BuLi (mmol)
Terminating agent (mmol)
M D1 M D2 M D3 M D4
96 96 48 96
10 2 9.9 10
10 2 9.9 10
Mn
SEC
5873 19490 4782 4178
MwSEC
PDI
Termination efficiency 1 H-NMR
9574 27393 7476 4779
1.6 1.4 1.5 1.1
0.7 0.8 0.9 0.7
Termination efficiency was calculated from the ratio of the methyl group δ : ppm 0.5-0.8 (CH3) of n-BuLi and methylene group δ : ppm 5-6 (CH2) in the 1H-NMR spectra of macromonomers. The termination efficiency values of both types of terminating agents indicate that not all the chains were terminated by the terminating agents. This subsequently had an effect on the graft copolymerization formation reactions. Termination efficiencies of between 70% and 90% were obtained as will be discussed later in Section 4.4.
4.3 Characterization of the macromonomers 1
H-NMR spectra of the macromonomers showed that terminating agents were present in
the polymer after precipitation in methanol. Unreacted terminating agent was removed under vacuum. Typical 1H-NMR spectra of the styrene macromonomers terminated with VB and DMPA are shown in Figures 4.6 and 4.7 respectively. The peaks at δ : ppm 5.1 and, 5.5 (CH) and at 5.5 and, 6.15 (CH) appear in all
1
H-NMR spectra of
macromonomers, which proves the existence of end functional groups in the synthesized macromonomers.
55
Chapter 4: Results and Discussion
c
H3C
e
d
a
H
n
f
b
C
f
f
f
f
H
c
f
d a b
8
7
e
6
5
4
3
2
1
0
ppm Figure 4.6 1H-NMR spectrum in CDCl3 of styrene macromonomer terminated by p-vinyl benzyl chloride.
d H3C
f
H3 C
b
H C H3
Si
O C H3
C
a
H
C
n
c
f
f
f
f
e O
f
8
7
6
e
c
b
a
5
4
3
2
1
d
0
ppm 1
Figure 4.7 H-NMR spectrum in CDCl3 of styrene macromonomer terminated by 3-(dimethyl chloro siliy) propyl methacrylate.
56
Chapter 4: Results and Discussion
FTIR spectra of the purified macromonomers were recorded to confirm the presence of the terminating agent on the macromonomers. In Figure 4.8, the FTIR spectrum of the styrene macromonomer terminated by DMPA, the excess terminating agent was removed by washing the macromonomer several times with methanol and drying in vacuum oven for 24 h. The appearance of the absorption band of the carbonyl group in the spectrum confirms that termination reaction has occurred. The transmission bands of the polystyrene macromonomer are similar to a typical styrene polymer. The appearance of absorption bands of aromatic group at 694-755 and 1595 cm-1 can be used as an indication of the presence of styrene in the graft.
T%
80
60
C=O
40
Aromatic C=C
3
C-H sp
20
Aromatic C-H 0 4000
3500
3000
2500
2000
1500
1000
500
-1
wavenumber (cm )
Figure 4.8 FTIR spectrum of styrene macromonomer PSDMPA.
The
spectrum
shows
the
characteristic
transmission
bands
of
the
styrene
macromonomers. The position of these bands and functional groups responsible for them are outlined in Table 4.3.
57
Chapter 4: Results and Discussion
Table 4.3 FTIR data of the functional groups of styrene macromonomers terminated by DMPA [6] Wavenumber (cm-1)
Functional group
Spectral range (cm-1)
700 758
Ring CH(5 adjacent)
715-681 785-731
907
CH(5 adjacent)
926-895
1028
CH
1040-1016
1070
CH
1082-1053
1155
CH
1165-1145
1182
CH
1196-1177
1249
CH
1261-1240
1451 1491 1600 1602 2845,2924,3024,3064,3084
Ring Ring C=O Ring CH
1461-1432 1504-1481 1600-1609 1612-1580 3096-2838
Bond mode
Peak intensity
Bend Deformation Deformation out of plane Bend (in-plane H bend) Bend (in-plane H bend) Bend (in-plane H bend) Bend (in-plane H bend) Bend (in-plane H bend) Stretching Stretching Stretching Stretching Stretching
Strong Strong Medium Medium Weak Weak Weak Weak Strong Strong Strong Strong Strong
4.4 Graft formation The copolymerization of styrene macromonomers with MMA to form graft structures was performed with different feed compositions of macromonomer to monomer (50, 30, 20, 10, and 5 wt %). The copolymerization reaction was carried out in freshly distilled and dried toluene at 70 oC for 24h. AIBN was used (1 w %) as the initiator. The amount of toluene was determined so that the polymer would constituted 20 weight percent. Table 4.4 illustrates the formulation and characterization of graft copolymer with different terminated macromonomers and macromonomer content and length. The yield was determined gravimetrically after extraction of the unreacted macromonomer (as discussed in Section 4.4.1). The average number yield of the graft copolymers was 87.2% for VB terminated macromonomer and 89.4% for the DMPA terminated macromonomer. This shows that the DMPA terminated macromonomers copolymerizes better with MMA than VB. This could be due to the similarity between the end function group of DMPA, which is a methacrylate, and the backbone of the graft methyl methacrylate.
58
Chapter 4: Results and Discussion
Table 4.4 Formulation and characterization of graft copolymers
Sample code*
VB
Short branch
DMPA
Medium branch Long branch
Short branch
Medium branch Long branch
G50V1 G30V2 G20V3 G10V4 G5 V5 G10V6 G5V7 G10V8 G5V9 G50D1 G30D2 G20D3 G10D4 G5D5 G10D6 G5D7 G10D8 G5 D9
Macro monomer (g)
Monomer (g) (MMA)
AIBN (g)
2.1 1.2 0.8 0.2 0.1 0.2 0.1 0.2 0.1 1.6 1.0 0.7 0.2 0.1 0.2 0.1 0.2 0.1
2.1 2.9 3.3 1.8 1.9 1.8 1.9 1.8 1.9 1.6 2.3 2.6 1.8 1.9 1.8 1.9 1.8 1.9
0.020 0.030 0.030 0.002 0.002 0.002 0.002 0.002 0.002 0.016 0.020 0.030 0.002 0.002 0.002 0.002 0.002 0.002
Graft copolymer
Yield# % of graft
PDI Mn (g/mol) 4
4.5X10 4 2.5 X10 4 2.9 X10 4 4.1 X10 4 4.1 X10 4 7.8 X10 4 9.8 X10 4 3.9 X10 4 4.1 X10 4 1.3 X10 4 1.6 X10 4 1.0 X10 4 3.4 X10 4 4.7 X10 4 3.1 X10 4 4.3 X10 4 2.7 X10 4 3.5 X10
MW (g/mol) 7.1X10⁴ 2.9 X10⁴ 3.9 X10⁴ 6.6 X10⁴ 6.7 X10⁴ 1.5 X10⁵ 1.9 X10⁵ 6.1 X10⁴ 6.5 X10⁴ 4 2.8 X10 3.0 X10⁴ 2.2 X10⁴ 4.5 X10⁴ 8.0 X10⁴ 5.4 X10⁴ 7.3 X10⁴ 4.4 X10⁴ 6.9 X10⁴
copolymer
1.5 1.6 1.3 1.6 1.6 1.9 2.0 1.5 1.6 2.1 1.9 2.1 1.3 1.7 1.7 1.7 1.6 1.9
86 82 86 89 87 89 90 85 91 87 84 90 90 94 86 90 90 94
* Where G stands for graft, the subscript number represents the percent of macromonomer and V/D represents the type of terminating macromonomer. # after extraction of unreacted macromonomer.
Figure 4.9 shows an example of a SEC trace of the graft copolymer of PMMA-g-PSDMPA (10 wt % macromonomer) before extraction. A bimodal distribution curve was obtained after the copolymerization reaction. The first peak at a lower retention time is attributed to the graft copolymer. The red line represents the RI response of the graft corresponding to the graft copolymer PMMA-g-PS. The UV detector response is shown by the blue line, and shows the presence and distribution of the styrene macromonomer in the PMMA backbone. The second peak is attributed to the presence of the unreacted PS macromonomer since there is a strong UV response for this peak. This may be expected. In general, the reactivity of the macromonomers depends on the functional end groups [7]. The presence of the macromonomers affects the degree of polymerization in terms of increasing the viscosity, which results in a decrease in the diffusion effect [8-10]. The segment density around the propagation radical site of the formed copolymer is relatively large, and increases with the degree of polymerization, making the insertion of the macromonomer more difficult. The incompatibility issue between the backbone and the branches also plays a large role in decreasing the
59
Chapter 4: Results and Discussion
reactivity of the macromonomer, as discussed by Ito et al. [7] Hong et al. [10], Meijs and Rizzardo [11]. In addition the efficiency of termination was not 100%, which lead to nonreactive macromonomers. UV(254 nm) RI
detector response
0.8
0.4
0.0 12
13
14
15
16
17
18
19
retention time (min)
Figure 4.9 SEC traces of un-extracted graft copolymer MMA-g-PSDMPA (10 wt %).( Note: RI and UV detector response have been normalized)
4.4.1 Extraction of the unreacted macromonomer A procedure used to extract unreacted macromonomer from the graft copolymers was reported by Kikuchi and Nose [12]; hexane was used as non-solvent and toluene as solvent. SEC was used to track the efficiency of this process, as shown in Figure 4.10. A certain amount of the graft mixture was dissolved in toluene and then poured into a beaker containing hexane. The precipitated material was the graft copolymer with methyl methacrylate homo-polymer, and the unreacted styrene macromonomer remained soluble in hexane. The percentage of graft formation was calculated gravimetrically after extraction of the unreacted macromonomer. The formulation and characterization of the grafts are tabulated in Table 4.4.
60
Chapter 4: Results and Discussion
before extraction unreacted macromonomer
after extraction
12
14 16 retention time (min)
18
Figure 4.10 SEC trace (RI detector) showing the efficiency of the extraction procedure.
4.5 Polymacromonomer-polystyrene Homopolymerization of the macromonomers will lead to the formation of the densely branched or brush type polymer. Homopolymerization of styrene macromonomers were carried out via free radical polymerization using AIBN 0.1 wt% to macromonomer and toluene solvent, and anionic polymerization using BuLi and toluene solvent. In the case of free radical polymerization (a) the shift in the maximum peak toward low retention time was small and without any significant shoulder. On other hand the anionic polymerization showed that a significant Homopolymerization has occurred as indicated by the peak at a lower retention time. In this case there is also a significant amount of the unreacted macromonomer after the reaction. Figure 4.11 of the formed polymer shows the presence of unreacted macromonomer. In Table 4.5 illustrate the Mn and Mw values of synthesized polymacromonomers via both techniques free radical and anionic polymerizations. In both case there is only a relatively small increase in the molecular mass indicating only a very limited reaction this is expected due to the extreme bulkiness of the macromonomers.
61
Chapter 4: Results and Discussion
Table 4.5 Molar masses of macromonomers and formed polymacromonomer via free radical and anionic polymerizations Mn
Mn
Macromonomer
Mw
polymacromonomer
3
3
polymacromonomer
Polymacromonomer (a)
2.9X10
4.6 X10
5.9 X10³
Polymacromonomer (b)
1.1X10³
2.8X10³
2.9X10³
1.0
1.0
macromonomer polymacromonomer
polymacromonomer macromonomer 0.8
detector response
detector response
0.8
0.6
0.4
0.6
0.4
0.2
0.2
0.0
0.0 5.5
6.0
6.5
7.0
7.5
8.0
8.5
9.0
retention time (min)
a)
13
14
15
16
17
retention time (min)
b)
Figure 4.11 SEC traces of polymacromonomer and macromonomer (a) free radical polymerization, macromonomer is MD3. (b) Anionic polymerization. (not different calibration curve and instruments were used for a) and b)).
4.6 Styrene graft styrene macromonomer In the case of the styrene graft styrene macromonomer the polymerization was carried out at low percentages of macromonomers (10 and 5 wt %), using the VB terminated macromonomer. The result obtained by SEC was shown in Figure 4.12. Two peaks appeared in the diagram: one at low retention time, which was attributed to the graft copolymer, and the second peak attributed to the unreacted macromonomer. Since the backbone and the branches have the same chemical composition, unlike the previous grafts where the backbone is PMMA, the separation of unreacted macromonomers using the solvent extraction techniques on the graft is extremely difficult.
62
Chapter 4: Results and Discussion
1.4
UV(254 nm) ELSD
graft polymer homo-polymer
1.2
detector response
1.0
unreacted macromonomer
0.8
0.6
0.4
0.2
0.0 4
5
6
7
8
retention time (min)
Figure 4.12 SEC traces of PS-g-PS (5 wt% macromonomer) graft polymer and unreacted macromonomer.
4.7 Characterization of (MMA-g-PS) graft copolymers after extraction 4.7.1 SEC analysis SEC equipped with a dual detector system (RI and UV) was used to investigate the graft copolymers. The UV detector was set up at a wavelength of 254 nm, which is suitable for detecting styrene aromatic rings. UV response was observed for all the graft copolymers. The distribution of the UV response gives an idea of the branch content in the graft. Figure 4.13 shows an example of the SEC of the graft copolymer PMMA-g-PS after extraction of the unreacted macromonomer. The distribution of the UV response associated with the styrene branches on the methyl methacrylate backbone indicates that the styrene branches are distributed throughout the graft polymer. This was observed for all the synthesized grafts with different macromonomers contents. In the figure below the UV response almost mirrors the RI response, but there is a significant difference at the longer retention times (note detector response has been normalized). This is an indication that there may not be a uniform distribution of the graft in the polymer. This was further investigated using LC-transform FTIR analysis, and is discussed further in Section 4.7.2
63
Chapter 4: Results and Discussion
UV (254 nm) 0.20 RI
1.2
1.0 0.15
0.10
0.6
UV
RI
0.8
0.4 0.05 0.2
0.00
0.0 10
12
14
16
18
retention time (min)
Figure 4.13 An example of SEC traces of graft copolymer (styrene macromonomer terminated via VB (10 wt %)) illustrating the styrene distribution.
4.7.2 FTIR analysis The graft copolymers were further characterized using FTIR spectroscopy, after extracting the unreacted macromonomer. Figure 4.14 shows the IR spectra of both macromonomers and their copolymers. The following data was used to confirm the formation of graft copolymers. From the figure, the appearance of ester absorption bands in the range of 1230-1280 cm-1, 1700-1752 cm-1 for the graft copolymer, and the aromatic ring absorption of styrene macromonomers at range of 682-720 cm-1 confirms the graft formation. These two absorption bands were used in further investigation as identifying groups of the branch and the backbone in the LC-transform FTIR analysis. The FTIR absorption bands for the graft copolymers with two different terminating agents are listed in Tables 4.6 and 4.7.
64
Chapter 4: Results and Discussion
Graft copolymer Macromonomer 80
60
T%
aromatic C=C 40
3
C-H sp 20
ester group
0
Aromatic C-H 4000
3500
3000
2500
2000
1500
1000
500
-1
wavenumber (cm ) (a)
80
T%
60
aromatic C=C 40 3
C-H sp 20
0 4000
ester group aromatic C-H
Macromonomer Graft copolymer 3500
3000
2500
2000
1500
1000
500
-1
wavenumber (cm ) (b)
Figure 4.14 FTIR spectra of (a) styrene macromonomer terminated by p-vinyl benzyl chloride and graft copolymer MMA-g-PS (b) styrene macromonomer terminated by 3-(dimethyl chloro silyl) propyl methacrylate and graft copolymer MMA-g-PS.
65
Chapter 4: Results and Discussion
Table 4.6 IR absorption data for graft copolymer MMA-g-PS-VB [6]
700 757
Functional group Ring CH(5 adjacent)
Spectral -1 range (cm ) 716-682 784-733
907
CH(5adjacent)
917-895
1028
CH
1041-1000
1069
CH
1082-1055
1154
CH
1163-1146
1181
CH
1198-1172
1240 1271 1383
C-O C-O CH3
1261-1231 1286-1266 1401-1366
1451
CH
1464-1429
1493 1601 1733 2858,2925,2999,3031,3064, 3085
Ring Ring C=O Ring,CH3
Wavenumber (cm-1)
Bond mode
Peak intensity Strong Strong
1505-1482 1613-1581 1752-1706
Bend Deformation Deformation out of plane Bend (in-plane H bend) Bend (in-plane H bend) Bend (in-plane H bend) Bend (in-plane H bend) Stretching Stretching Stretching Bend (in-plane H bend) Stretching Stretching Stretching
3097-2839
Stretching
Medium Medium Weak Weak Weak Strong Strong Medium Weak Strong Strong Strong Strong
Table 4.7 IR absorption data for graft copolymer MMA-g-PS-DMPA [6]
CH(5 adjacent)
Spectral -1 range (cm ) 710-690 780-725 860-830 920-905
990 1031
CH
1001-955 1041-1025
1071
CH
1080-1060
1150
CH
1161-1141
1196
CH
1201-1191
1241 1276 1386 1457
C-O C-O CH3 CH
1261-1231 1286-1266 1401-1366 1466-1431
1492 1601 1732 2852,2925,2997,3031,3064
Ring Ring C=O Ring
1501-1482 1617-1597 1752-1706 3090-2839
Wavenumber (cm-1) 699.9 755.5 840 910
Functional group Ring CH(5 adjacent)
Bond mode
Peak intensity
Bend Deformation
Strong Strong Medium Medium
Deformation out of plane Bend (in-plane H bend) Bend (in-plane H bend) Bend (in-plane H bend) Bend (in-plane H bend) Stretching Stretching Stretching Bend (in-plane H bend) Stretching Stretching Stretching Stretching
Strong Medium Variable Strong Strong Strong Variable Medium Strong Strong Strong Strong Strong
66
Chapter 4: Results and Discussion
4.7.3 1H-NMR analysis 1
H-NMR analysis of the graft copolymers after extraction also confirmed the presence of
branched polystyrene in the copolymers. Figure 4.15 shows a typical 1H-NMR spectrum of the graft copolymer, after extraction of the unreacted macromonomer (using a toluene and hexane system). The spectrum shows characteristic peaks of the methyl methacrylate methoxy group at δ: ppm 3.6 (CH3-O), and the appearance of characteristic styrene ring peaks in the aromatic region at δ: ppm 6.2-7.5 (CH aromatic) which indicates the presence of styrene branches in the copolymer after extraction. Figure 4.16 shows a typical 1H-NMR spectrum of styrene macromonomer which was extracted from the copolymer mixture. The absence of a methoxy group peak in the spectrum indicates that separation was done successfully. Also, the disappearance of the vinyl protons peaks at δ: ppm 5.22-5.74 (CH vinyl) could be a result of the coupling reaction between two macromonomers, or an indication that the unreacted styrene is the result of styrene macromonomer that were not successfully terminated with terminating agent functionality. The percentage branches in the graft copolymers and chemical composition were calculated from the spectra of each polymer by the integration of the peaks for the methoxy (at δ: ppm 3.6) of the methyl methacrylate (backbone) and the styrene ring (at δ: ppm 6.2-7.5) of the macromonomer (branch) [13, 14], taking into account the number of protons in each peak. The data is presented in Table 4.8.
67
Chapter 4: Results and Discussion
CH 3-OCH-ring
8
7
6
5
4
ppm
3
2
1
0
Figure 4.15 1H-NMR spectrum in CDCl3 of extracted graft copolymer (PMMA-g-PSDMPA terminated).
8
7
6
5
4
3
2
1
0
ppm 1
Figure 4.16 H-NMR spectrum of extracted styrene macromonomer from the PMMA-g-PSDMPA graft copolymer.
68
Chapter 4: Results and Discussion
Table 4.8 Chemical compositions of graft copolymers PMMA-g-PS determined using 1H-NMR Chemical composition #
VB
Short branch
Medium branch Long branch
DMPA
Short branch
Medium branch Long branch
Macromonomer content (wt %)
Sample code
50% 30% 20% 10% 5% 10% 5% 10% 5% 50% 30% 20% 10% 5% 10% 5% 10% 5%
G50V1 G30V2 G20V3 G10V4 G5V5 G10V6 G5V7 G10V8 G5V9 G50D1 G30D2 G20D3 G10D4 G5D5 G10D6 G5D7 G10D8 G5D9
PS aromatic ring
MMA ester group
65 26 7 5 2 11 8 3 5 18 14 11 9 5 3 3 14 9
35 74 93 95 98 90 92 97 95 88 87 89 91 95 97 97 86 91
Relative intensity Si-CH2 ---* ---* ---* ---* ---* ---* ---* ---* ---*
2.5 0.5 2.5 0.5 1.0 1.0 1.0 1.5 4.5
*CH2-O- or Si-CH2 do not exist in the macromonomers, # percentage from 1H-NMR
In the case of styrene macromonomer terminated with methacryloxypropyl, the percentage of branches to methyl methacrylate backbone was determined using either the CH2-O- or CH2-Si in the macromonomer to the methoxy group CH3-O- in methyl methacrylate, as shown in Figure 4.17. using the following equation (4.1) [14] with change δ ring by δ CH 2 Si . The data tabulated in Table 4.5. shows the results for the CH2-Si peaks integration.
δ CH O 3
% PMMA =
δ CH O 3
N CH 3O
N CH 3O +
X 100
δ Ring
4.1
N Ring
where % PMMA is the percentage of PMMA in the graft copolymer, δ CH 3O and δ Ring are the integration intensities of the CH3O and styrene ring protons, N CH 3O and NRing are the numbers of protons.
69
Chapter 4: Results and Discussion
CH3
O O H3C
CH3
CH3
O
O
O CH2
CH3
O
O
H3C
CH3
CH3
O H3C
CH3
CH3
O O
O O
H3C
O O
H2C
H3C CH2
n
H2C Si
CH3
n
H3C
(a)
(b)
Figure 4.17 Illustration of the difference between groups in grafts (a) PMMA-g-PSVB, and (b) PMMA-g-PSDMPA.
Figure 4.18 shows the position of the peaks corresponding to Si-CH2 and CH2-O- in PMMA-g-PSDMPA, used to determine the branch density.
Si-CH2
CH2-O-
3.8 ppm
0.9
0.5
Figure 4.18 1H-NMR spectra shown the specific peaks of Si-CH2 and CH2-O-, for PMMA-gPSDPMA.
The styrene content in the graft copolymers, as determined by 1H-NMR, was between 2.3-65% for MMA-g-PSVB and 2.9-18% for MMA-g-PSDMPA (Table 4.5).
70
Chapter 4: Results and Discussion
4.7.4 Determination of molecular mass and graft density of polymer The chemical composition listed in Table 4.6 describes the overall styrene content without taking into account the branch length (molar mass of macromonomer). The following equation suggested by Fuente et al. [15] and Capek et al. [16] (4.2 and 4.3) were used to calculate the average number of branches (Ngraft) per molecule for similar graft copolymer to calculate the number of branches with regard to branch length (molar mass of macromonomer).
M wtotal − M wPMMA = ∑ M wMMA− g − PS
4.2
and
N graft
∑M =
MMA− g − PS w
M PSw
4.3
where M wtotal is the apparent weight average molecular weight of graft copolymer determined by SEC, M wPMMA is the apparent weight average molecular mass of PMMA homo-polymer obtained under the same conditions of copolymerization, except in the absence of macromonomer, M wMMA− g − PS is the estimated apparent weight average molecular mass of all PS chains that are attached to the graft, and M wPS is the apparent weight average molecular weight of the styrene macromonomer. These equations do, however, not give a good indication on the average number of branches, because it is based on the estimate that PMMA homo-polymer polymerized exactly to the same degree of polymerization as in the copolymerization reaction. In this study an alternative means for determining the average number of branches has been used. To determine the (Ngraft) average number of branches per molecule and (Me) average molecular mass between nearest-neighbor branch points Kikuchi and Nose equations 4.4, 4.5 were used [17].
N graft =
Mw W
4.4
M w(branch )
and
71
Chapter 4: Results and Discussion
Me =
M w (1 − W
)
4.5
N graft
where Mw is the apparent weight average molecular weight of graft copolymer determined by SEC, W
is the apparent PS composition measured by 1H-NMR,
M w(branch ) is the apparent weight-average molecular mass of macromonomers. In this study the last two equations were used because they involve only styrene macromonomer composition (determined by 1H-NMR) and weight average molecular mass of branches, and there is no need to use additional parameters. Table 4.9 shows that the average number of grafts per chain was in range of 0.1X1021.8X103. In the case of PMMA-g-PSVB the average number of grafts per chain increased with an increase in the macromonomer content. While in the case of PMMA-g-PSDMPA there was no clear relationship between the average number of graft per chain and macromonomer content. In general the graft copolymer having vinyl terminated macromonomer have
a higher styrene macromonomer content compared to
methacryloxypropyl terminated macromonomer. However, these values of average number of graft per molecules and molecular mass between nearest-neighbor branches points are taken into account the molar mass of the macromonomer which is different from vinyl benzyl terminated to methacryloxyproply terminated macromonomer and molar mass of the graft itself. The calculated numbers of branches values of graft copolymer MMA-g-PSVB for example G50V1, G10V4 were higher number of branches per molecules compared to MMA-g-PSDMPA or G50D1, G10D4 as an example.
72
Chapter 4: Results and Discussion
Table 4.9 The average number of the graft chains per backbone chain (N) and Average molecular mass between nearest-neighbor branch points (Me) estimated via equation 4.5.
VB
Short branch
Medium branch Long branch
DMPA
Short branch
Medium branch Long branch
Macromonomer content (wt %)
Sample code
50% 30% 20% 10% 5% 10% 5% 10% 5% 50% 30% 20% 10% 5% 10% 5% 10% 5%
G50V1 G30V2 G20V3 G10V4 G5V5 G10V6 G5V7 G10V8 G5V9 G50D1 G30D2 G20D3 G10D4 G5D5 G10D6 G5D7 G10D8 G5D9
N
Me 3
1.8X10 2 3.0X10 2 1.2X10 2 1.4X10 1 6.2X10 2 4.2X10 2 4.0X10 1 1.0X10 1 1.9X10 1 6.7X10 1 5.6X10 1 3.2X10 1 5.4X10 1 5.4X10 1 2.3X10 1 2.3X10 1 2.2X10 1 2.3X10
1.3X101 7.1X101 3.1X10² 4.5X10² 1.1X10³ 3.2X10² 4.3X10² 5.9X10³ 3.2X10³ 3.4X10² 4.6X10² 6.1X10² 7.6X10² 1.4X10³ 3.1X10³ 3.1X10³ 1.7X10³ 2.7X10³
Mw (g/mol)
7.1X10⁴ 2.9 X10⁴ 3.9 X10⁴ 6.6 X10⁴ 6.7 X10⁴ 1.5 X10⁵ 1.9 X10⁵ 6.1 X10⁴ 6.5 X10⁴ 2.8 X10⁴ 3.0 X10⁴ 2.2 X10⁴ 7.4 X10⁴ 8.0 X10⁴ 5.4 X10⁴ 7.3 X10⁴ 4.4 X10⁴ 6.9 X10⁴
Table 4.10 shows the molar mass and molar mass distribution of the grafts, and the molar mass of the macromonomers as obtained by SEC. A decrease in the molar mass of the graft copolymers was observed, with an increase in the macromonomer content at the same molar mass of the macromonomers especially for MMA-g-PSDMPA. The decrease in the molar mass of the graft copolymer was observed at low percentage macromonomers content 5 and 10 wt% of both graft copolymers MMA-g-PSDMPA and MMA-g-PSVB with an increase in the molar mass of the macromonomers. This is indicated in Figure 4.19, where the molar masses of the graft copolymers are plotted as a function of the macromonomer molar masses for both the short branched vinyl benzyl terminated and methacryloxypropyl terminated macromonomers and 5% and 10% macromonomer content. These results are in agreement with the finding of Tsukahara et al. and Ito et al. [7-9]. They reported that the molar mass of the styrene macromonomer affects the degree of polymerization, where it decreases with increasing molar mass of the macromonomer due to the diffusion-controlled effect in the macromonomer, and the segment density around the propagation radical site of the formed graft copolymer is relatively large, and increases with the degree of polymerization.
73
Chapter 4: Results and Discussion
Table 4.10 Molar mass and molar mass distribution of graft copolymers PMMA-g-PS and their macromonomers
VB
Short branch
Medium branch Long branch
DMPA
Short branch
Medium branch Long branch
Macromonomer content wt %
Code sample
50% 30% 20% 10% 5% 10% 5% 10% 5% 50% 30% 20% 10% 5% 10% 5% 10% 5%
G50V1 G30V2 G20V3 G10V4 G5V5 G10V6 G5V7 G10V8 G5V9 G50D1 G30D2 G20D3 G10D4 G5D5 G10D6 G5D7 G10D8 G5D9
Graft copolymer Mn 4.5X10⁴ 2.5 X10⁴ 2.9 X10⁴ 4.1 X10⁴ 4.1 X10⁴ 7.8 X10⁴ 9.8 X10⁴ 3.9 X10⁴ 4.1 X10⁴ 1.3 X10⁴ 1.6 X10⁴ 1.0 X10⁴ 3.4 X10⁴ 4.7 X10⁴ 3.1 X10⁴ 4.3 X10⁴ 2.7 X10⁴ 3.5 X10⁴
PDI
Macromonomer Mn
1.5 1.6 1.3 1.9 1.8 1.9 2.0 1.6 1.6 2.1 1.9 2.1 1.3 2.1 1.7 1.7 1.5 1.9
1.8 X10³ 1.8 X10³ 1.8 X10³ 1.8 X10³ 1.8 X10³ 2.4 X10³ 2.4 X10³ 1.5X10⁴/6.8X103 1.5X10⁴/6.8X103 4.7 X10³ 4.7 X10³ 4.7 X10³ 4.7 X10³ 4.7 X10³ 5.8 X10³ 5.8 X10³ 1.9 X10⁴ 1.9 X10⁴
The results show that there is big difference between VB and DMPA in terms of branching density, or (number of branches per molecules), where the VB graft copolymer shows a larger number of branches per molecule compared to DMPA graft copolymers, which indicates greater reactivity of vinyl benzyl terminated towards free radical copolymerization than DMPA terminated. On the other hand the molar mass of the macromonomer plays a big role in branching density, where the VB terminated macromonomer are smaller than DMPA macromonomer which could be the reason for this behavior.
74
Chapter 4: Results and Discussion
7000
short branches VB short branches DMPA
Mn macromonomer
6000
5000
4000
3000
2000
1000 30000
40000
50000
60000
70000
80000
90000
100000
Mn graft copolymer
Figure 4.19 Effect of the molar mass of the macromonomer on the molar mass of the graft and concentration of the macromonomer in the feed.
There are two disadvantages associated with characterizing branch polymer by SEC. The calibration is done using linear polystyrene standards so the determined polymer molecular mass is actually a linear polystyrene-equivalent molecular mass. The elution volume of a branched polymer and a linear polymer of an equal molecular mass differ. Hence, the molecular mass determination of a branch polymer based on linear polymer calibration standards could lead to misinterpretation. The graft copolymers were also characterized using a multi-angle light scattering detector (MALLS) to determine the absolute molecular mass, as Mn result obtained from SEC calibrated with linear polystyrene standard could be misleading. These results are presented and discussed below. To be able to use the MALLS detector the specific refractive index increment, usually referred to as the dn/dc value, which was determined for each of the individual graft copolymer in THF, was calculated from the refractive index detector signal and the concentration of the polymer solution. The molecular weights and molecular weight distributions (Mw/Mn) were calculated using Wyatt Technology Astra software. Peak areas were selected based on the width of the lightscattering peaks. Table 4.11 shows the weight average molecular weight and number average molecular weight of the graft copolymers obtained by MALLS. The molecular weight distributions of the graft copolymer were relatively narrower than those obtained through the normal
75
Chapter 4: Results and Discussion
SEC. The molar mass obtained by MALLS are consistently higher than the molar mass obtained relative to polystyrene. This indicates a difference in molecular size between graft copolymer PMMA-g-PS and polystyrene for the same molar mass. The g values (branching factor) defined by the ratio of the mean square radius of gyration of graft copolymer (branch) to that of the linear polymer of the same molecular mass were also evaluated where l values of linear PMMA were determined using the equation in reference [8, 18] l = 8x10⁻² Mw0.75, using Mw determined from MALLS of the graft copolymers and b values were obtained from SEC-MALLS. The g values thus evaluated are given in Table 4.8. Table 4.11 The number average molar mass and weight average molar mass of the graft copolymers obtained via SEC- MALLS. Macro
VB
Short branch
Medium branch Long branch
DMPA
Short branch
Medium branch Long branch
monomer content
Code
Mn
50% 30% 20% 10% 5% 10% 5% 10% 5% 50% 30% 20% 10% 5% 10% 5% 10% 5%
G50V1 G30V2 G20V3 G10V4 G5V5 G10V6 G5V7 G10V8 G5V9 G50D1 G30D2 G20D3 G10D4 G5D5 G10D6 G5D7 G10D8 G5D9
7.7 X10 4 4.1 X10 4 6.8 X10 4 6.3 X10 4 5.2 X10 5 2.5 X10 4 1.6 X10 4 4.8 X10 4 5.3 X10 4 2.1 X10 4 3.5 X10 4 2.3 X10 4 6.8 X10 4 7.5 X10 4 6.1 X10 4 7.1 X10 4 9.1 X10 4 8.2X10
4
Mw
PDI
9.1 X10⁴ 6.9 X10⁴ 1.0 X10⁵ 8.2 X10⁴ 6.7 X10⁴ 3.5 X10⁵ 3.0 X10⁴ 9.6 X10⁴ 1.1 X10⁵ 3.6 X10⁴ 4.9 X10⁴ 4.6 X10⁴ 8.2 X10⁴ 1.1 X10⁵ 8.5 X10⁴ 9.2 X10⁴ 1.1 X10⁵ 1.1 X10⁵
1.2 1.7 1.5 1.3 1.3 1.4 1.9 2.0 2.1 1.7 1.4 2.0 1.2 1.5 1.4 1.3 1.2 1.4
2 b*
l**
nm
nm
18.4 20.3 11.7 22.3 26.3 17.1 15.2 26.3 27.8 24.1 28.4 18.7 23.9 28.6 36.7 21.5 26.3 30.1
70.7 51 34.5 37.2 31.5 54.5 47 43 44.6 53.6 43.5 45.9 51.9 65.2 53.2 37.1 52.8 44.8
g 0.26 0.39 0.34 0.59 0.83 0.31 0.32 0.61 0.62 0.45 0.65 0.41 0.46 0.43 0.69 0.58 0.49 0.67
* b measured via MALLS, **l of linear PMMA of corresponding Mw estimated from l = 8x10⁻² Mw0.75 [18].
There is a very good correspondence between the branching factor determine via SECMALLS and the graft per backbone chain and average molecular mass between nearest neighbor branch point (Me) shown in Table 4.6.
76
Chapter 4: Results and Discussion
4.8 Chromatographic analysis of graft copolymers 4.8.1 Critical point of adsorption of styrene In order to determine the chemical composition of the graft copolymers chromatographic analyses were carried out on the samples at the critical point of adsorption of styrene. A series of styrene standards were dissolved in a mixed solvent of 50% by volume ACNTHF and injected through two columns, using a system Symmetry 300 C18 and a Nucleosil C18, 5-μm column. The solvent composition was varied from 52.2-49.8 (Vol %) ACN to determine the critical point of styrene. The composition at which the critical point was determined was a 50.2-49.8 ACN-THF mobile phase mixture. At this point of adsorption, the styrene molecules will elute at the same time regardless of the molar mass or hydrodynamic volume. The unreacted PS of the copolymerization mixture will behave chromatographically “invisibly” and separation occurs in the graft according to hydrodynamic volume of PMMA (see Figure 4.20). Under these chromatographic conditions methyl methacrylate graft styrene copolymer elutes in the SEC mode, and unreacted macromonomer styrene elutes at the critical point of styrene. Figure 4.20 shows three modes of separation in the liquid chromatography of macromolecules. SEC mode is on the left side of graph, where the larger hydrodynamic volume polymer (high molar mass polymer) elutes first, followed by the smaller molar mass molecules. This occurred at a solvent composition of 49.8-50.2 ACN-THF. As the solvent composition changed towards an increase in the ACN, the elution of the polymer changed. At the critical point the high molar mass polymer and small molar mass polymer eluted at the same time or elution volume. As the solvent composition changed, further, with a slight increase in the ACN, a dramatic change occurred in the elution mode of the polymer, where small molar mass polymer eluted first, followed by high molar mass polymer. This is the region in which polystyrene elutes in the liquid adsorption mode.
77
Chapter 4: Results and Discussion
5.2
critical mode 5.0 4.8 4.6
adsorption mode Log Mw
4.4 4.2
52.2-47.8 50-50 49.8-50.2 51-49 50.5-49.5 50.2-49.8 ACN-THF ratio (Vol %):
4.0
SEC mode 3.8 3.6 3.4 3.2 6.0
6.2
6.4
6.6
6.8
7.0
7.2
7.4
7.6
7.8
retention time (min)
Figure 4.20 Determination of critical conditions for polystyrene by varying solvent composition.
Figure 4.21 shows the elution of styrene standard with different molar masses at the critical point of styrene. The high molar mass styrene polymer yielded a broader curve when compared to the low molar mass styrene standard. This may be due to the effect of the molar mass on the critical condition.
PS molar mass: 1.0
2535 4000 8500 16700 100000
detector response
0.8
0.6
0.4
0.2
0.0 4
5
6
7
8
9
retention time (min)
Figure 4.21 Chromatogram representing the critical point of adsorption for polystyrene standard.
78
Chapter 4: Results and Discussion
Figure 4.22 illustrates the separation of the graft copolymer PMMA-g-PS from PS macromonomer unreacted at the critical condition of styrene before the extraction of unreacted styrene macromonomers or uncapped macromonomers. The critical conditions were the following: stationary phase C18 and mobile phase ACN-THF (49.850.2), and flow rate 0.5 ml per min. The graft copolymer and methylmethacrylate homopolymer, if present, elute in SEC mode as explain earlier; the large molecules elute first followed by the small ones, and then, the styrene macromonomer which is unreacted elutes at the critical point of styrene. The UV detector response indicates the distribution of the styrene in the graft copolymer and shows that there is no methylmethacrylate homopolymer present. 1.0
1.0
UV (254 nm) ELSD 0.8
0.8
0.6
0.4
UV
ELSD
0.6
0.4 0.2 0.2
0.0
0.0
-0.2 1
2
3
4
5
6
7
8
retention time (min)
Figure 4.22 Typical example of critical point of MMA-g-PS under critical conditions.
Figure 4.23 illustrates the difference in the elution of graft copolymer with a variation in the
type
and
amount
of
the
macromonomer.
The
graft
copolymer
with
methacryloxypropyl terminated macromonomers shows a broader curve compared to the vinyl benzyl terminated macromonomer for a similar composition. This is due to the variation in the chemical composition of the graft copolymers. In addition, the DMPA terminated has a broader chemical composition than both the VB terminated polymers. There is little difference in chemical composition distribution between the 5 % and 10 % VB terminated but there is great different distribution between the DMPA’s terminated polymers. This chemical composition distribution was further investigated as a function of molar mass by looking at the LC-FTIR analysis.
79
Chapter 4: Results and Discussion
2.5
5% short branch DMPA 10% short branch DMPA 10% Short branch VB 5% Short branch VB
deterctor respons
2.0
1.5
1.0
0.5
0.0 2
3
4
5
6
retention volume
Figure 4.23 Chromatogram represents the elution of different graft copolymers at the critical point of adsorption for polystyrene.
4.8.2 LC-transform analysis (chemical compositions as a function of molar mass) SEC LC-FTIR was used for additional characterization and better resolution, to determine the chemical composition of different graft fractions. SEC was coupled to FTIR by the LC-transform system, as was explained in Chapter 3. The FTIR spectra for each position on the collection disc were recorded. The advantage of this technique is that it allows for the relative quantification of the graft copolymer composition as a function of the molecular mass since the relative peak intensities in the IR spectrum are directly related to the concentration of the grafts and main chain backbone. This means that more detailed information on the chemical composition of the copolymer can be obtained than is possible when using a simple IR, UV dual detector analysis. The spectra at each point are present in a 3D diagram, known as a waterfall diagram. An example of such a plot is shown in Figure 4.24. The figure shows the ester group which is associated with the MMA units and the styrene ring absorption associated with the styrene side chains. Figure 4.25 shows the Gram-Schmidt plot generated from the IR spectra shown in Figure 4.24. The data presented in the chromatogram is the summation of all peak intensities over all frequencies and presents a concentration profile for the total fraction. The chemigrams for the ester group and styrene ring were
80
Chapter 4: Results and Discussion
obtained when the peak intensity of the ester absorption at 1752-1706 cm-1 and the styrene ring at 716-682 cm-1 were plotted [19].
ester group
styrene ring
1.0 0.9 0.8
0.6 0.5
rete ntio n ti me (mi n)
Absorbance
0.7
0.4 0.3 0.2 0.1 0.0 3500
3000
2500
2000
1500
1000
500
-1
wavenumber (cm )
Figure 4.24 Waterfall diagram obtained from the 2D separation of SEC LC-transform with FTIR detection of graft copolymer PMMA-g-PS 10% macromonomer content.
In Figure 4.25 the Gram-Schmidt of the 10 wt % graft copolymer macromonomer content terminated via vinyl benzyl is shown. The solid line represents the Gram-Schmidt, which is the summation of the intensities of the individual bands in an IR spectrum, taken at several points during the scanning of the germanium disc. The triangle-line represents the (C=O) intensity at 1730 cm-1 due to methyl ester absorption, contained in the graft copolymer which corresponds to the backbones of the graft. This line has the same shape as the Gram-Schmidt which is expected since the main structure of the graft is methyl methacrylate. The square-line in the same chromatogram represents the aromatic absorption intensity associated with the styrene unit in the graft copolymer, and therefore is an indication of the branch content. This line changes in intensity within the Gram-Schmidt or molar mass distribution. The shape of the chromatogram of the square line shows a higher intensity of the styrene ring at a low retention time, and decreases with an increase in the retention time. That means that the styrene incorporation into the
81
Chapter 4: Results and Discussion
graft copolymer decreases with an increase in the retention time. The line represented by the circle in the plot gives the ratio of the C=O to aromatic absorptions. The circle line in the chromatogram represents the ratio between the C=O to styrene ring and shows a decrease in the styrene incorporation relative to the C=O intensity towards the lower retention time. This indicates that there is a higher polystyrene (branch content) in the larger molar mass polymers since the chromatographic separation is occurring in the size exclusion mode. The smaller molecules on the right of the distribution have much less PS incorporation. These results indicate that the graft copolymer has a relatively large chemical composition distribution, with the higher molecular mass molecules containing a relatively larger number of branches while the smaller molar mass molecules have relatively low branches. C=O intensity ring intensity 40 ratio C=O to ring Gram-Schmidt
detector response
0.4
0.2 20
0.0 0 180
240
300
time (sec)
Figure 4.25 Chromatogram represent Gram-Schmidt of graft copolymer 10 wt % VB terminated macromonomer content.
82
Chapter 4: Results and Discussion
0.8
0.06 15 0.04
10 0.02
300
350
0.0 400
250
Time (sec)
b)
1.5
Gram-Schmidt ratio C=O to ring ester ring
10
1.0
5
0.5
350
400
Gram-Schmidt ratio C=O to ring ring ester
0.4
ratio C=O to styrene ring
a)
300
Time (sec) 10
0.3
detector response
250
0.2
5
0.1
ratio C=O to styrene ring
0.00
detector response
20
ratio C=O to styrene ring
0.02
detector response
1.6
0.04
Gram-Schmidt ratio C=O to ring 25 ring ester
0.08
ratio C=O to styrene ring
0.06
detector response
0.10
Gram-Schmidt ratio C=O to ring ester 2.4 ring
0.08
0.0 0.0 500
600
700
0 800
Time (sec)
200
250
300
350
Time (sec)
c) d) Figure 4.26 Chromatogram representation of the Gram-Schmidt of two series of graft copolymers having macromonomer terminated via DMPA (a,b) (50,10 wt% respectively) , graft copolymers have macromonomer terminated via VB (c,d) (50, 10 wt% respectively).
Figure 4.26 illustrates the Gram-Schmidt plot of a number of chosen grafts with different branch length and macromonomer content. Figure 4.26 (a) shows the plot of the graft copolymer with long branches and 50% macromonomer content MMA-g-PSDMPA. The peak intensity of the C=O group at 1730 cm-1 is illustrated with a triangle line and has the same shape as the Gram-Schmidt curve which indicate that the fraction is mostly methyl methacrylate. The peak intensity of the styrene aromatic ring at 755 cm-1 on the same plot has a similar shape as the Gram-Schmidt curve but shows significant difference which indicate that the styrene ring associated with the side chains are heterogeneously distributed with respect to MMA. The ratio of C=O to styrene ring in the same plot shows an increase in the styrene in the graft with an increased molar mass. This confirmed that the segment density around the propagation radical site in the reaction of the formed graft copolymer is relatively large, and increases with the degree of polymerization, which makes insertion extremely difficult.
83
Chapter 4: Results and Discussion
In Figure 4.26 (b) Gram-Schmidt of graft copolymer and chemigrams, with 10% macromonomer content and short branches MMA-g-PSDMPA. The C=O peak intensity have similar shape as Gram-Schmidt, as well as styrene ring intensity peaks. The ratio of C=O to styrene ring tell us that styrene percentage in the graft decrease with decreasing molar mass of the graft copolymer. In Figure 4.26 (c) the Gram-Schmidt of the graft copolymer and chemigrams for the long branches and 50% macromonomer content MMA-g-PSVB, the ratio of C=O to styrene rings which is represented by the circle in the plot is horizontal and indicates that the grafts are homogeneous distributed in the polymer. In Figure 4.26 (d) Gram-Schmidt and chemigrams of graft copolymer MMA-gPSVB, the percentage of branches in the graft copolymer is higher in the high molar mass graft than low molar mass graft copolymer. The ratio of C=O to styrene ring indicate decrease in styrene with decrease in molar mass of the graft copolymer. From the Figures above there is some difference in the distribution of the styrene into the graft copolymer, figures 4.26 (a) and 4.26 (c) which are attributed to different terminated macromonomer in the graft (DMPA and VB), and the same macromonomer content 50%, in the case of the vinyl benzyl terminated the styrene macromonomer distributed homogenous through the graft copolymer, while in the methacryloxypropyl terminated the styrene macromonomer distributed heterogeneous with a high percentage styrene macromonomers present in the high molar mass graft copolymer. These may be the result of the difference in the molar mass of the macromonomers VB and DMPA. The smaller the molar mass of the macromonomer the more homogenous distributed the macromonomer are while the higher molar mass macromonomers face diffusion problems which may lead to the distribution of the branches (macromonomer) being heterogeneous. These results are similar for a lower percentage macromonomers. This confirms the observation of the critical point analysis were the VB-terminated grafts appear to be more homogeneously distributed in the grafts.
4.9 Thermal analysis of graft copolymer (DSC) The glass transition temperatures of the graft copolymer and the macromonomers were determined using DSC. The results are shown for all graft copolymers and macromonomers in Table 4.12. Styrene macromonomers show glass transition temperatures lower than 100oC. This thermal behavior can be explain using equation 4.6 [20].
84
Chapter 4: Results and Discussion
T g = T g∞ − K M n
4.6
where Tg∞ is the value of Tg for infinitely long chains and K is a constant [20], (about 105) and Mn is the number average molar mass of the polymer. The DSC result of the graft copolymers, in both short and long branches with high macromonomers content, shows the presence of two Tg’s, that indicates the formation of phase separation, where the styrene region aggregates separately from methyl methacrylate. The phase separation was obtained also with low macromonomer content graft with long branches. The Tg decreased with a decrease in the macromonomer content. This is expected due to an increase in the number of (hard chain) styrene chain which has relatively high Tg. The Tg of the grafts are lower than the PMMA homopolymer. These result are similar to results reported by Yousi et al. [21]. Table 4.12 Glass transition temperature of graft copolymers with their molar mass and molar mass of macromonomer
VB
Short branch
Medium branch Long branch
DMPA
Short branch
Medium branch Long branch Backbone Side chain Side chain
Macro monomer content
Sample code
50% 30% 20% 10% 5% 10% 5% 10% 5% 50% 30% 20% 10% 5% 10% 5% 10% 5% 0 100 100
G50 V1 G 30V2 G 20V3 G 10V4 G 5V5 G 10V6 G 5V7 G10 V8 G 5V9 G 50D1 G 30D2 G 20D3 G 10D4 G 5D5 G 10D6 G 5D7 G10 D8 G 5D9 PMMA PS PS
Tg(1) o C 90 88 85 84 82 92 79 87 82 92 87 86 83 72 85 89 52 75 114 68 79
Tg(2) o C 100 99
109 105
109 105 107 101
Mn graft 4
4.5 X10 4 2.5 X10 4 2.9 X10 4 4.1 X10 4 4.1 X10 4 7.8 X10 4 9.8 X10 4 3.9 X10 4 4.1 X10 4 1.3 X10 4 1.6 X10 4 1.0 X10 4 4.4 X10 4 4.7 X10 4 3.1 X10 4 4.3 X10 4 2.7 X10 4 3.5X10 -----
Mn Macro 1.8X10³ 1.8X10³ 1.8X10³ 1.8X10³ 1.8X10³ 2.4X10³ 2.4X10³ 1.5X10⁴/6.8X103 1.5X10⁴/6.8X103 4.7X10³ 4.7X10³ 4.7X10³ 4.7X10³ 4.7X10³ 5.8X10³ 5.8X10³ 1.9X10⁴ 1.9X10⁴ --2.4X10³ 5.8X10³
Figure 4.27 illustrates the effect of the macromonomer content on the glass transition temperature of the graft copolymer. The methylmethacrylate homo-polymer has a Tg of
85
Chapter 4: Results and Discussion
about 114oC, and the styrene macromonomer MV1 has a Tg of 68oC. The Tg values of the grafts are distributed between these two values, and decrease with a decrease in the macromonomer content for both the graft copolymers with short branches (VB and DMPA-terminated). In the case of the VB graft copolymer, the Tg was in the range between 100-85oC, while in the case of DMPA graft copolymer, the Tg was in the range between 109-71oC. 120
short branches VB short branches DMPA
110
o
Tg C
100
90
80
70
0
20
40
60
80
100
Macromonomer content (wt %)
Figure 4.27 Relationship between macromonomer content and Tg of graft copolymers with short branches.
This decrease in the Tg could be explained as follows. At low macromonomer content the branches have space for moving and twisting, which makes the graft copolymer more flexible, lowering the Tg. In the case of the high macromonomer content the graft copolymer branches are packed and entangle with each other, and there is no space for movement. Hence the graft chain moves slowly, and the Tg is high. These results agree with results obtained by Pticek et al. [22]. From the thermal properties of grafts, the Tg is affected by both the molar mass of the macromonomers and the macromonomer content.
86
Chapter 4: Results and Discussion
4.10 Positron lifetime Positron annihilation spectra for the graft copolymer with long and short branches are shown in Figure 4.28 as examples of the data collected for the long and short branches. Each spectrum is composed of three exponential decay functions corresponding to the three mechanisms of positron annihilation. The component with the longest mean lifetime τ3 is that for o-Ps annihilation, which is sensitive to free volume in the sample.
τ1 is associated with (p-Ps) para-positronium, quick annihilation, τ2 is the annihilation of free positron (Ps). The lifetime spectra were resolved for the graft copolymers into three decay components using the PATFIT program. The τ3 and I3 intensity which corresponding to the size and number of free volumes holes respectively were plotted as a function of branch length and macromonomer content as will be shown later.
100000 Normalized counts
10000
Normalized counts
10000
1000
100
10
τ2
τ1
1000
short branch DMPA
τ3
1 0
200
400
600
800
1000
1200
Channel
100
10
τ1 τ2
τ3
long branch DMPA
1 0
200
400
600
800
1000
1200
1400
1600
1800
2000
Channel Figure 4.28 A typical Positron lifetime spectra PALS of synthesized graft copolymer PMMA-g-PS with three different decays decomposing Ps lifetimes fitted using PATFIT.
In Figure 4.29 the o-Ps lifetime, τ3 is plotted against macromonomers content in the graft copolymer. Both short branches with different macromonomer terminated graft copolymer show the similar feature of an increase and the decrease in the τ3 at different macromonomers
content.
However,
short
branched
vinyl
benzyl
terminated
87
Chapter 4: Results and Discussion
macromonomer of the graft copolymers were slightly higher in the τ3 than short branches methacryloxyproply terminated macromonomer of the graft copolymers.
3.1
2.32
short branch DMPA short branch VB 3.0 2.16
2.08
τ3
2.9
2.00 2.8
1.92
Free volume hole radius (Å)
2.24
1.84 2.7 0
20
40
60
80
100
Macromonomer content (wt%)
Figure 4.29 o-Ps lifetime τ3 in graft copolymer PMMA-g-PS as function of macromonomer content (wt %) and radius of free volume holes.
The relative intensity of the o-Ps lifetime (number of free volume) component is also plotted verses macromonomer content. The relative intensity I3 was found to increases continuously with an increase in the macromonomer content as shown in Figure 4.30. The free volume increases with increased macromonomers content due to the increase in the end chain molecules in the graft molecules. The relative intensity I3 of short branches terminated via DMPA of the graft copolymer was found to be slightly higher than short branches terminated via VB of the graft copolymer especially at low macromonomer content. In both short branched graft copolymers the PMMA homo-polymer was found to be higher than graft copolymer at less than 30% macromonomer content. Table 4.13 illustrate the positron data of the graft copolymers
88
Chapter 4: Result and Discussion
VB
DMPA
Macro monomer content
Table 4.13 Positron data, lifetime (τ3) relative intensity (I3) radius of free volume hole (R) free volume (fv) fractional free volume (ffv) and full width at half- maximum (FWHM)
Sample code
τ3 (ns)
Δτ 3(ns)
I3 (%)
ΔI3 (%)
R(Å)
ΔR(Å)
fv(Å )
Δfv(Å )
ffv(%)
Δffv(%)
FWHM
±FWHM
50% 30% 20% 10% 5% 50% 30% 20% 10% 5%
G50 V1 G 30V2 G 20V3 G 10V4 G 5V5 G 50D1 G 30D2 G 20D3 G 10D4 G 5D5
2.054 1.989 2.021 2.074 2.253 2.022 1.978 1.974 2.071 2.105
0.012 0.008 0.018 0.026 0.035 0.013 0.012 0.005 0.007 0.010
29.687 27.705 26.291 20.490 9.540 30.513 27.965 26.188 25.684 25.883
0.320 0.188 0.587 0.649 0.295 0.431 0.324 0.109 0.118 0.203
2.904 2.846 2.875 2.923 3.077 2.876 2.835 2.831 2.919 2.950
0.009 0.006 0.013 0.019 0.023 0.010 0.009 0.004 0.005 0.007
102.63 96.573 99.585 104.61 122.03 99.670 95.487 95.104 104.28 107.54
0.958 0.689 1.412 2.076 2.795 1.083 0.994 0.454 0.558 0.826
5.484 4.816 4.712 3.858 2.095 5.474 4.806 4.483 4.821 5.010
0.110 0.067 0.172 0.198 0.112 0.136 0.105 0.040 0.048 0.078
0.018 0.026 0.022 0.019 0.026 0.026 0.027 0.028 0.010 0.018
0.0001 0.0006 0.0008 0.0006 0.0011 0.0007 0.0014 0.0014 0.0002 0.0005
3
3
89
Chapter 4 Result and Discussion
35
30
I3 (%)
25
20
15
short branch DMPA short branch VB
10
0
20
40
60
80
100
Macromonomer content (w%)
Figure 4.30 o-Ps intensity I3 in graft copolymer PMMA-g-PS as function of macromonomer content (wt %) and branch length.
The computer program MELT was employed to provide the free-volume probability density function PDF vs. free-volume hole radius Å. Figure 4.35 shows the holes volume distribution of the graft and methylmethacrylate homopolymer had very similar Gaussianlike distributions, while the distribution of the highly branch graft (50 and 30%) are broader. For both the graft copolymers with different terminated macromonomers Figure 4.35 a) PMMA-g-PSDMPA, and Figure 4.35 b) PMMA-g-PSVB.
90
Chapter 4 Result and Discussion
PDF
1.0
5% 10% 20% 30% 50% 100% PMMA
0.5
0.0 1.0
1.5
2.0
2.5
3.0
3
Å a)
PDF
1.0
100% 50% 30% 20% 10% 5% PMMA
0.5
0.0 1.0
1.5
2.0
2.5
3.0
3
Å b)
Figure 4.31 Hole size distribution curves (determined using the MELT program) for the graft copolymers a) PMMA-g-PSDMPA, b) PMMA-g-PSVB with various macromonomers content.
Figure 4.32, 4.33 illustrated the full width at half-maximum (FWHM) of hole size distribution curve of each graft copolymer and is plotted verses the macromonomer content, and styrene content (NMR). Figure 4.32 shows that the graft copolymers with low macromonomers content (5 and 10%) have larger free volume radius distribution than the 20% macromonomer content polymer. This is observed in both grafts with the different macromonomer termination, although the graft copolymer containing the vinyl
91
Chapter 4 Result and Discussion
benzyl terminated macromonomer is slightly higher than methacryloxypropyl. From the 20% to 50% macromonomer content the opposite trend was observed in term of different between two macromonomer content, while the free volume radius distribution increases with increased macromonomer content. In the case of the methylmethacrylate homopolymer the free volume radius distribution obtained is higher than all the grafts. Similar feature are obtained when the styrene content is plotted vs. WHFM.
WHFM
0.040
0.035
0.035
0.030
0.030
0.025
0.025
0.020
0.020
0.015
0.015
0.010
0.010
0
20
40
60
80
WHFM
short branch DMPA short branch VB
0.040
100
Macromonomer content (w %)
0.040
short branch DMPA 0.040 short branch VB
0.035
0.035
0.030
0.030
0.025
0.025
0.020
0.020
0.015
0.015
0.010
0.010 0
20
40
60
80
WHFM
WHFM
Figure 4.32 FWHM vs. macromonomer content of graft copolymer
100
styrene content (NMR)
Figure 4.33 FWHM vs. styrene content determined via NMR in the graft copolymer
92
Chapter 4 Result and Discussion
The positron data and distribution of free volume hole radius of the graft copolymers do not show a bimodal distribution despite the detection of two Tg`s via DSC for the higher content macromonomers. In the figures below the relationships between the glass transition temperature and free volume of the graft copolymer are illustrated. Generally, incorporation of styrene macromonomers in the methyl methacrylate chain leads to plasticization of the polymer. This is observed as a lowering of Tg and an increase in the mean size of local free volume fv at room temperature, obtained from the o-Ps lifetime
τ3. Figures 4.34 and 4.35 shows the relationship between o-Ps lifetime and Tg. 120
τ3
Tg
2.1
τ3
2.3
Tg
110
120
110
2.2 100
100
90
Tg
τ3
90
2.1
τ3
Tg
2.0
2.0 1.9
80
80 1.9
70 1.8
70 1.8
0
20
40
60
80
100
0
Macromonomer content
20
40
60
80
100
Macromonomer content
(a)
(b)
Figure 4.34 Illustrate the relationship between glass transition temperature Tg with o-Ps lifetime τ3 and macromonomer content of graft copolymers (a) methacryloxyproply terminated macromonomer, (b) vinyl benzene terminated macromonomer. 120
7
6
110
6
110
5
100
5
100
4
90
4
90
3
80
3
80
2
70
2
70
0
20
40
60
80
Macromonomer content (a)
100
120
ffv Tg
0
20
40
60
80
Tg
ffv Tg
Tg fractional free volume ffv
fractional free volume ffv
7
100
Macromonomer content (b)
Figure 4.35 Illustrate the relationship between glass transition temperature Tg with fractional free volume ffv and macromonomer content of graft copolymers (a) methacryloxyproply terminated macromonomer, (b) vinyl benzene terminated macromonomer.
93
Chapter 4 Result and Discussion
Figure 4.36 shows the relation between glass transition temperature Tg and lifetime τ3 of graft copolymers. This plasticization effect is larger for smaller (5%) macromonomer content in the polymer, while with increasing macromonomer content there is an antiplasticization effect with a corresponding increase in the Tg and decrease in the τ3 values up to a 30% macromonomer content. At higher macromonomer content there is a further antiplasticization effect with an increasing Tg which is accompanied by an increase in the measured τ3. This is the point at which two Tg`s are detected and indicates that phase segregation occurs in both cases when the macromonomer content exceeds 30%. The values in brackets in Figure 4.36 indicate the value of the detection of two Tg`s. It is interesting to note that this point not correspond to the development of a bimodal distribution in the τ3 data however an increased τ3 in measured. This is most probably related to the inability to mathematically resolve the lifetime spectra into two distributions which closely overlap. The result is that the measured τ3 is a result of annihilation events in both phases as well as in the interface between the phases. In multiphase materials there is also the possibility of diffusion of the o-Ps between the different phases.
This feature was observed in both graft copolymers with different
terminating groups (a) methacryloxypropyl and (b) p-vinyl benzyl.
2.12
2.30
2.10
2.25
2.08
2.20
2.06
τ3
τ3
2.15 2.04
2.10
o
(109 C)
2.02
o
(100.5 C)
2.05
2.00 1.98
2.00
o
(105.1 C)
1.96
o
(99.1 C)
1.95 70
75
80
85
90
95
82
84
Tg (a)
86
88
90
Tg (b)
Figure 4.36 Illustrate the relationship between glass transition temperature Tg with o-Ps lifetime τ3 of graft copolymers (a) vinyl benzene terminated macromonomer, (b) methacryloxypropyl terminated macromonomer
94
Chapter 4 Result and Discussion
Figure 4.37 shows the relationship between the fractional free volume and glass transition temperature of the graft copolymers. A similar phenomenon was observed for both copolymer series. 6.5
fractional free volume (ffv)
fractional free volume (ffv)
5.6 6.0
5.5
o
(109 C)
5.0 o
(105.1 C)
4.5
70
75
80
85
90
95
o
(100.5 C)
o
4.8
(99.1 C)
4.0
3.2
2.4
82
84
Tg (a)
86
88
90
Tg (b)
Figure 4.37 Illustrate the relationship between glass transition temperature Tg with fractional free volume ffv of graft copolymers (a) methacryloxyproply terminated macromonomer, (b) vinyl benzene terminated macromonomer.
In the case of the methacryloxyproply macromonomer a similar trend to the τ3 data is observed with an initial decrease in the fv and an increase where phase segregation occurs. The results indicate the there is a better correlation between the τ3 −Tg results than the overall fractional free volume results.
95
Chapter 4 Result and Discussion
4.11 References 1.
R. Asami, M. Takaki, H. Hanahata. Macromolecules. 1983, 16, 628.
2.
G. Carrot, J. Hilborn, D. M. Knauss. Polymer. 1997, 38, 6401.
3.
P. F. Rempp, E. Franta. Advances in Polymer Science. 1984, 58, 3.
4.
J. C. Cho, K. H. Kim, K. U. Kim, S. Kwak, J. Kim, W. H. Jo, M. S. Chun, C. H. Lee, J. K. Yeo, R. P. Quirk. Journal of Polymer Science: Part A: Polymer Chemistry. 1998, 36, 1743.
5.
N. Hadjichristidis, S. Pispas, H. Iatrou, M. Pitsikalis. Current Organic Chemistry. 2002, 6, 155.
6.
M. Hesse, H. Meier, B. Zeeh. Spectroscopic Methods in Organic Chemistry 1997, New York: Georg Thieme Verlag Stuttgart.
7.
K. Ito, S. Kawaguchi. Advances in Polymer Science. 1999, 142, 130.
8.
Y. Tsukahara, K. Mizuno, A. Segawa, Y. Yamashita. Macromolecules. 1989, 22, 1546.
9.
Y. Tsukahara, K. Tsutsumi, Y. Yamashita, S. Shimada. Macromolecules. 1990, 23, 5201.
10.
S. C. Hong, S. Jia, M. Teodorescu, T. Kowalewski, K. Matyjaszewski, A. C.Gottfried, M. Brookhart. Journal of Polymer Science Part A: Polymer Chemistry. 2002, 40, 2736.
11.
G. Meijs, E. Rizzardo. Journal of Macromolecular Science, Reviews in Macromolecular Chemistry and Physics. 1990, C30, 305.
12.
A. Kikuchi, T. Nose. Polymer. 1995, 36, 2781.
13.
H. A. Al-Muallem, D. M. Knauss. Journal of Polymer Science: Part A: Polymer Chemistry. 2001, 39, 3547.
96
Chapter 4 Result and Discussion
14.
M. Van den Brink, M. Pepers, A. M. van Herk, A. L. German. Polymer Reaction Engineering. 2001, 9, 101.
15.
J. Fuente, M. Fernandez-Garcia, E. Madruga. Journal of Applied Polymer Science. 2001, 80, 783.
16.
I. Capek, R. Murgasova, D. Berek. Polymer International. 1997, 44, 174.
17.
A. Kikuchi, T. Nose. Polymer. 1996, 37, 5889.
18.
E. J. Vorenkamp, G. ten Brinke, J. G. Meijer, H. Jager, G. Challa. Polymer. 1985, 26, 1725.
19.
J. Adrian, E. Esser, G. Hellmann, H. Pasch. Polymer. 2000, 41, 2439.
20.
L. H. Sperling. Introduction to physical polymer scienceEds. 2006, Wiley Interscience: New Jersey.
21.
Z. Yousi, L. Donghai, D. Lizong, Z. Jinghui. Polymer. 1998, 39, 2665.
22.
A. Pticek, Z. Hrnjak-Murgic, J. Lelencic, T. Kovacic. Polymer Degradation and Stability. 2005, 90, 319.
97
Chapter 5: Conclusions and Recommendation
Chapter 5 Conclusions and Recommendation 5.1 Conclusions The synthesis of functionalized styrene macromonomers with, p-vinyl benzyl and methacryloxyproply were carried out successfully via anionic polymerization and functionalized via end capping reaction. This is the first example of a simple one step termination reaction with the chlorosilanes terminating agent to produce the methacryloxy terminated styrene macromonomer. This presents a shorter route for the synthesis which normally occurs by introducing intermediated segment to reduce electrophilicity of end group, such as ethyleneoxide and diphenylethyl then end capping with a methacryloxy functional group. The styrene macromonomer terminated by vinyl benzyl was affected by solvent polarity where it gives bimodal distribution in molar mass of synthesized macromonomer when non-polar hydrocarbon solvent was used and a monomodal distribution is obtain when a mixture of polar and hydrocarbon solvents were used. Anionic polymerizations were carried out at room temperature for both macromonomer. A range of macromonomers of various lengths were synthesized (1850, 2455, 4178, 19490 g/mol). 1H-NMR was used to illustrate the functional efficiency of the termination of the macromonomers and was in the range of 0.7-0.9 which indicates good termination efficiency.
Synthesis of different series of graft copolymers (MMA-g-PS) via grafting through (macromonomer technique), by varying the feed ratio of macromonomers to comonomer were carried out free radically. Extraction of graft copolymer from unreacted macromonomer and non-functional macromonomer were successfully done using hexane and toluene as solvent and nonsolvent respectively.
The chemical composition of the graft copolymers (styrene content) have been determined by 1H-NMR. The percentage of styrene macromonomer increases with an
98
Chapter 5: Conclusions and Recommendation
increase in the macromonomer feed. However, the graft copolymer content of the styrene macromonomer terminated by p-vinyl benzyl has higher branches frequencies compared to methacryloxyproply. This illustrates that vinyl benzyl terminated macromonomers are more reactive than methacryloxyproply. Equation 4.4 was used to calculate branch number per molecule and molecular mass between nearest branch points. The results show that the vinyl benzyl terminated macromonomer graft copolymers
are
more
heavily
branched
than
methacryloxyproply
terminating
macromonomer graft copolymers of a similar composition. The molar mass of the graft copolymers generally decreases with an increase in the molar mass of the macromonomers, especially for 5% and 10% macromonomer content. MALLS measurement of the graft copolymers and g (branch factor) were in agreement with the results determined from NMR data.
LCCC at the critical point of styrene was used to confirm the distribution of the branches along the backbone. The graft copolymer with methacryloxyproply terminated macromonomers shows broad chemical composition distributions compared to the vinyl benzyl terminated macromonomer. Coupling of SEC to FTIR analysis via an LC transform device further confirmed that the methacryloxy terminated macromonomer produced graft copolymers with a greater chemical composition distribution relative to the vinyl benzene graft copolymers. This difference in the chemical composition distribution may also be related to difference in the macromonomer chain lengths.
The thermal properties of the polymers have been examined by differential scanning calorimetry to determine the Tg. The Tg is affected by both the number of branched chains and the distribution of branch points. Two Tg’s are detected in the high content graft copolymers and in the graft produce with long chain macromonomers. This indicated that phase segregation occurs in these samples. Incorporation of styrene macromonomers in the methylmethacrylate chain leads to an initial plasticization of the polymer at low macromonomer content for the short chain macromonomer (5-20 %). This is observed as a lowering of Tg, and an increase in the mean size of local free volume fv at room temperature, obtained from the o-Ps lifetime
τ3. Tg increases and free volume hole size decreases with increasing macromonomer
99
Chapter 5: Conclusions and Recommendation
content at higher amount of graft and there is an antiplastisation effect. Above 20% graft content phase segregation occurs as is indicated by the detection of two Tg`s. The free volume characterization of graft copolymers, were measured by the positron annihilation technique. The observed lifetime spectra were decomposed into three components, where the longest lifetime, τ3 was associated with the pick-off annihilation of o-Ps trapped by free volumes. The value of τ3 was in range of 1.8 - 2.25 (ns) for different macromonomer content. The variation in the mean free volume hole size (τ3) shows a good correlation with Tg below the point where phase segregation occurs in the copolymers.
5.2 Recommendation It has been shown in this study that the methacryloxypropyl terminated styrene macromonomer can easily be produced with good molecular mass control using the chloro silane functional terminating agent. Further control over the structure of the graft copolymer could be obtained by using a controlled free radical polymerization such a RAFT during the copolymerization reaction.
Few studies have been done on phase segregated system such as those in this study using free volume parameter determined using positron annihilation spectroscopy. The results of this study indicate that when phase segregation occurs there is no simple relationship between the measured free volume properties and other properties such as Tg. This relationship warrants further study.
100