Synthesis and characterization of high-temperature hexagonal P2-Na0.6 MnO2 and its electrochemical behaviour as cathode in sodium cells A. Caballero,a L. Herna´n,a J. Morales,*a L. Sa´nchez,a J. Santos Pen˜aa and M. A. G. Arandab a
Departamento de Quı´mica Inorga´nica, Facultad de Ciencias, Universidad de Co´rdoba, Campus Universitario de Rabanales, Edificio C-3, 14071 Co´rdoba, Spain. E-mail:
[email protected] b Departamento de Quı´mica Inorga´nica, Universidad de Ma´laga, 29071 Ma´laga, Spain Received 28th September 2001, Accepted 23rd January 2002 First published as an Advance Article on the web 22nd February 2002
A layered sodium manganese oxide, Na0.6MnO2, stable at temperatures above 800 uC, was synthesized by using a sol–gel method that employs Mn(acac)3 (ac ~ acetylacetonate), Na2CO3 and propionic acid to form the resin framework. This layered bronze possesses a hexagonal, P2-type structure, in which the distortion associated with Mn31 is hardly perceptible. It reacts slowly, though reversibly, with atmospheric moisture, which causes ˚ , through intercalation of water molecules into the interlayer spacing in the structure to increase by ca. 2.5 A the interlayer gap occupied by Na1 ions. The anhydrous material was tested as a cathode in sodium cells. Although the electrochemical intercalation of Na1 occurs in two steps, the host retains its main structural features, with a slight tendency in the interlayer spacing to contract as the sodium content increases. The similarity between the discharge and charge profiles of the first cycles reveals a quasi-reversible nature in the intercalation process and that the cell can deliver a constant specific capacity of ca. 140 A h kg21 at 0.1 mA cm22 when cycled in a voltage window of 3.8–2.0 V. However, the continuous strains and distortions resulting from the insertion and extraction of Na1 ions cause the host structure to gradually collapse and yield an amorphous material after the first eight cycles. This leads to a progressive reduction of the cell capacity, irrespective of the specific voltage window used.
Introduction Interest in layered NaxMnO2 (0v x ¡ 1) phases, first reported in 1971 by Parant et al.1 have been fuelled in the last few years by their use as precursors of layered LixMnO2, which in turn have been tested as materials for manufacturing Li-ion cells.2–6 In these compounds, the alkali metals are coordinated to six oxygen atoms in an either trigonal prismatic (P) or octahedral geometry (O). In addition to these symbols, the nomenclature of these layered compounds includes a number that denotes that of distinguishable alkali metal layers (e.g. P3 means that the environment is prismatic and the unit cell is consists of three MnO2 sheets). The P2 phase proved the best choice in terms of battery performance among the different NaxMnO2 phases used as precursors of Li compounds tested in lithium cells.6 This is also the case with the Na–Co–O system: a phase of nominal composition Na0.67CoO2 belonging to the P2 structural type possesses the best cyclability and capacity properties among Na cells.7 Four main methods have been used as synthetic pathways for these layered NaxMnO2 phases belonging to the structural P2 type, namely (i) high-temperature methods under oxygen pressure;1 (ii) thermal decomposition of NaMnO4;8 (iii) mild hydrothermal synthesis;9 and (iv) a sol–gel approach based on the reduction of permanganate by organic or inorganic compounds.5,10,11 In general, these solution methods involve multistep chemical reactions, so ensuring the obtainment of high-purity materials, which entails carefully controlling temperature, concentrations and pH in each individual step. One other disadvantage of these methods is the small size and poor crystallinity of the particles obtained due to the low 1142
temperatures used. In addition to the difficulty involved in accurately characterizing the materials using X-ray diffraction methods, these characteristics can have adverse effects on their performance as cathodes in lithium and sodium cells; also, their high reactivity can cause the electrolyte to decompose. Moreover, these methods yield hydrated phases as it is rather difficult to remove all the water without collapsing the layer framework. Raising the temperature to eliminate the water and increase the particle crystallinity often fails as it causes a structural rearrangement that yields tunnel-like structures or even degradation to Mn3O4 above 600 uC.11 The results of extensive research suggest that this structure can hold variable Na1 contents in the range 0.3 v x v 0.7. Recently, Paulsen and Dahn12 reported the preparation of Na2/3[Li1/6Mn5/6]O2 by heating a stoichiometric mixture of Mn2O3, Na2CO3 and Li2CO3 at 800 uC in the air, followed by quenching in liquid nitrogen. According to these authors, Li1 stabilizes the P2 structure at low temperatures. In fact, under identical conditions, Doeff et al.13 found the reaction between Mn2O3 and Na2CO3 yielded a solid of nominal composition Na0.44MnO2 with a tunnel structure. In any case, manganese bronzes of nominal composition Na0.7MnO2 1 y (0.05 ¡ y ¡ 0.25) belonging to P2 structural type are complex systems: at least three crystalline systems (hexagonal, orthorhombic and monoclinic) have been used to index their X-ray diffraction profile, depending on the degree of distortion introduced by the Jahn-Teller effect. Attempts at preparing pure, undistorted P2-Na2/3MnO2 above 600 uC in air have failed as the phases obtained belong to monoclinic or orthorhombic systems (the b-Na0.7MnO2 phase, first reported by Parant et al.1). This paper reports the synthesis and characterization of a highly crystalline undistorted P2-Na0.6MnO2 phase that is
J. Mater. Chem., 2002, 12, 1142–1147 This journal is # The Royal Society of Chemistry 2002
DOI: 10.1039/b108830k
stable at temperatures as high as 800 uC. The synthetic procedure is based on a sol–gel method that uses Mn(acac)3 and Na2CO3 as manganese and sodium sources, respectively, and propionic acid to form the resin framework. In addition to yielding particles that are highly uniform in size, this method provides two additional advantages, namely: (i) stable layered phases can be obtained over a wide temperature range and with a variable degree of crystallinity; and (ii) no water is retained in the interlayer spacing. The electrochemical intercalation/ de-intercalation of sodium in this bronze was examined and a preliminary study of its performance as a cathode in sodium cells was conducted.
Experimental Preparation and characterization of materials Sodium manganese bronzes, NaxMnO2, were obtained using a sol–gel method.14 Freshly made Mn(acac)3 and Na2CO3 (Merck) were mixed in a 1.5 Mn : Na atomic ratio and dissolved in boiling propionic acid in a 1 : 0.5 ratio under vigorous stirring. The solution was heated to dryness and a brown gel was formed as a result. The gel was converted into a powder by adding several portions of liquid nitrogen until it was detached from the beaker walls. The powder was manually ground and heated at 400 and 800 uC in air for 2 days. It was stored under vacuum for later characterization. The manganese oxidation state was determined as follows: a known amount of sample was dissolved under a flow of argon in dilute sulfuric acid containing a known excess of Fe21. Oxidation equivalents were determined by back titration with 0.01 M KMnO4. The total Mn and Na contents were determined by atomic absorption spectroscopy. X-ray powder diffraction (XRD) profiles were recorded on a Siemens D-5000 diffractometer using monochromatic Cu Ka1,2 radiation. For identification purposes, intensities were collected at 0.02u (2h) intervals, using 0.06 s step21. The scan conditions used for structural refinement were 15–110u (2h), a 0.03u (2h) step size and 15 s step21. Because of the reactivity of the samples towards moisture, a piece of Mylar plastic was used to isolate the powder; this boosted X-ray absorption and hence decreased the signal-to-noise ratio. Powder morphology was examined by scanning electron microscopy (SEM) under a Jeol JMS 6400 microscope. Preparation of electrochemical cells Electrochemical experiments were carried out in two electrode cells using Na (Strem Chem.) as anode. The cathode was a mixture of active material (80 wt.%), graphite (7.5 wt.% ), acetylene black (7.5 wt.%) and PTFE. The electrolyte used was 1 M NaClO4 in propylene carbonate (PC) and was prepared from anhydrous NaClO4 (Strem Chem.) and propylene carbonate (Merck), both of which were used as received. Cycling tests under galvanostatic conditions were performed on a MacPile from Bio-logic. Cells were assembled under an argon atmosphere in an MBraun dry box.
Results and discussion Composition and structure Chemical analyses were conducted on the sample obtained at 800 uC (viz. the more crystalline as shown below). By combining the Mn average oxidation state (3.3) and the amount of Mn and Na obtained from AAS (Na : Mn atomic ratio 0.56) (both measurements were made in duplicate), the following nominal composition was calculated: Na0.6Mn1.07O2.05. The XRD patterns for the samples prepared at 400 and 800 uC are shown in Fig. 1a and b. In spite of the different heating temperature used, both patterns exhibited identical
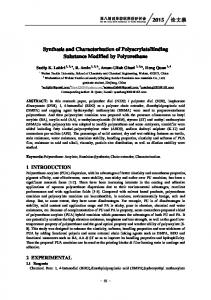
Fig. 1 XRD patterns. (a), (b) and (d) Gel calcined at 400, 800, and 900 uC. (c) Sample (b) exposed to air; #, hydrate phase. (e) Sample obtained by calcining a mixture of Mn(acac)3 and Na2CO3 at 800 uC.
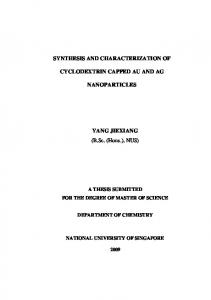
features, especially prominent among which was a strong, ˚ . All other peaks tended to symmetric peak at ca. 5.55 A sharpen on heating, thus suggesting an increased particle crystallinity (consistent with the SEM images of Fig. 2). Particle morphology varied significantly upon heating. Thus, the micrograph obtained at 400 uC shows agglomerates of small particles of irregular shape; in contrast, at 800 uC, the particles adopt a regular lamella-like morphology. This particle shape is very similar to that of the particles obtained under hydrothermal conditions15 or by thermal decomposition of KMnO4 followed by washing with distilled water.16 However, the ˚ in both cases, the strongest reflection appears at ca. 7.0 A increased interlayer spacing being the result of H2O insertion into the interlayer gap.10 In fact, the powders derived from KMnO4 pyrolysis have a K0.30MnO2.11?0.6H2O composition.16 As revealed by the XRD pattern of Fig. 1c, the material exposed to ambient conditions in our experiments also reacted ˚ was clearly slowly with water. Thus, the reflection at ca. 7.0 A observed after one day of exposure. Water uptake was a reversible process, with the parent structure being recovered by mild heating. The crystal structure of Na0.6MnO2 obtained at 800 uC, which exhibited the highest crystallinity, was refined using the Rietveld method17 as implemented in the GSAS software suite.18 The structure was refined between 30 and 110u (2h) owing to the absorption of the plastic and hump due to its pseudo-amorphous structure around 20u (2h). Two different structural models with hexagonal [space group (s.g.) P63/mmc] and orthorhombic symmetry (s.g. Cmcm) respectively, were tested. The preferred orientation observed in the powder J. Mater. Chem., 2002, 12, 1142–1147
1143
Fig. 2 Scanning electron micrographs of the gel calcined at (a) 400 uC and (b) 800 uC. Table 1 Atomic parameters for Na0.6MnO2 in space group P63/mmca Atom
x
y
z
Occupancy factor
Mn 0 0 1/2 1.00 O 1/3 2/3 0.088(1) 1.00 Na(1) 0 0 1/4 0.21(1) Na(2) 2/3 1/3 1/4 0.32(2) a ˚ 2. An overall isotropic temperature factor was refined, Uiso ~ 0.010(1) A
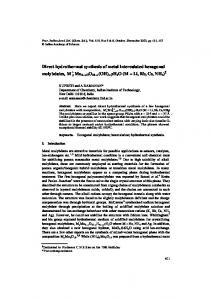
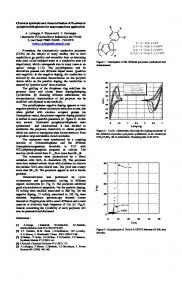
pattern due to the layered nature of the sample was corrected using the March–Dollase algorithm.19 The refinement in the ˚, hexagonal symmetry converged on a ~ 2.8603(4) A ˚ , RWP ~ 11.98% and RF ~ 7.2%. A similar c ~ 11.153(2) A refinement in the orthorhombic symmetry converged on a ~ ˚ , b ~ 4.952(3) A ˚ , c ~ 11.154(2) A ˚ , RWP ~ 11.94% 2.8610(6) A and RF ~ 6.2%. No peak splitting typical of orthorhombic distortion was observed under the experimental conditions used. Moreover, orthorhombic distortion in the lattice (if any) ˚ , which is very was minimal (borth/2 6 sin120 yielded 2.858 A close to the value of parameter a). Based on the similar R-values obtained in both refinements, and on the absence of signals typical of orthorhombic splitting, the structure adopted by Na0.6MnO2 is better explained by a hexagonal model. A neutron diffraction study is planned to verify the structure and to establish the cation distribution with more accuracy. The final structural parameters for Na0.6MnO2 are given in Table 1. The difference between the observed and calculated diffraction profiles are shown in Fig. 3; for comparison, the inset shows the Rietveld plot for the orthorhombic refinement. Fig. 4 is a view of the crystal structure of Na0.6MnO2 with the MnO6 octahedra layers stacked along the c-axis and all Na sites displayed as balls. It should be noted that the refined sodium content obtained in the diffraction study was satisfactorily consistent with the chemical formula obtained from the chemical analysis. Heating the gel at 900 uC (Fig. 1d) caused most peaks to split. However, (00l) reflections also split, which is not consistent with the presence of a single orthorhombic phase (named b-type phase by Parant et al.1). These results can be understood by assuming the presence of two hexagonal phases (an additional a-type phase as cited by Parant et al.) with slightly different interlayer spacing. This sol–gel method thus yields sodium manganese bronzes that adopt a P2-type structure with an ABBA staking sequence for edge-sharing octahedra, MnO6, layers. Octahedral and trigonal prismatic sites are occupied by Mn and Na ions, respectively (see Fig. 4). The organic framework seems to play a significant role in stabilizing a given structure during the synthetic procedure.
Fig. 3 Rietveld plot for Na0.6MnO2 with a hexagonal P63/mmc structure. Inset: similar Rietveld plot with the orthorhombic Cmcm structural model.
1144
J. Mater. Chem., 2002, 12, 1142–1147
Fig. 4 Structure of Na0.6MnO2 exhibiting edge-sharing MnO6 octahedron layers stacked along the c-axis. Between the layers, both types of sodium, Na(1) and Na(2), are shown as balls with smaller and larger radii, respectively. Only y1/3 of the Na sites shown are occupied.
Calcining an intimate mixture of Mn(acac)3 and Na2CO3 at 800 uC in the same mole ratio as in the sol– gel method yields a phase mixture the main component of which corresponds to the tunnel bronze of nominal composition Na0.44MnO2, which was first synthesized by Parant et al.1 (see Fig. 1e). The stability of the layered phase at temperatures as high as 900 uC contradicts the results of Le Goff et al.2 (nominal composition Na0.45MnO2.14) and Jeong and Manthiram5 (nominal composition Na0.5MnO2.05), obtained by reducing NaMnO4 with fumaric acid and aqueous solutions of NaI, respectively. These layered phases become tunnel Na0.44MnO2type structures upon heating above 600 uC. The origin of this difference may be the low sodium content relative to our experiments. In fact, it has been suggested that if the Na1 content in the NaxMnO2 system is below a certain level (x v 0.5) then the three-dimensional structure is stabilized in relation to the layered one.20 However, this explanation fails in a product of empirical composition Na0.33MnO2.04 obtained by calcination at 800 uC of a xerogel prepared from an aqueous solution of NaMnO4.H2O and glucose.21 The XRD pattern for this calcined product matches those of layered manganese ˚ , which exhibit additional oxides with d-spacings near 5.5 A peaks belonging to unidentified phases. Also, this bronze ˚ hydrated phase exhibits a rather special behavior in that the 7 A ˚ phase. heated at 800 uC yields Mn3O4 instead of the 5.5 A Electrochemical behavior in Na cells All electrochemical data were obtained for the sample calcined at 800 uC, of a high purity and with a well defined structure, as shown above. The voltage profiles for the first discharge and charge, recorded by using a current density of 0.1 mA cm22 in the galvanostatic mode, are shown in Fig. 5. The initial opencircuit emf was around 2.8 V and about 0.3 sodium per formula unit was incorporated into the structure at a cut-off voltage of 2 V. This value is consistent with structural and composition criteria as the maximum Na uptake should be around 0.4 mol per formula unit. The discharge curve exhibits two well-defined plateaux of similar length, suggesting that the intercalation of sodium proceeds as a multiphase system. However, the presence of only two plateaux is in contrast with the many small sloping steps observed in the Na/Na0.7CoO2 (P2 structure) system as reported by different groups.7,22 In spite of the shape complexity of the discharge curve for this latter system, the P2 structure is retained throughout the potential
Fig. 5 (A) First galvanostatic discharge and charge curve for Na/ Na0.6MnO2 cell; small letters indicate the positions where the cells were switched off to perform ex situ X-ray measurements. (B) Differential capacity vs. voltage plots for the first discharge and charge of the cell.
range recorded (3.5–2.0 V). We monitored structural changes in the material at the different steps of the intercalation/ de-intercalation process via ex situ XRD measurements. Figs. 6a, b, c and d show the XRD patterns obtained at different depths, labelled according to their relationship with the galvanostatic curves (Fig. 5A). One common feature of these spectra is their similarity to that of the host (Fig. 1b); however, their poor quality prevents structure refinement. In ˚ is well-defined; all others fact, only the reflection at ca. 5.5 A (particularly those with h and/or k | 0) are broad and very weak, which makes it difficult to ascertain an increase in orthorhombic distortion (otherwise reasonable owing to the increase in Mn31 content upon sodium intercalation).In any case, the peak broadening observed might reflect the effect of Jahn-Teller distortion. Moreover, minor changes affect lattice parameters. In particular, the interlayer spacing has a slight tendency to contract as the sodium content increases: it changes ˚ when 0.3 sodium atoms per formula from 11.153 to 11.036 A unit are incorporated. These changes are much smaller than those observed in electrochemical measurements of the Na/ Na0.7CoO2 system.23 Unfortunately, these data do not allow one to unequivocally establish the origin of the two plateaux in the discharge curve. Ascribing them to the distribution of the Na1 ions intercalated between the two available prismatic sites would be inconsistent with energy considerations. Nor can a phase transition from a P2 to an O3 type structure (found in a-NaMnO2) be inferred from our results. The charge curve (Fig. 5A) exhibits the same features: two plateaux similar to those in the discharge curve, which reveal the quasi-reversibility of the intercalation process (at least in the J. Mater. Chem., 2002, 12, 1142–1147
1145
Fig. 6 XRD patterns for the Na0.6MnO2 layered bronze cathode obtained at different stages [shown in Fig. 5(A)] during the sodium insertion/de-insertion process. (*, graphite reflection; #, hydrate phase).
first cycle). This is better envisaged by using differential specific capacity plots calculated from adjacent voltage–time data points.24 Fig. 5B shows the dq/(mdV) plot for the first discharge/charge cycle. The reversibility of the reduction–oxidation process is apparent from the symmetrical anodic and cathodic waves obtained. Also, worth noting is the slight hysteresis in the peaks (0.05 and 0.1 V in the high- and lowvoltage peaks, respectively). This suggests that the most likely structural changes undergone by the host involve ordering of sodium ions among available sites rather than a first-order transition. In fact, no new phases were detected when all inserted sodium was removed (Fig. 6c). Distortions or relative shifts in Mn–O layers also probably occur, which may account for the crystallinity loss apparent from the XRD patterns. If the charge process is continued to a cut-off voltage of 3.8 V, the curve exhibits several small steps associated with the extrusion of another 0.3 Na1 ions per formula unit. Removal of these ions heavily deteriorates the host structure, so much so that ˚ peak is barely discernible (Fig. 6d). Again, only the 5.5 A changes in the interlayer spacing are insubstantial.25 The two-phase system found after removing Na1 from P2-Na2/3[Ni1/3Mn2/3]O226 is not observed; however, the partially deintercalated material has a strong tendency to react with water. In fact, the XRD pattern for a sample immediately following withdrawal from the dry box, covered with Mylar, exhibited a ˚ that can be assigned to a hydrated weak reflection at ca. 7.2 A phase. When the Mylar was removed and the XRD pattern immediately recorded, this hydrated phase was the sole phase observed (see Fig. 6e). Fig. 7a shows the voltage profiles for the Na/Na0.6MnO2 cell in the second, fourth and eighth cycle over the 2.0–3.8 V range. 1146
J. Mater. Chem., 2002, 12, 1142–1147
Fig. 7 (a) Charge–discharge curves for an Na/Na0.6MnO2 cell cycled over the voltage range 3.8–2.0 V. (b) Differential capacity vs. voltage plots for the cell. (c) Variation of the specific capacity with the number of cycles; voltage window: (&) 3.8–2.0 V; ($) 3.0–2.0 V.
The differential specific capacity plots are shown in Fig. 6b. As can be seen, the peak intensity decreased on cycling, the effect being more pronounced in the low voltage peak. In fact, this peak was hardly visible after the eighth cycle, which reveals decreased reversibility in the intercalation/de-intercalation reaction of Na1 ions. The specific capacity of the cell as a function of the number of cycles is shown in Fig. 6c. Although the cell can deliver ca. 140 A h kg21 over the first few cycles, its capacity declines (thus reflecting the reversibility loss of the sodium extraction/insertion process) on successive cycling. Narrowing the voltage range used for cycling to 2.0–3.0 V (under these conditions the amount of sodium removed essentially coincided with that of electrochemically inserted sodium) also failed to improve cell cyclability. The capacity (Fig. 6d) also faded after the first few cycles. The continuous strain and distortions resulting from the insertion and extraction of Na1 ions caused the structure to gradually collapse because of its limited flexibility. In fact, a quasiamorphous phase was obtained beyond the eighth cycle. This contradicts the behaviour of Na/P2-NaxCoO2 cells, the cycling properties of which are indeed outstanding, in spite of the many steps involved in the intercalation/de-intercalation processes (as suggested by the voltage–composition curves), which affect both the electronic and the structural properties.7 A straight forward explanation based on Jahn-Teller distortion affecting Mn31 in a weak field configuration (absent from Co31) as the origin of the difference is scarcely convincing since bronzes with a tunnel structure, such as Na0.44MnO2, also exhibit excellent capacity retention in sodium cells.13
Conclusion A sol–gel synthetic pathway based on the reaction between Mn(acac)3 and Na2CO3 dissolved in propionic acid was found to be an attractive method for preparing anhydrous layered sodium manganese bronzes of nominal composition Na0.6MnO2 that are stable at high temperatures. In contrast, a direct solid-state reaction between the two precursors yields bronzes with a three-dimensional structure. The particles in this layered phase possess a high crystallinity and crystallize in the hexagonal system (P63/mmc space group). Thus, they adopt a P2-type structure with an ABBA stacking sequence for oxygen layers and Mn and Na atoms distributed over octahedral and trigonal prismatic positions, respectively. The shape of the voltage vs. composition curves for the Na/ NaxMnO2 cells reveals that the intercalation of Na occurs in several steps and is reversible only over the first few cycles. Although no new crystallographic phase was detected, the continuous insertion and removal of Na1 progressively degrades the structure and the active material becomes amorphous after the first eight cycles. In this situation, the cell capacity fades upon successive cycling.
Acknowledgement This work was funded by the Junta de Andalucı´a (Group FQM-175).
References 1 J. P. Parant, R. Olazcuaga, M. Devallete, C. Fouassier and P. Hagenmuller, J. Solid State Chem., 1971, 3, 1. 2 P. Le Goff, N. Baffier, S. Bach, J. P. Pereira-Ramos and R. Messina, Solid State Ionics, 1993, 61, 309. 3 A. R. Amstrong and P. G. Bruce, Nature, 1996, 381, 499.
4 F. Capitaine, P. Gravereau and C. Delmas, Solid State Ionics, 1996, 89, 197. 5 Y. U. Jeong and A. Manthiram, Electrochem. Solid State Lett., 1999, 2, 421. 6 J. M. Paulsen, C. L. Thomas and J. R. Dahn, J. Electrochem. Soc., 1999, 146, 3560. 7 L. W. Shacklette, T. R. Jow and L. Townsend, J. Electrochem. Soc., 1988, 135, 2669. 8 S. Bach, J. P. Pereira-Ramos and N. Baffier, J. Solid State Chem., 1995, 120, 70. 9 R. Chen, T. Chiragyl, P. Zavalij and M. S. Whittingham, Solid State Ionics, 1996, 86–88, 1. 10 S. Franger, S. Bach, J. P. Pereira-Ramos and N. Baffier, J. Electrochem. Soc., 2000, 147, 3226. 11 S. Ching, J. A. Landrigan, M. L. Jorgensen, N. Duan and S. L. Suib, Chem. Mater., 1995, 7, 1604. 12 J. M. Paulsen and J. R. Dahn, Solid Sate Ionics, 1999, 126, 3. 13 M. M. Doeff, M. Y. Peng, Y. Ma and L. C. De Jonghe, J. Electrochem. Soc., 1994, 141, L145. 14 L. Herna´n, J. Morales, L. Sa´nchez, J. Santos and E. Rodrı´guez Castello´n, Solid State Ionics, 2000, 133, 179. 15 S. Hirano, R. Narita and S. Naka, Mater. Res. Bull., 1984, 19, 1229. 16 S. H. Kim, S. J. Kim and S. M. Oh, Chem. Mater., 1999, 11, 557. 17 H. M. Rietveld, J. Appl. Crystallogr., 1969, 2, 65. 18 A. C. Larson and R. B. von Dreele, Los Alamos National Lab. Rep. No. LA-UR-86-748, 1994. 19 W. A. Dollase, J. Appl. Crystallogr., 1986, 19, 267. 20 M. M. Doeff, T. J. Richardson and L. Kepley, J. Electrochem. Soc., 1996, 143, 2507. 21 S. Ching, D. J. Petrovay and M. L. Jorgensen, Inorg. Chem., 1997, 36, 883. 22 Y. Ma, M. M. Doeff, S. J. Visco and L. C. De Jonghe, J. Electrochem. Soc., 1993, 140, 2726. 23 J. J. Braconnier, C. Delmas, C. Fouassier and P. Hagenmuller, Mater. Res. Bull., 1980, 15, 1797. 24 I. A. Courtney and J. R. Dahn, J. Electrochem. Soc., 1997, 144, 2943. 25 A. Mendiboure, C. Delmas and P. Hagenmuller, J. Solid State Chem., 1985, 57, 323. 26 Z. Lu and J. R. Dahn, J. Electrochem. Soc., 2001, 148, A710.
J. Mater. Chem., 2002, 12, 1142–1147
1147